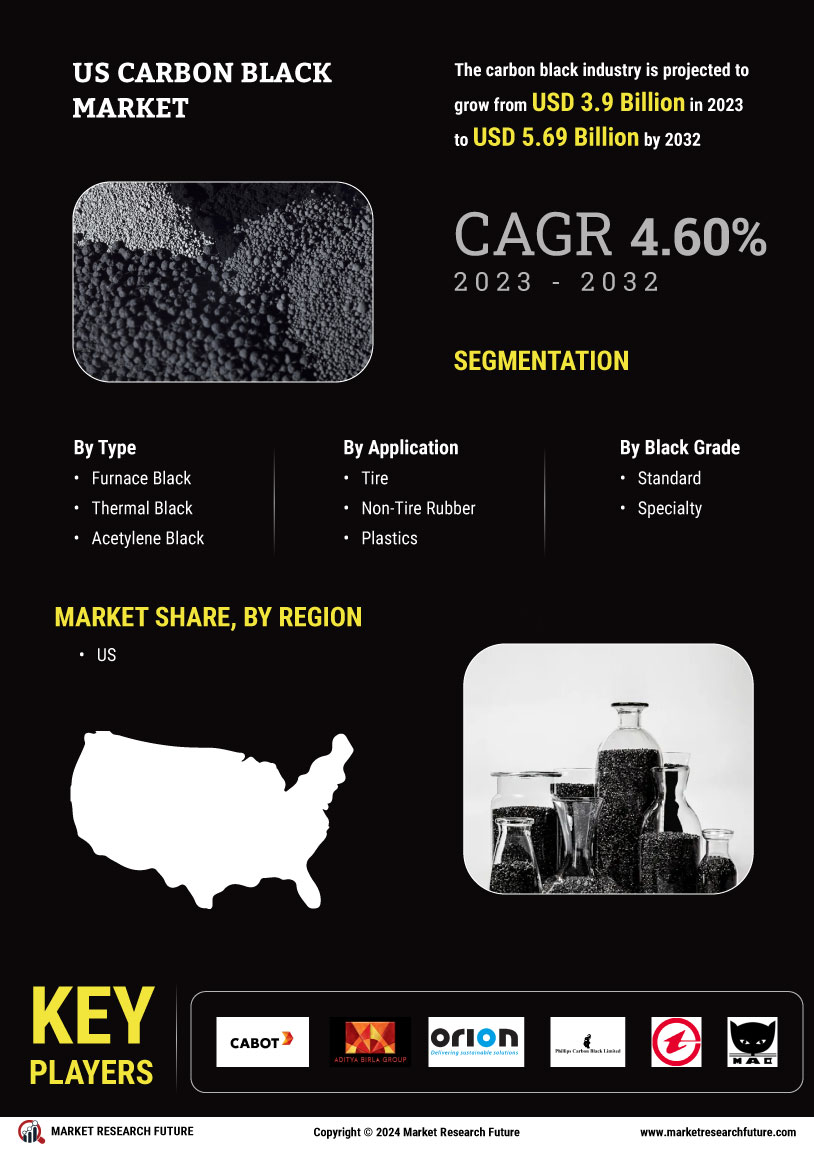
Request Free Sample ×

Kindly complete the form below to receive a free sample of this Report

* Please use a valid business email

Leading companies partner with us for data-driven Insights

clients tt-cursor
Hero Background

US Carbon Black Market

ID: MRFR/CnM/12433-HCR
111 Pages
Chitranshi Jaiswal
Last Updated: April 06, 2026

US Carbon Black Market Research Report Information By Process Type (Furnace Black, Thermal Black, Acetylene Black, and Others), By Grade (Standard and Specialty), and By Application (Tire, Non-Tire Rubber, Plastics, Inks & Toners, and Others) –Market Forecast Till 2035

Share:
Download PDF ×

We do not share your information with anyone. However, we may send you emails based on your report interest from time to time. You may contact us at any time to opt-out.

US Carbon Black Market Infographic
Purchase Options
  1. 1 SECTION I: EXECUTIVE SUMMARY AND KEY HIGHLIGHTS
  2.   1.1 EXECUTIVE SUMMARY
  3.     1.1.1 Market Overview
  4.     1.1.2 Key Findings
  5.     1.1.3 Market Segmentation
  6.     1.1.4 Competitive Landscape
  7.     1.1.5 Challenges and Opportunities
  8.     1.1.6 Future Outlook
  9. 2 SECTION II: SCOPING, METHODOLOGY AND MARKET STRUCTURE
  10.   2.1 MARKET INTRODUCTION
  11.     2.1.1 Definition
  12.     2.1.2 Scope of the study
  13.       2.1.2.1 Research Objective
  14.       2.1.2.2 Assumption
  15.       2.1.2.3 Limitations
  16.   2.2 RESEARCH METHODOLOGY
  17.     2.2.1 Overview
  18.     2.2.2 Data Mining
  19.     2.2.3 Secondary Research
  20.     2.2.4 Primary Research
  21.       2.2.4.1 Primary Interviews and Information Gathering Process
  22.       2.2.4.2 Breakdown of Primary Respondents
  23.     2.2.5 Forecasting Model
  24.     2.2.6 Market Size Estimation
  25.       2.2.6.1 Bottom-Up Approach
  26.       2.2.6.2 Top-Down Approach
  27.     2.2.7 Data Triangulation
  28.     2.2.8 Validation
  29. 3 SECTION III: QUALITATIVE ANALYSIS
  30.   3.1 MARKET DYNAMICS
  31.     3.1.1 Overview
  32.     3.1.2 Drivers
  33.     3.1.3 Restraints
  34.     3.1.4 Opportunities
  35.   3.2 MARKET FACTOR ANALYSIS
  36.     3.2.1 Value chain Analysis
  37.     3.2.2 Porter's Five Forces Analysis
  38.       3.2.2.1 Bargaining Power of Suppliers
  39.       3.2.2.2 Bargaining Power of Buyers
  40.       3.2.2.3 Threat of New Entrants
  41.       3.2.2.4 Threat of Substitutes
  42.       3.2.2.5 Intensity of Rivalry
  43.     3.2.3 COVID-19 Impact Analysis
  44.       3.2.3.1 Market Impact Analysis
  45.       3.2.3.2 Regional Impact
  46.       3.2.3.3 Opportunity and Threat Analysis
  47. 4 SECTION IV: QUANTITATIVE ANALYSIS
  48.   4.1 Chemicals and Materials, BY Application (USD Billion)
  49.     4.1.1 Tire Manufacturing
  50.     4.1.2 Plastics
  51.     4.1.3 Coatings
  52.     4.1.4 Inks
  53.     4.1.5 Adhesives
  54.   4.2 Chemicals and Materials, BY End Use (USD Billion)
  55.     4.2.1 Automotive
  56.     4.2.2 Industrial
  57.     4.2.3 Consumer Goods
  58.     4.2.4 Electronics
  59.   4.3 Chemicals and Materials, BY Type (USD Billion)
  60.     4.3.1 Natural Carbon Black
  61.     4.3.2 Synthetic Carbon Black
  62.     4.3.3 Specialty Carbon Black
  63.   4.4 Chemicals and Materials, BY Production Method (USD Billion)
  64.     4.4.1 Furnace Black Process
  65.     4.4.2 Channel Black Process
  66.     4.4.3 Thermal Black Process
  67.   4.5 Chemicals and Materials, BY Grade (USD Billion)
  68.     4.5.1 Standard Grade
  69.     4.5.2 High-Performance Grade
  70.     4.5.3 Specialty Grade
  71. 5 SECTION V: COMPETITIVE ANALYSIS
  72.   5.1 Competitive Landscape
  73.     5.1.1 Overview
  74.     5.1.2 Competitive Analysis
  75.     5.1.3 Market share Analysis
  76.     5.1.4 Major Growth Strategy in the Chemicals and Materials
  77.     5.1.5 Competitive Benchmarking
  78.     5.1.6 Leading Players in Terms of Number of Developments in the Chemicals and Materials
  79.     5.1.7 Key developments and growth strategies
  80.       5.1.7.1 New Product Launch/Service Deployment
  81.       5.1.7.2 Merger & Acquisitions
  82.       5.1.7.3 Joint Ventures
  83.     5.1.8 Major Players Financial Matrix
  84.       5.1.8.1 Sales and Operating Income
  85.       5.1.8.2 Major Players R&D Expenditure. 2023
  86.   5.2 Company Profiles
  87.     5.2.1 Continental Carbon (US)
  88.       5.2.1.1 Financial Overview
  89.       5.2.1.2 Products Offered
  90.       5.2.1.3 Key Developments
  91.       5.2.1.4 SWOT Analysis
  92.       5.2.1.5 Key Strategies
  93.     5.2.2 Cabot Corporation (US)
  94.       5.2.2.1 Financial Overview
  95.       5.2.2.2 Products Offered
  96.       5.2.2.3 Key Developments
  97.       5.2.2.4 SWOT Analysis
  98.       5.2.2.5 Key Strategies
  99.     5.2.3 Orion Engineered Carbons (US)
  100.       5.2.3.1 Financial Overview
  101.       5.2.3.2 Products Offered
  102.       5.2.3.3 Key Developments
  103.       5.2.3.4 SWOT Analysis
  104.       5.2.3.5 Key Strategies
  105.     5.2.4 Continental Carbon (US)
  106.       5.2.4.1 Financial Overview
  107.       5.2.4.2 Products Offered
  108.       5.2.4.3 Key Developments
  109.       5.2.4.4 SWOT Analysis
  110.       5.2.4.5 Key Strategies
  111.     5.2.5 Tokai Carbon (US)
  112.       5.2.5.1 Financial Overview
  113.       5.2.5.2 Products Offered
  114.       5.2.5.3 Key Developments
  115.       5.2.5.4 SWOT Analysis
  116.       5.2.5.5 Key Strategies
  117.     5.2.6 Mitsubishi Chemical Corporation (US)
  118.       5.2.6.1 Financial Overview
  119.       5.2.6.2 Products Offered
  120.       5.2.6.3 Key Developments
  121.       5.2.6.4 SWOT Analysis
  122.       5.2.6.5 Key Strategies
  123.     5.2.7 Phillips Carbon Black (US)
  124.       5.2.7.1 Financial Overview
  125.       5.2.7.2 Products Offered
  126.       5.2.7.3 Key Developments
  127.       5.2.7.4 SWOT Analysis
  128.       5.2.7.5 Key Strategies
  129.     5.2.8 SABIC (US)
  130.       5.2.8.1 Financial Overview
  131.       5.2.8.2 Products Offered
  132.       5.2.8.3 Key Developments
  133.       5.2.8.4 SWOT Analysis
  134.       5.2.8.5 Key Strategies
  135.   5.3 Appendix
  136.     5.3.1 References
  137.     5.3.2 Related Reports
  138. 6 LIST OF FIGURES
  139.   6.1 MARKET SYNOPSIS
  140.   6.2 US MARKET ANALYSIS BY APPLICATION
  141.   6.3 US MARKET ANALYSIS BY END USE
  142.   6.4 US MARKET ANALYSIS BY TYPE
  143.   6.5 US MARKET ANALYSIS BY PRODUCTION METHOD
  144.   6.6 US MARKET ANALYSIS BY GRADE
  145.   6.7 KEY BUYING CRITERIA OF CHEMICALS AND MATERIALS
  146.   6.8 RESEARCH PROCESS OF MRFR
  147.   6.9 DRO ANALYSIS OF CHEMICALS AND MATERIALS
  148.   6.10 DRIVERS IMPACT ANALYSIS: CHEMICALS AND MATERIALS
  149.   6.11 RESTRAINTS IMPACT ANALYSIS: CHEMICALS AND MATERIALS
  150.   6.12 SUPPLY / VALUE CHAIN: CHEMICALS AND MATERIALS
  151.   6.13 CHEMICALS AND MATERIALS, BY APPLICATION, 2024 (% SHARE)
  152.   6.14 CHEMICALS AND MATERIALS, BY APPLICATION, 2024 TO 2035 (USD Billion)
  153.   6.15 CHEMICALS AND MATERIALS, BY END USE, 2024 (% SHARE)
  154.   6.16 CHEMICALS AND MATERIALS, BY END USE, 2024 TO 2035 (USD Billion)
  155.   6.17 CHEMICALS AND MATERIALS, BY TYPE, 2024 (% SHARE)
  156.   6.18 CHEMICALS AND MATERIALS, BY TYPE, 2024 TO 2035 (USD Billion)
  157.   6.19 CHEMICALS AND MATERIALS, BY PRODUCTION METHOD, 2024 (% SHARE)
  158.   6.20 CHEMICALS AND MATERIALS, BY PRODUCTION METHOD, 2024 TO 2035 (USD Billion)
  159.   6.21 CHEMICALS AND MATERIALS, BY GRADE, 2024 (% SHARE)
  160.   6.22 CHEMICALS AND MATERIALS, BY GRADE, 2024 TO 2035 (USD Billion)
  161.   6.23 BENCHMARKING OF MAJOR COMPETITORS
  162. 7 LIST OF TABLES
  163.   7.1 LIST OF ASSUMPTIONS
  164.     7.1.1
  165.   7.2 US MARKET SIZE ESTIMATES; FORECAST
  166.     7.2.1 BY APPLICATION, 2025-2035 (USD Billion)
  167.     7.2.2 BY END USE, 2025-2035 (USD Billion)
  168.     7.2.3 BY TYPE, 2025-2035 (USD Billion)
  169.     7.2.4 BY PRODUCTION METHOD, 2025-2035 (USD Billion)
  170.     7.2.5 BY GRADE, 2025-2035 (USD Billion)
  171.   7.3 PRODUCT LAUNCH/PRODUCT DEVELOPMENT/APPROVAL
  172.     7.3.1
  173.   7.4 ACQUISITION/PARTNERSHIP
  174.     7.4.1

US Chemicals and Materials Market Segmentation

Chemicals and Materials By Application (USD Billion, 2025-2035)

  • Tire Manufacturing
  • Plastics
  • Coatings
  • Inks
  • Adhesives

Chemicals and Materials By End Use (USD Billion, 2025-2035)

  • Automotive
  • Industrial
  • Consumer Goods
  • Electronics

Chemicals and Materials By Type (USD Billion, 2025-2035)

  • Natural Carbon Black
  • Synthetic Carbon Black
  • Specialty Carbon Black

Chemicals and Materials By Production Method (USD Billion, 2025-2035)

  • Furnace Black Process
  • Channel Black Process
  • Thermal Black Process

Chemicals and Materials By Grade (USD Billion, 2025-2035)

  • Standard Grade
  • High-Performance Grade
  • Specialty Grade

Compare Licence

×
Features License Type
Single User Multiuser License Enterprise User
Price $4,950 $5,950 $7,250
Maximum User Access Limit 1 User Upto 10 Users Unrestricted Access Throughout the Organization
Free Customization
Direct Access to Analyst
Deliverable Format
Platform Access
Discount on Next Purchase 10% 15% 15%
Printable Versions