US Security, Access Control and Robotics Market Segmentation
Security, Access Control and Robotics By Application (USD Million, 2025-2035)
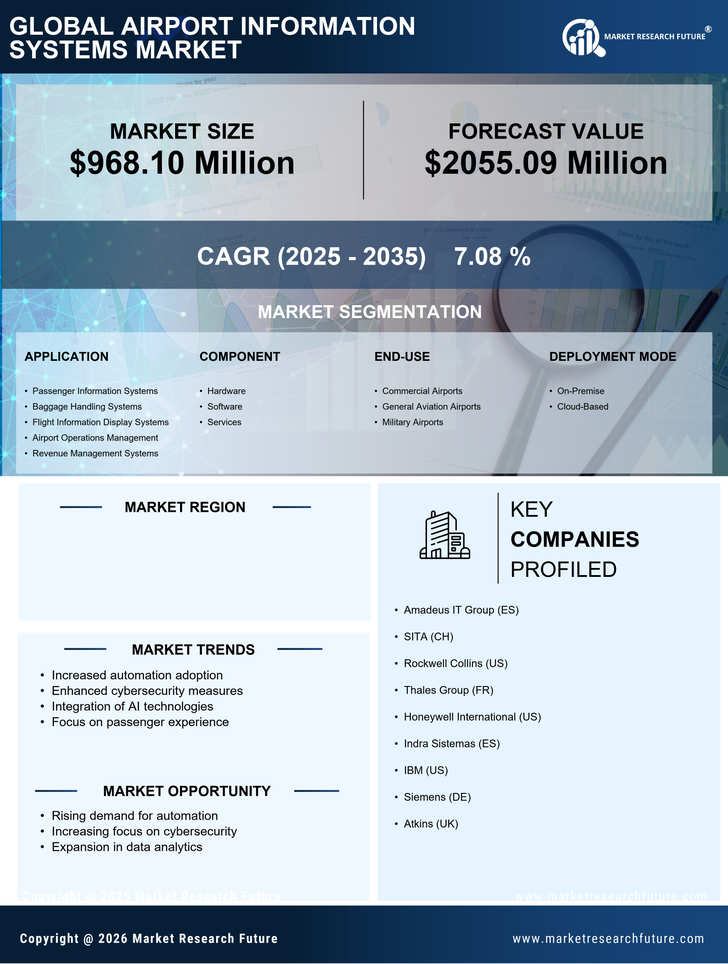
- Passenger Information Systems
- Baggage Handling Systems
- Flight Information Display Systems
- Airport Operations Management
- Revenue Management Systems
Security, Access Control and Robotics By Component (USD Million, 2025-2035)
- Hardware
- Software
- Services
Security, Access Control and Robotics By End-use (USD Million, 2025-2035)
- Commercial Airports
- General Aviation Airports
- Military Airports
Security, Access Control and Robotics By Deployment Mode (USD Million, 2025-2035)
- On-Premise
- Cloud-Based