Uninterruptible Power Supply (UPS) Market (2026 - 2035)

ID: MRFR/EnP/5160-CR 128 Pages Priya Nagrale Last Updated: October 16, 2026
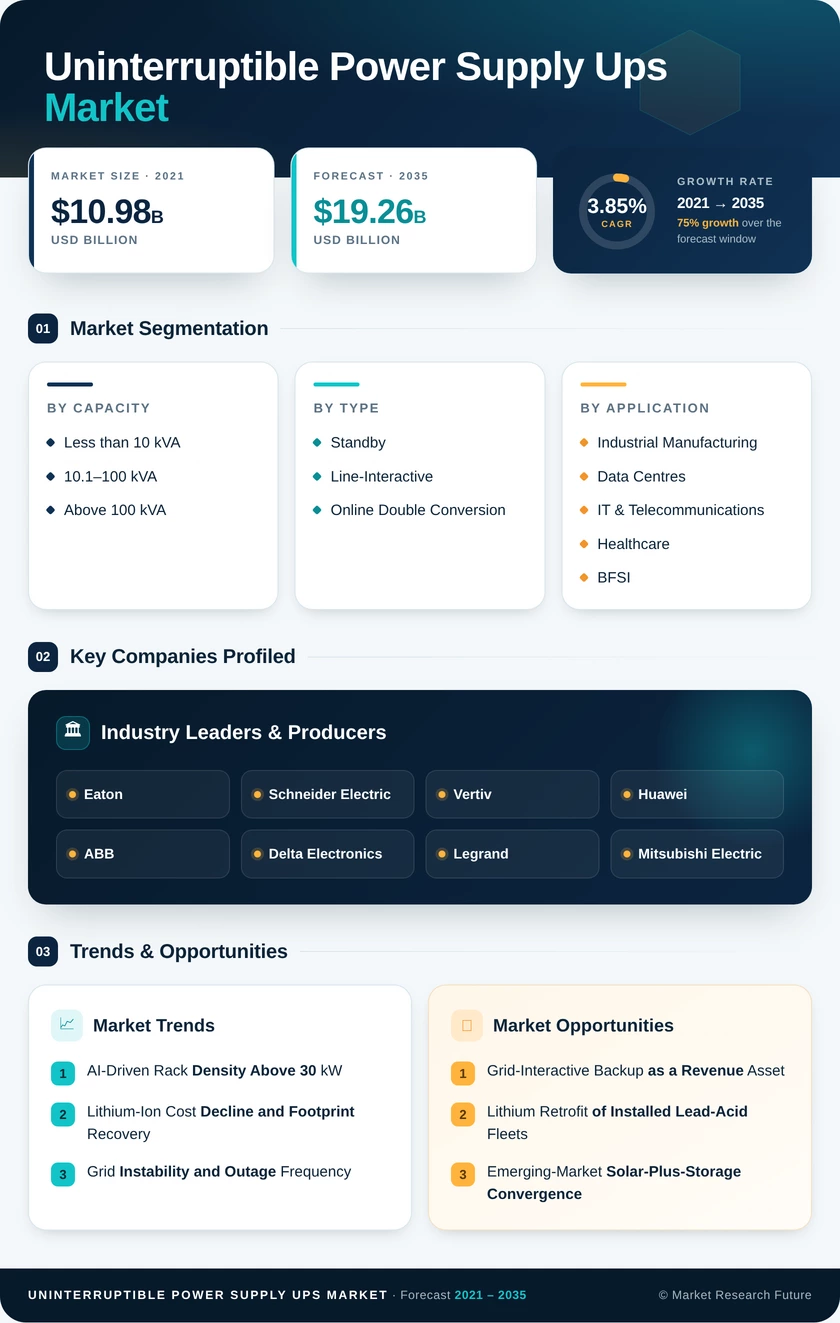
Uninterruptible Power Supply (UPS) Market Research Report By Capacity (Less than 10 kVA, 10.1–100 kVA, Above 100 kVA), By Type (Standby, Line-Interactive, Online Double Conversion), By Application (Industrial Manufacturing, Data Centres, IT & Telecommunications, Healthcare, BFSI, Residential & Commercial, Transportation & Infrastructure), By Battery Type (Valve-Regulated Lead-Acid, Lithium-Ion, Nickel-Cadmium & Others) - Forecast to 2035
Uninterruptible Power Supply (UPS) Market
Market Size
Forecast Period2026-2035
CAGR (2026-2035)3.85%
2025 Market SizeUSD 13.10 Billion
2035 Market SizeUSD 19.26 Billion
Key Players
Eaton
Schneider Electric
Vertiv
Huawei
ABB
Delta Electronics
Opportunities
  • Grid-Interactive Backup as a Revenue Asset
  • Lithium Retrofit of Installed Lead-Acid Fleets
  • Emerging-Market Solar-Plus-Storage Convergence
  1. 1 Market Summary | |
    1. 1.1 Study Assumptions & Market Definition | |
    2. 1.2 Scope of the Study | |
    3. 1.3 Research Methodology | |
  2. 2 Key Report Takeaways | |
    1. 2.1 By Technology | |
    2. 2.2 By Sector | |
    3. 2.3 By Region | |
  3. 3 Market Size & Forecast (2021–2035) | |
    1. 3.1 Historical Market Size (2021–2024) | |
    2. 3.2 Base Year Assessment (2025) | |
    3. 3.3 Forecast Market Size (2026–2035) | |
    4. 3.4 Year-over-Year Growth Analysis | |
  4. 4 Driver Impact Analysis | |
    1. 4.1 AI-Driven Rack Density Above 30 kW | |
    2. 4.2 Lithium-Ion Cost Decline and Footprint Recovery | |
    3. 4.3 Grid Instability and Outage Frequency | |
    4. 4.4 Industrial Automation and Process Continuity | |
    5. 4.5 Healthcare and Life-Safety Continuity Mandates | |
    6. 4.6 Edge Computing and 5G Aggregation Sites | |
    7. 4.7 Battery-as-a-Service Commercial Models | |
  5. 5 Restraints Impact Analysis | |
    1. 5.1 Power Semiconductor Lead Times | |
    2. 5.2 Lithium Fire-Code and Permitting Friction | |
    3. 5.3 Price Compression from Regional Challengers | |
    4. 5.4 Field Service and Commissioning Labour Scarcity | |
    5. 5.5 Extended Replacement Cycles in Mature Installs | |
  6. 6 Opportunities | |
    1. 6.1 Grid-Interactive Backup as a Revenue Asset | |
    2. 6.2 Lithium Retrofit of Installed Lead-Acid Fleets | |
    3. 6.3 Emerging-Market Solar-Plus-Storage Convergence | |
    4. 6.4 Fleet Telemetry and Predictive-Maintenance Monetisation | |
    5. 6.5 Second-Life Battery Channel Development | |
  7. 7 Regional Market Share & Country-Level Analysis | |
    1. 7.1 North America | | |
      1. 7.1.1 US | | |
      2. 7.1.2 Canada | | |
      3. 7.1.3 Mexico | |
    2. 7.2 Europe | | |
      1. 7.2.1 Germany | | |
      2. 7.2.2 UK | | |
      3. 7.2.3 France | | |
      4. 7.2.4 Italy | | |
      5. 7.2.5 Spain | | |
      6. 7.2.6 Nordic Countries | | |
      7. 7.2.7 Russia | | |
      8. 7.2.8 Rest of Europe | |
    3. 7.3 Asia-Pacific | | |
      1. 7.3.1 China | | |
      2. 7.3.2 India | | |
      3. 7.3.3 Japan | | |
      4. 7.3.4 South Korea | | |
      5. 7.3.5 ASEAN | | |
      6. 7.3.6 Rest of Asia-Pacific | |
    4. 7.4 South America | | |
      1. 7.4.1 Brazil | | |
      2. 7.4.2 Argentina | | |
      3. 7.4.3 Rest of South America | |
    5. 7.5 Middle East & Africa | | |
      1. 7.5.1 Saudi Arabia | | |
      2. 7.5.2 UAE | | |
      3. 7.5.3 South Africa | | |
      4. 7.5.4 Egypt | | |
      5. 7.5.5 Rest of Middle East & Africa | |
  8. 8 Future Outlook (2026–2035) | |
    1. 8.1 Autonomous Fleet Operations | |
    2. 8.2 Electrification Supercycle | |
    3. 8.3 Sustainability Disclosure and Circularity | |
    4. 8.4 Convergence with Behind-the-Meter Storage | |
  9. 9 Segmentation Analysis | |
    1. 9.1 By Capacity | | |
      1. 9.1.1 Less than 10 kVA | | |
      2. 9.1.3 Above 100 kVA | |
    2. 10.1–100 kVA | | |
    3. 9.2 By Type | | |
      1. 9.2.1 Standby | | |
      2. 9.2.2 Line-Interactive | | |
      3. 9.2.3 Online Double Conversion | |
    4. 9.3 By Application | | |
      1. 9.3.1 Industrial Manufacturing | | |
      2. 9.3.2 Data Centres | | |
      3. 9.3.3 IT & Telecommunications | | |
      4. 9.3.4 Healthcare | | |
      5. 9.3.5 BFSI | | |
      6. 9.3.6 Residential & Commercial | | |
      7. 9.3.7 Transportation & Infrastructure | |
    5. 9.4 By Battery Type | | |
      1. 9.4.1 Valve-Regulated Lead-Acid | | |
      2. 9.4.2 Lithium-Ion | | |
      3. 9.4.3 Nickel-Cadmium & Others | |
  10. 10 Competitive Landscape | |
    1. 10.1 Market Concentration Analysis (2026) | |
    2. 10.2 Competitive Benchmarking Matrix | |
    3. 10.3 Company Profiles | |
  11. 11 Recent News & Developments | |
  12. 12 Report Scope & Methodology | |
  13. 13 Detailed Sources & Citations | |
  14. 14 Frequently Asked Questions | | LIST OF TABLES | |
  15. TABLE 1 Global Uninterruptible Power Supply (UPS) Market Size & Forecast, by Revenue (USD Billion), 2021–2035 | |
  16. TABLE 2 Global Uninterruptible Power Supply (UPS) Market – Year-over-Year Growth Analysis, 2021–2035 | |
  17. TABLE 3 Driver Impact Analysis Matrix, 2026–2035 | |
  18. TABLE 4 Restraint Impact Analysis Matrix, 2026–2035 | |
  19. TABLE 5 Global Market Size, by Region, 2021–2035 (USD Billion) | |
  20. TABLE 6 North America Market Size, by Country, 2021–2035 (USD Billion) | |
  21. TABLE 7 Europe Market Size, by Country, 2021–2035 (USD Billion) | |
  22. TABLE 8 Asia-Pacific Market Size, by Country, 2021–2035 (USD Billion) | |
  23. TABLE 9 South America Market Size, by Country, 2021–2035 (USD Billion) | |
  24. TABLE 10 Middle East & Africa Market Size, by Country, 2021–2035 (USD Billion) | |
  25. TABLE 11 Global Market Size, by Capacity, 2021–2035 (USD Billion) | |
  26. TABLE 12 Global Market Size, by Type, 2021–2035 (USD Billion) | |
  27. TABLE 13 Global Market Size, by Application, 2021–2035 (USD Billion) | |
  28. TABLE 14 Global Market Size, by Battery Type, 2021–2035 (USD Billion) | |
  29. TABLE 15 North America Market Size, by Capacity and Type, 2021–2035 (USD Billion) | |
  30. TABLE 16 Europe Market Size, by Application and Battery Type, 2021–2035 (USD Billion) | |
  31. TABLE 17 Asia-Pacific Market Size, by Capacity and Application, 2021–2035 (USD Billion) | |
  32. TABLE 18 South America Market Size, by Type and Application, 2021–2035 (USD Billion) | |
  33. TABLE 19 Middle East & Africa Market Size, by Capacity and Battery Type, 2021–2035 (USD Billion) | |
  34. TABLE 20 Competitive Benchmarking Matrix, 2026 | |
  35. TABLE 21 Company Profiles – Key Players | |
  36. TABLE 22 Recent Developments & Strategic Announcements, 2023–2025 | |
  37. TABLE 23 Report Scope & Methodology Summary | |
  38. TABLE 24 Detailed Sources & Citations Index | | LIST OF FIGURES | |
  39. FIGURE 1 Market Dynamics – Drivers, Restraints, Opportunities and Challenges | |
  40. FIGURE 2 Industry Value Chain Analysis | |
  41. FIGURE 3 Porter's Five Forces Analysis | |
  42. FIGURE 4 Global Market Size Trend, 2021–2035 (USD Billion) | |
  43. FIGURE 5 Year-over-Year Growth Trend, 2022–2035 (%) | |
  44. FIGURE 6 Market Share by Capacity, 2025 vs 2035 (%) | |
  45. FIGURE 7 Market Share by Type, 2025 vs 2035 (%) | |
  46. FIGURE 8 Market Share by Application, 2025 (%) | |
  47. FIGURE 9 Market Share by Battery Type, 2025 vs 2035 (%) | |
  48. FIGURE 10 Regional Revenue Share, 2025 (%) | |
  49. FIGURE 11 Regional CAGR Comparison, 2026–2035 (%) | |
  50. FIGURE 12 Country-Level Growth Heat Map, 2026–2035 | |
  51. FIGURE 13 Competitive Landscape – Estimated Revenue Share Bands, 2026 | |
  52. FIGURE 14 Competitive Positioning Quadrant – Capability vs Geographic Reach | |
  53. FIGURE 15 Technology Adoption Curve – Lead-Acid to Lithium Transition, 2021–2035

Segmentation Quick Reference

DimensionSub-SegmentsDominant SegmentFastest Growing Segment
By CapacityLess than 10 kVA; 10.1–100 kVA; Above 100 kVALess than 10 kVAAbove 100 kVA
By TypeStandby; Line-Interactive; Online Double ConversionStandbyLine-Interactive
By ApplicationIndustrial Manufacturing; Data Centres; IT & Telecommunications; Healthcare; BFSI; Residential & Commercial; Transportation & InfrastructureIndustrial ManufacturingData Centres
By Battery TypeValve-Regulated Lead-Acid; Lithium-Ion; Nickel-Cadmium & OthersValve-Regulated Lead-AcidLithium-Ion
By RegionNorth America; Europe; Asia-Pacific; South America; Middle East & AfricaAsia-PacificAsia-Pacific


Market Segmentation Overview

By Capacity

Sub-SegmentKey Trend
Less than 10 kVAVolume-led demand tied to consumer price thresholds; e-commerce channel share rising
10.1–100 kVAStandardisation on rack-mount platforms across multi-site retail and clinical networks
Above 100 kVAMegawatt-class modular architectures displacing monolithic units in new builds


Capacity remains the clearest predictor of buying behaviour. Small units sell on price and shelf availability, mid-range systems on fleet standardisation, and large systems on engineered performance backed by service-level commitments. Revenue concentration continues to migrate upward as data-centre and industrial demand outpaces consumer replacement.

By Type

Sub-SegmentKey Trend
StandbyShare erodes gradually as buyers upgrade to voltage-regulating designs
Line-InteractiveFastest topology growth in markets with frequent sag and swell conditions
Online Double ConversionSilicon-carbide power stages lift efficiency above 98% at partial load


Topology selection increasingly follows grid quality rather than budget alone. Regions with deteriorating distribution reliability skew toward line-interactive and full-conversion designs, while stable-grid consumer markets sustain standby volumes. Efficiency gains in full-conversion products are narrowing the operating-cost penalty that historically favoured simpler topologies.

By Application

Sub-SegmentKey Trend
Industrial ManufacturingProtection scope expanding from plant level to individual process cells
Data CentresRack densities above 30 kW forcing complete power-train redesign
IT & TelecommunicationsDistributed edge and 5G aggregation sites multiplying small-unit demand
HealthcareImaging and surgical suites driving conditioned-power specification
BFSIContinuity regulation concentrating spend at core processing sites
Residential & CommercialOutage frequency lifting attach rates in reliability-stressed regions
Transportation & InfrastructureSignalling, tunnel systems and airport operations under resilience review


Application mix is rebalancing toward digital infrastructure without displacing the industrial core. Manufacturing retains the broadest installed base, but data centres contribute the largest incremental revenue each forecast year and will approach parity by the early 2030s.

By Battery Type

Sub-SegmentKey Trend
Valve-Regulated Lead-AcidDeclining share as 2027–2031 retirement cohorts convert to lithium
Lithium-IonIron-phosphate chemistry dominant; 30°C ambient tolerance removes cooling zones
Nickel-Cadmium & OthersRetained for rail, offshore, and extreme-temperature deployments


Chemistry transition is the most consequential product shift underway. Lithium adoption converts battery rooms into leasable space, reshapes maintenance economics, and creates a residual-value channel that did not previously exist. Fire-code administration and permitting timelines remain the principal brake on conversion pace in North America and Europe.




Download PDF ×

We do not share your information with anyone. However, we may send you emails based on your report interest from time to time. You may contact us at any time to opt-out.