Underwater Marine Iot Market (2026 - 2035)

ID: MRFR/ICT/37428-HCR 100 Pages Aarti Dhapte Last Updated: October 24, 2026
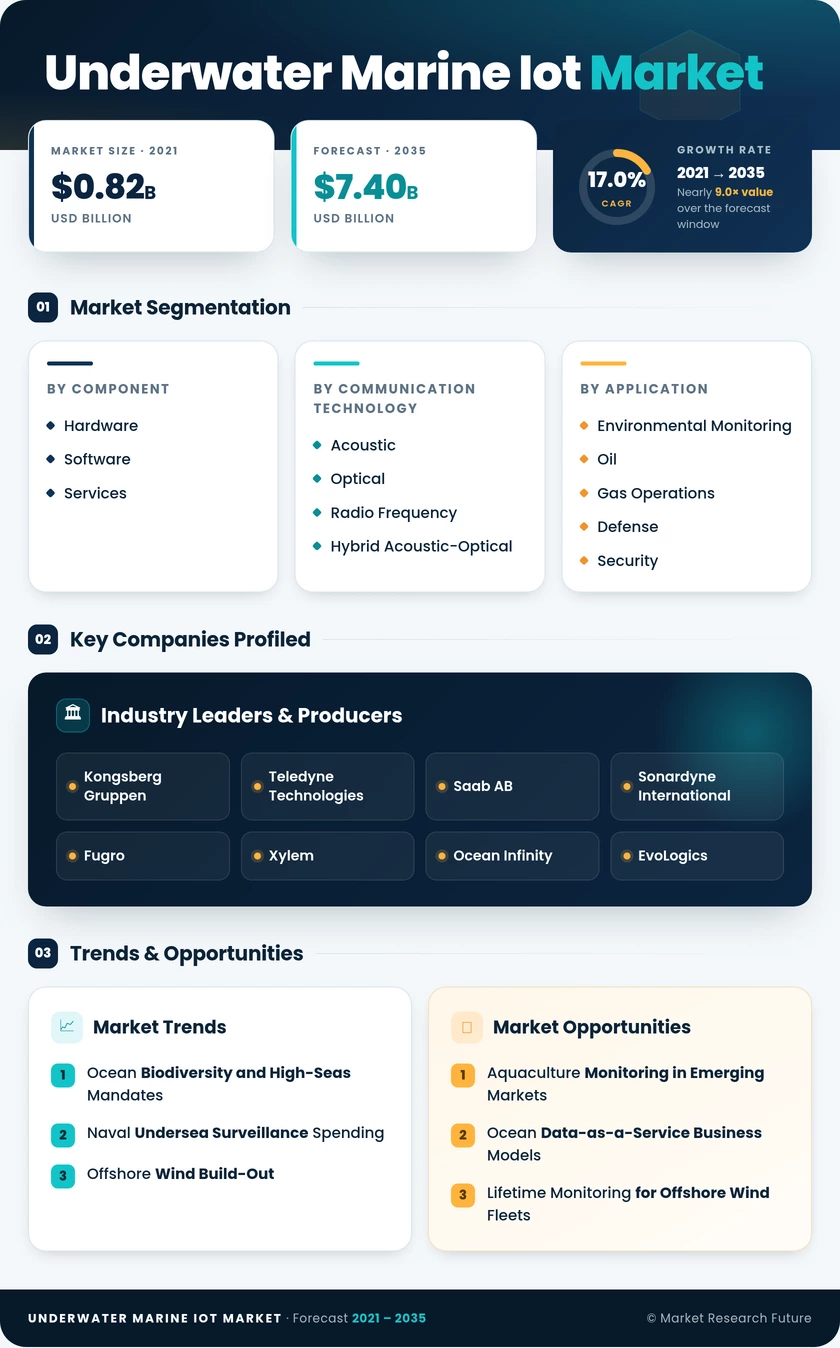
Underwater Marine IoT Market Size, Share and Research Report By Component (Hardware, Software, Services), By Communication Technology (Acoustic, Optical, Radio Frequency, Hybrid Acoustic-Optical, Magnetic Induction), By Application (Environmental Monitoring, Oil and Gas Operations, Defense and Security, Aquaculture and Fisheries, Underwater Research and Exploration, Offshore Renewable Energy, Smart Ports and Shipping, Disaster Monitoring and Early Warning, Others), By End-User (Government and Research Agencies, Offshore Energy Companies, Aquaculture Producers, Shipping and Maritime Logistics Firms, Defense/Naval Forces, Environmental NGOs and Conservation Organizations, Others) and By Regional (North America, Europe, South America, Asia Pacific, Middle East and Africa) - Industry Forecast to 2035.
Underwater Marine Iot Market
Market Size
Forecast Period2026-2035
CAGR (2026-2035)17.0%
2025 Market SizeUSD 1.54 Billion
2035 Market SizeUSD 7.40 Billion
Key Players
Kongsberg Gruppen
Teledyne Technologies
Saab AB
Sonardyne International
Fugro
Xylem
Opportunities
  • Aquaculture Monitoring in Emerging Markets
  • Ocean Data-as-a-Service Business Models
  • Lifetime Monitoring for Offshore Wind Fleets
  1. 1 Market Summary | |
  2. 2 Key Report Takeaways | |
    1. 2.1 By Component | |
    2. 2.2 By Communication Technology | |
    3. 2.3 By Application | |
    4. 2.4 By End-User | |
    5. 2.5 By Region | |
  3. 3 Market Size and Forecast (2021–2035) | |
    1. 3.1 Historical Market Size (2021–2025) | |
    2. 3.2 Forecast Market Size (2026–2035) | |
    3. 3.3 Year-over-Year Growth Analysis | |
  4. 4 Driver Impact Analysis | |
    1. 4.1 Ocean Biodiversity and High-Seas Mandates | |
    2. 4.2 Naval Undersea Surveillance Spending | |
    3. 4.3 Offshore Wind Build-Out | |
    4. 4.4 Aquaculture Digitalization | |
    5. 4.5 Advances in Underwater Modems and Edge Processing | |
    6. 4.6 Subsea Oil and Gas Asset Integrity Requirements | |
  5. 5 Restraints Impact Analysis | |
    1. 5.1 High Deployment and Maintenance Costs | |
    2. 5.2 Bandwidth and Range Limits of Underwater Links | |
    3. 5.3 Battery Endurance and Biofouling | |
    4. 5.4 Lack of Interoperability Standards | |
    5. 5.5 Cybersecurity and Data Sovereignty Restrictions | |
  6. 6 Opportunities | |
    1. 6.1 Aquaculture Monitoring in Emerging Markets | |
    2. 6.2 Ocean Data-as-a-Service Business Models | |
    3. 6.3 Lifetime Monitoring for Offshore Wind Fleets | |
    4. 6.4 Resident Vehicles and Subsea Docking Networks | |
  7. 7 Regional Market Share and Country-Level Analysis | |
    1. 7.1 North America | | |
      1. 7.1.1 United States | | |
      2. 7.1.2 Canada | | |
      3. 7.1.3 Mexico | |
    2. 7.2 Europe | | |
      1. 7.2.1 Germany | | |
      2. 7.2.2 UK | | |
      3. 7.2.3 France | | |
      4. 7.2.4 Italy | | |
      5. 7.2.5 Spain | | |
      6. 7.2.6 Nordic Countries | | |
      7. 7.2.7 Russia | | |
      8. 7.2.8 Rest of Europe | |
    3. 7.3 Asia-Pacific | | |
      1. 7.3.1 China | | |
      2. 7.3.2 India | | |
      3. 7.3.3 Japan | | |
      4. 7.3.4 South Korea | | |
      5. 7.3.5 ASEAN | | |
      6. 7.3.6 Rest of Asia-Pacific | |
    4. 7.4 South America | | |
      1. 7.4.1 Brazil | | |
      2. 7.4.2 Argentina | | |
      3. 7.4.3 Rest of South America | |
    5. 7.5 Middle East & Africa | | |
      1. 7.5.1 Saudi Arabia | | |
      2. 7.5.2 UAE | | |
      3. 7.5.3 South Africa | | |
      4. 7.5.4 Egypt | | |
      5. 7.5.5 Rest of MEA | |
  8. 8 Future Outlook (2026–2035) | |
    1. 8.1 Edge AI and Resident Autonomy | |
    2. 8.2 Platform Economics and Data Subscriptions | |
    3. 8.3 Offshore Energy Transition | |
    4. 8.4 Nature-Related Disclosure and Ocean ESG | |
  9. 9 Segmentation Analysis | |
    1. 9.1 By Component | | |
      1. 9.1.1 Hardware | | |
      2. 9.1.2 Software | | |
      3. 9.1.3 Services | |
    2. 9.2 By Communication Technology | | |
      1. 9.2.1 Acoustic | | |
      2. 9.2.2 Optical | | |
      3. 9.2.3 Radio Frequency | | |
      4. 9.2.4 Hybrid Acoustic-Optical | | |
      5. 9.2.5 Magnetic Induction | |
    3. 9.3 By Application | | |
      1. 9.3.1 Environmental Monitoring | | |
      2. 9.3.2 Oil and Gas Operations | | |
      3. 9.3.3 Defense and Security | | |
      4. 9.3.4 Aquaculture and Fisheries | | |
      5. 9.3.5 Underwater Research and Exploration | | |
      6. 9.3.6 Offshore Renewable Energy | | |
      7. 9.3.7 Smart Ports and Shipping | | |
      8. 9.3.8 Disaster Monitoring and Early Warning | | |
      9. 9.3.9 Others | |
    4. 9.4 By End-User | | |
      1. 9.4.1 Government and Research Agencies | | |
      2. 9.4.2 Offshore Energy Companies | | |
      3. 9.4.3 Aquaculture Producers | | |
      4. 9.4.4 Shipping and Maritime Logistics Firms | | |
      5. 9.4.5 Defense / Naval Forces | | |
      6. 9.4.6 Environmental NGOs and Conservation Orgs | | |
      7. 9.4.7 Others | |
  10. 10 Competitive Landscape | |
    1. 10.1 Market Concentration Analysis | |
    2. 10.2 Competitive Benchmarking Table | |
    3. 10.3 Company Profiles | | |
      1. 10.3.1 Kongsberg Gruppen | | |
      2. 10.3.2 Teledyne Technologies | | |
      3. 10.3.3 Saab AB | | |
      4. 10.3.4 Sonardyne International | | |
      5. 10.3.5 Fugro | | |
      6. 10.3.6 Xylem | | |
      7. 10.3.7 Ocean Infinity | | |
      8. 10.3.8 EvoLogics | | |
      9. 10.3.9 Nortek Group | | |
      10. 10.3.10 Hydromea | | |
      11. 10.3.11 Water Linked | |
  11. 11 Recent News & Developments | |
  12. 12 Report Scope and Methodology | |
  13. 13 Detailed Sources and Citations | |
  14. 14 Frequently Asked Questions (FAQs) | | LIST OF TABLES | |
  15. TABLE 1 Global Market Snapshot, 2025–2035 | |
  16. TABLE 2 Global Market Size & Forecast, by Revenue (USD Billion), 2021–2035 | |
  17. TABLE 3 Driver Impact Analysis | |
  18. TABLE 4 Restraints Impact Analysis | |
  19. TABLE 5 Regional Summary, 2025 | |
  20. TABLE 6 North America Market, by Country, 2025 | |
  21. TABLE 7 Europe Market, by Country, 2025 | |
  22. TABLE 8 Asia-Pacific Market, by Country, 2025 | |
  23. TABLE 9 South America Market, by Country, 2025 | |
  24. TABLE 10 Middle East & Africa Market, by Country, 2025 | |
  25. TABLE 11 Market Segmentation, by Component, 2025 | |
  26. TABLE 12 Market Segmentation, by Communication Technology, 2025 | |
  27. TABLE 13 Market Segmentation, by Application, 2025 | |
  28. TABLE 14 Market Segmentation, by End-User, 2025 | |
  29. TABLE 15 Competitive Benchmarking Table | |
  30. TABLE 16 Report Scope and Methodology | |
  31. TABLE 17 Detailed Sources and Citations | |
  32. TABLE 18 Segmentation Quick Reference | | LIST OF FIGURES | |
  33. FIGURE 1 Market Dynamics Overview (Drivers, Restraints, Opportunities) | |
  34. FIGURE 2 Industry Value Chain Analysis | |
  35. FIGURE 3 Porter's Five Forces Analysis | |
  36. FIGURE 4 Global Market Size Trend, 2021–2035 (USD Billion) | |
  37. FIGURE 5 Market Share, by Component, 2025 | |
  38. FIGURE 6 Market Share, by Communication Technology, 2025 | |
  39. FIGURE 7 Market Share, by Application, 2025 | |
  40. FIGURE 8 Market Share, by End-User, 2025 | |
  41. FIGURE 9 Regional Market Share, 2025 | |
  42. FIGURE 10 Regional Growth Comparison, 2026–2035 | |
  43. FIGURE 11 Competitive Landscape Positioning Matrix | |
  44. FIGURE 12 Estimated Revenue Share Ranges of Key Players

Segmentation Quick Reference

DimensionSub-SegmentsDominant SegmentFastest Growing Segment
By ComponentHardware, Software, ServicesHardware (49.0% share)Services (18.4% CAGR)
By Communication TechnologyAcoustic, Optical, Radio Frequency, Hybrid Acoustic-OpticalAcoustic (57.5% share)Hybrid Acoustic-Optical (18.9% CAGR)
By ApplicationEnvironmental Monitoring, Oil and Gas Operations, Defense and Security, Aquaculture and Fisheries, OthersEnvironmental Monitoring (27.5% share)Aquaculture and Fisheries (17.5% CAGR)
By End-UserGovernment and Research Agencies, Offshore Energy Companies, Aquaculture Producers, OthersGovernment and Research Agencies (36.0% share)Aquaculture Producers (17.7% CAGR)
By RegionNorth America, Europe, Asia-Pacific, South America, Middle East & AfricaNorth America (36.0% share)Asia-Pacific (19.6% CAGR)

Market Segmentation Overview

By Component

Sub-SegmentKey Trend
HardwareDeeper-rated sensors and modems with smart power modes
SoftwareCloud dashboards and edge analytics replacing raw data delivery
ServicesMulti-year managed monitoring contracts

Hardware leads because every subsea node depends on pressure-rated sensors, modems and power systems that buyers amortize as long-life assets. Services grow fastest as operators without subsea teams hand installation, recovery and calibration to specialists under five-to-seven-year agreements. Software benefits from both, since managed contracts increasingly bundle analytics dashboards.

By Communication Technology

Sub-SegmentKey Trend
AcousticSpread-spectrum coding and JANUS interoperability
OpticalMegabit-class links for short-range video transfer
Radio FrequencyBuoy and surface gateway connectivity
Hybrid Acoustic-OpticalAutomatic mode-switching for vehicle docking

Acoustic remains dominant because it is the only reliable option over kilometre distances, and standardization through JANUS is easing multi-vendor networks. Hybrid Acoustic-Optical grows fastest as resident vehicles and docking stations need high-speed optical offload at close range with acoustic fallback. Optical and Radio Frequency increasingly ship as components within hybrid designs rather than standalone links.

By Application

Sub-SegmentKey Trend
Environmental Monitoring30x30 and BBNJ compliance monitoring
Oil and Gas OperationsWireless integrity retrofits on ageing assets
Defense and SecuritySeabed surveillance of cables and pipelines
Aquaculture and FisheriesCamera-guided feeding and water-quality automation
OthersOffshore wind, port and research deployments

Environmental Monitoring leads because treaty-driven protected area targets guarantee multi-year public budgets for chemical, acoustic and eDNA sensing. Aquaculture and Fisheries grows fastest as farms use oxygen probes and machine vision to cut feed waste and meet lice and sanitary rules. Defense and Security and Oil and Gas Operations remain large, tied to infrastructure protection and integrity regulations.

By End-User

Sub-SegmentKey Trend
Government and Research AgenciesNational observatories and defense sensor grids
Offshore Energy CompaniesLifetime monitoring of wind and hydrocarbon assets
Aquaculture ProducersFarm-wide digitalization for yield and compliance
OthersPort authorities, terminals and insurers adopting risk monitoring

Government and Research Agencies hold the largest share because defense and observatory programs buy high-specification, long-endurance nodes with recurring calibration. Aquaculture Producers expand fastest as digital farm management becomes a licence and export requirement in Norway, Chile and Asia-Pacific. Offshore Energy Companies provide the main commercial counterweight, diversifying demand away from public budgets.


Download PDF ×

We do not share your information with anyone. However, we may send you emails based on your report interest from time to time. You may contact us at any time to opt-out.