Request Free Sample ×

Kindly complete the form below to receive a free sample of this Report

* Please use a valid business email

Leading companies partner with us for data-driven Insights

clients tt-cursor
Hero Background

UK Electric Vehicles Battery Market

ID: MRFR/AT/52423-HCR
200 Pages
Triveni Bhoyar
Last Updated: February 09, 2026

UK Electric Vehicle Battery Market Research Report By Battery Type (Lithium-Ion, Solid-State, Nickel-Metal Hydride, Lead-Acid), By Electric Vehicle Type (Battery Electric Vehicle, Plug-In Hybrid Electric Vehicle, Hybrid Electric Vehicle), By Application (Automotive, Public Transport, Two-Wheeler, Energy Storage System) and By Capacity (Below 20 kWh, 20 kWh to 50 kWh, 51 kWh to 100 kWh, Above 100 kWh) - Growth & Industry Forecast 2025 To 2035

Share:
Download PDF ×

We do not share your information with anyone. However, we may send you emails based on your report interest from time to time. You may contact us at any time to opt-out.

UK Electric Vehicles Battery Market Infographic
Purchase Options
  1. 1 SECTION I: EXECUTIVE SUMMARY AND KEY HIGHLIGHTS
  2.   1.1 EXECUTIVE SUMMARY
  3.     1.1.1 Market Overview
  4.     1.1.2 Key Findings
  5.     1.1.3 Market Segmentation
  6.     1.1.4 Competitive Landscape
  7.     1.1.5 Challenges and Opportunities
  8.     1.1.6 Future Outlook
  9. 2 SECTION II: SCOPING, METHODOLOGY AND MARKET STRUCTURE
  10.   2.1 MARKET INTRODUCTION
  11.     2.1.1 Definition
  12.     2.1.2 Scope of the study
  13.       2.1.2.1 Research Objective
  14.       2.1.2.2 Assumption
  15.       2.1.2.3 Limitations
  16.   2.2 RESEARCH METHODOLOGY
  17.     2.2.1 Overview
  18.     2.2.2 Data Mining
  19.     2.2.3 Secondary Research
  20.     2.2.4 Primary Research
  21.       2.2.4.1 Primary Interviews and Information Gathering Process
  22.       2.2.4.2 Breakdown of Primary Respondents
  23.     2.2.5 Forecasting Model
  24.     2.2.6 Market Size Estimation
  25.       2.2.6.1 Bottom-Up Approach
  26.       2.2.6.2 Top-Down Approach
  27.     2.2.7 Data Triangulation
  28.     2.2.8 Validation
  29. 3 SECTION III: QUALITATIVE ANALYSIS
  30.   3.1 MARKET DYNAMICS
  31.     3.1.1 Overview
  32.     3.1.2 Drivers
  33.     3.1.3 Restraints
  34.     3.1.4 Opportunities
  35.   3.2 MARKET FACTOR ANALYSIS
  36.     3.2.1 Value chain Analysis
  37.     3.2.2 Porter's Five Forces Analysis
  38.       3.2.2.1 Bargaining Power of Suppliers
  39.       3.2.2.2 Bargaining Power of Buyers
  40.       3.2.2.3 Threat of New Entrants
  41.       3.2.2.4 Threat of Substitutes
  42.       3.2.2.5 Intensity of Rivalry
  43.     3.2.3 COVID-19 Impact Analysis
  44.       3.2.3.1 Market Impact Analysis
  45.       3.2.3.2 Regional Impact
  46.       3.2.3.3 Opportunity and Threat Analysis
  47. 4 SECTION IV: QUANTITATIVE ANALYSIS
  48.   4.1 Automobile, BY Battery Type (USD Million)
  49.     4.1.1 Lithium-Ion
  50.     4.1.2 Solid-State
  51.     4.1.3 Nickel-Metal Hydride
  52.     4.1.4 Lead-Acid
  53.   4.2 Automobile, BY Electric Vehicle Type (USD Million)
  54.     4.2.1 Battery Electric Vehicle
  55.     4.2.2 Plug-In Hybrid Electric Vehicle
  56.     4.2.3 Hybrid Electric Vehicle
  57.   4.3 Automobile, BY Application (USD Million)
  58.     4.3.1 Automotive
  59.     4.3.2 Public Transport
  60.     4.3.3 Two-Wheeler
  61.     4.3.4 Energy Storage System
  62.   4.4 Automobile, BY Capacity (USD Million)
  63.     4.4.1 Below 20 kWh
  64.     4.4.2 20 kWh to 50 kWh
  65.     4.4.3 51 kWh to 100 kWh
  66.     4.4.4 Above 100 kWh
  67. 5 SECTION V: COMPETITIVE ANALYSIS
  68.   5.1 Competitive Landscape
  69.     5.1.1 Overview
  70.     5.1.2 Competitive Analysis
  71.     5.1.3 Market share Analysis
  72.     5.1.4 Major Growth Strategy in the Automobile
  73.     5.1.5 Competitive Benchmarking
  74.     5.1.6 Leading Players in Terms of Number of Developments in the Automobile
  75.     5.1.7 Key developments and growth strategies
  76.       5.1.7.1 New Product Launch/Service Deployment
  77.       5.1.7.2 Merger & Acquisitions
  78.       5.1.7.3 Joint Ventures
  79.     5.1.8 Major Players Financial Matrix
  80.       5.1.8.1 Sales and Operating Income
  81.       5.1.8.2 Major Players R&D Expenditure. 2023
  82.   5.2 Company Profiles
  83.     5.2.1 Tesla (US)
  84.       5.2.1.1 Financial Overview
  85.       5.2.1.2 Products Offered
  86.       5.2.1.3 Key Developments
  87.       5.2.1.4 SWOT Analysis
  88.       5.2.1.5 Key Strategies
  89.     5.2.2 LG Energy Solution (KR)
  90.       5.2.2.1 Financial Overview
  91.       5.2.2.2 Products Offered
  92.       5.2.2.3 Key Developments
  93.       5.2.2.4 SWOT Analysis
  94.       5.2.2.5 Key Strategies
  95.     5.2.3 CATL (CN)
  96.       5.2.3.1 Financial Overview
  97.       5.2.3.2 Products Offered
  98.       5.2.3.3 Key Developments
  99.       5.2.3.4 SWOT Analysis
  100.       5.2.3.5 Key Strategies
  101.     5.2.4 Panasonic (JP)
  102.       5.2.4.1 Financial Overview
  103.       5.2.4.2 Products Offered
  104.       5.2.4.3 Key Developments
  105.       5.2.4.4 SWOT Analysis
  106.       5.2.4.5 Key Strategies
  107.     5.2.5 Samsung SDI (KR)
  108.       5.2.5.1 Financial Overview
  109.       5.2.5.2 Products Offered
  110.       5.2.5.3 Key Developments
  111.       5.2.5.4 SWOT Analysis
  112.       5.2.5.5 Key Strategies
  113.     5.2.6 BYD (CN)
  114.       5.2.6.1 Financial Overview
  115.       5.2.6.2 Products Offered
  116.       5.2.6.3 Key Developments
  117.       5.2.6.4 SWOT Analysis
  118.       5.2.6.5 Key Strategies
  119.     5.2.7 A123 Systems (US)
  120.       5.2.7.1 Financial Overview
  121.       5.2.7.2 Products Offered
  122.       5.2.7.3 Key Developments
  123.       5.2.7.4 SWOT Analysis
  124.       5.2.7.5 Key Strategies
  125.     5.2.8 SK Innovation (KR)
  126.       5.2.8.1 Financial Overview
  127.       5.2.8.2 Products Offered
  128.       5.2.8.3 Key Developments
  129.       5.2.8.4 SWOT Analysis
  130.       5.2.8.5 Key Strategies
  131.     5.2.9 Northvolt (SE)
  132.       5.2.9.1 Financial Overview
  133.       5.2.9.2 Products Offered
  134.       5.2.9.3 Key Developments
  135.       5.2.9.4 SWOT Analysis
  136.       5.2.9.5 Key Strategies
  137.   5.3 Appendix
  138.     5.3.1 References
  139.     5.3.2 Related Reports
  140. 6 LIST OF FIGURES
  141.   6.1 MARKET SYNOPSIS
  142.   6.2 UK MARKET ANALYSIS BY BATTERY TYPE
  143.   6.3 UK MARKET ANALYSIS BY ELECTRIC VEHICLE TYPE
  144.   6.4 UK MARKET ANALYSIS BY APPLICATION
  145.   6.5 UK MARKET ANALYSIS BY CAPACITY
  146.   6.6 KEY BUYING CRITERIA OF AUTOMOBILE
  147.   6.7 RESEARCH PROCESS OF MRFR
  148.   6.8 DRO ANALYSIS OF AUTOMOBILE
  149.   6.9 DRIVERS IMPACT ANALYSIS: AUTOMOBILE
  150.   6.10 RESTRAINTS IMPACT ANALYSIS: AUTOMOBILE
  151.   6.11 SUPPLY / VALUE CHAIN: AUTOMOBILE
  152.   6.12 AUTOMOBILE, BY BATTERY TYPE, 2024 (% SHARE)
  153.   6.13 AUTOMOBILE, BY BATTERY TYPE, 2024 TO 2035 (USD Million)
  154.   6.14 AUTOMOBILE, BY ELECTRIC VEHICLE TYPE, 2024 (% SHARE)
  155.   6.15 AUTOMOBILE, BY ELECTRIC VEHICLE TYPE, 2024 TO 2035 (USD Million)
  156.   6.16 AUTOMOBILE, BY APPLICATION, 2024 (% SHARE)
  157.   6.17 AUTOMOBILE, BY APPLICATION, 2024 TO 2035 (USD Million)
  158.   6.18 AUTOMOBILE, BY CAPACITY, 2024 (% SHARE)
  159.   6.19 AUTOMOBILE, BY CAPACITY, 2024 TO 2035 (USD Million)
  160.   6.20 BENCHMARKING OF MAJOR COMPETITORS
  161. 7 LIST OF TABLES
  162.   7.1 LIST OF ASSUMPTIONS
  163.     7.1.1
  164.   7.2 UK MARKET SIZE ESTIMATES; FORECAST
  165.     7.2.1 BY BATTERY TYPE, 2025-2035 (USD Million)
  166.     7.2.2 BY ELECTRIC VEHICLE TYPE, 2025-2035 (USD Million)
  167.     7.2.3 BY APPLICATION, 2025-2035 (USD Million)
  168.     7.2.4 BY CAPACITY, 2025-2035 (USD Million)
  169.   7.3 PRODUCT LAUNCH/PRODUCT DEVELOPMENT/APPROVAL
  170.     7.3.1
  171.   7.4 ACQUISITION/PARTNERSHIP
  172.     7.4.1

UK Automobile Market Segmentation

Automobile By Battery Type (USD Million, 2025-2035)
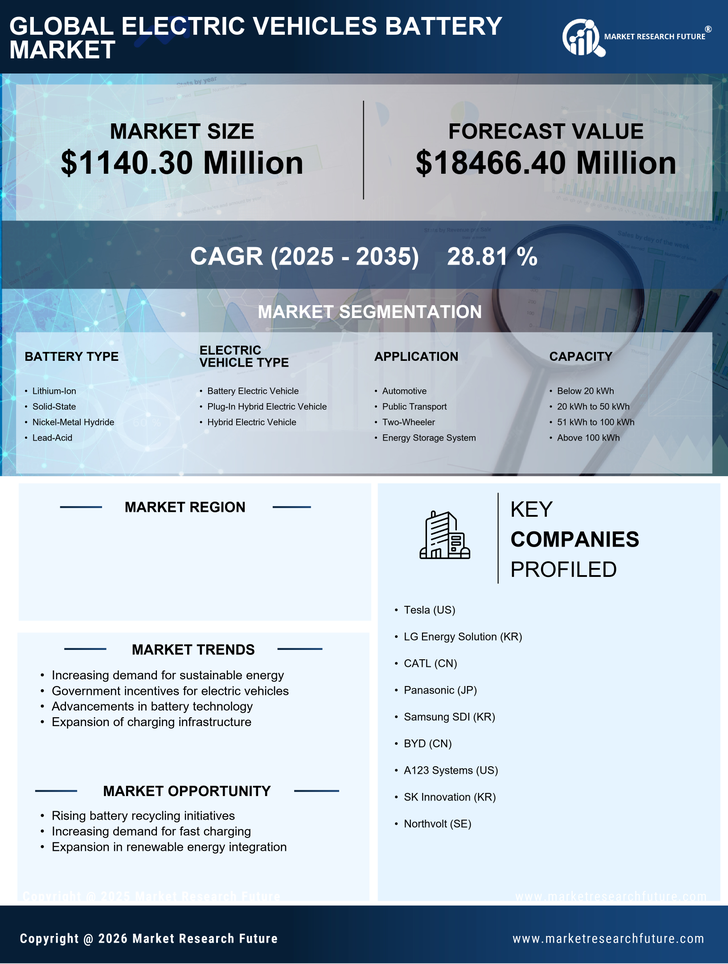
  • Lithium-Ion
  • Solid-State
  • Nickel-Metal Hydride
  • Lead-Acid

Automobile By Electric Vehicle Type (USD Million, 2025-2035)

  • Battery Electric Vehicle
  • Plug-In Hybrid Electric Vehicle
  • Hybrid Electric Vehicle

Automobile By Application (USD Million, 2025-2035)

  • Automotive
  • Public Transport
  • Two-Wheeler
  • Energy Storage System

Automobile By Capacity (USD Million, 2025-2035)

  • Below 20 kWh
  • 20 kWh to 50 kWh
  • 51 kWh to 100 kWh
  • Above 100 kWh

Compare Licence

×
Features License Type
Single User Multiuser License Enterprise User
Price $4,950 $5,950 $7,250
Maximum User Access Limit 1 User Upto 10 Users Unrestricted Access Throughout the Organization
Free Customization
Direct Access to Analyst
Deliverable Format
Platform Access
Discount on Next Purchase 10% 15% 15%
Printable Versions