Transparent Display Market (2025 - 2035)

ID: MRFR/SEM/6508-HCR
200 Pages
Ankit Gupta
Last Updated: July 02, 2026
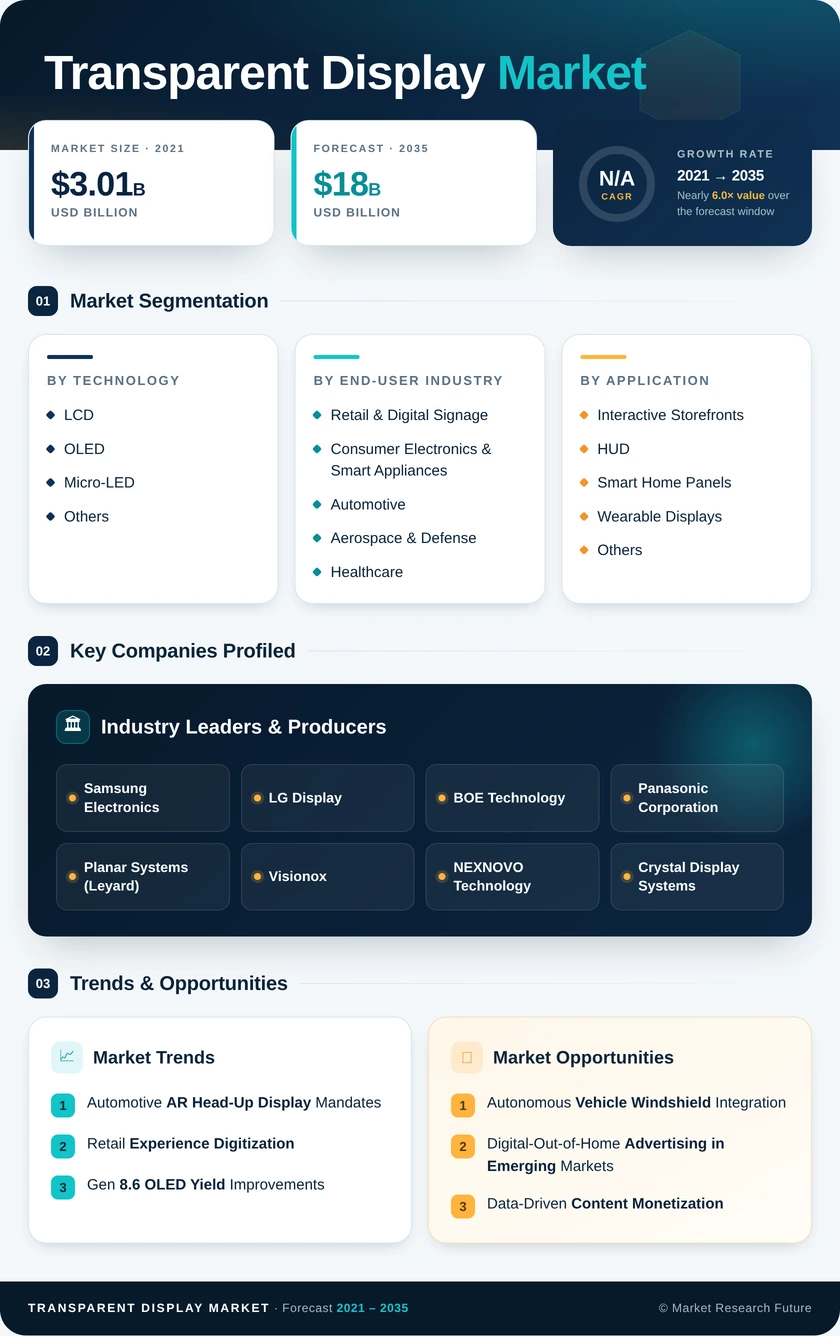
Transparent Display Market Size, Share and Research Report By Technology (LCD, OLED, Micro-LED, Others (E-Paper, Electroluminescent)), By End-User Industry (Retail & Digital Signage, Consumer Electronics & Smart Appliances, Automotive, Aerospace & Defense, Healthcare), By Application (Interactive Storefronts, Head-Up Displays (HUD), Smart Home Panels, Wearable Displays, Others), By Display Size (Less Than 10 Inches, 10–39 Inches, 40 Inches and Above) and By Regional (North America, Europe, South America, Asia Pacific, Middle East and Africa) - Industry Forecast to 2035.
Transparent Display Market
Market Size
Forecast Period2025-2035
CAGR (2025-2035)38.0%
2024 Market Size1.044(USD Billion)
2025 Market Size1.441(USD Billion)
2035 Market Size36.09(USD Billion)
Key Players
Samsung Electronics
LG Display
BOE Technology
Panasonic Corporation
Planar Systems
Visionox
Opportunities
  • Autonomous Vehicle Windshield Integration
  • Digital-Out-of-Home Advertising in Emerging Markets
  • Data-Driven Content Monetization
  1. 1 Market Overview |
    1. 1.1 Study Assumptions & Market Definition |
    2. 1.2 Scope of the Study |
    3. 1.3 Research Methodology
  2. 2 Market Summary & Key Takeaways
  3. 3 Market Dynamics |
    1. 3.1 Market Drivers Analysis | |
      1. 3.1.1 Automotive AR Head-Up Display Mandates | |
      2. 3.1.2 Retail Experience Digitization | |
      3. 3.1.3 Gen
    2. 8.6 OLED Yield Improvements | |
      1. 3.1.4 Smart-City Infrastructure Spending | |
      2. 3.1.5 Defense Transparent-Armor Cockpit R&D | |
      3. 3.1.6 Consumer Electronics Miniaturization | |
      4. 3.1.7 Digital-Out-of-Home Advertising Growth |
    3. 3.2 Market Restraints Analysis | |
      1. 3.2.1 High Capital Cost of Emissive Panel Fabrication | |
      2. 3.2.2 Indium-Tin-Oxide Supply Concentration | |
      3. 3.2.3 Limited Outdoor Luminance Performance | |
      4. 3.2.4 Fragmented Interoperability Standards | |
      5. 3.2.5 End-User ROI Uncertainty |
    4. 3.3 Market Opportunity Analysis | |
      1. 3.3.1 Autonomous Vehicle Windshield Integration | |
      2. 3.3.2 Digital-Out-of-Home Advertising in Emerging Markets | |
      3. 3.3.3 Data-Driven Content Monetization | |
      4. 3.3.4 Healthcare and Laboratory Visualization | |
      5. 3.3.5 Defense and Aerospace Cockpit Modernization |
    5. 3.4 Industry Value Chain Analysis |
    6. 3.5 Porter's Five Forces Analysis
  4. 4 Global Transparent Display Market Size & Forecast (2021–2035) |
    1. 4.1 Historical Market Size (2021–2025) |
    2. 4.2 Current & Forecast Market Size (2026–2035) |
    3. 4.3 Market Size by Revenue (USD Billion) |
    4. 4.4 Year-over-Year Growth Analysis
  5. 5 Segmentation Analysis |
    1. 5.1 By Technology | |
      1. 5.1.1 LCD | |
      2. 5.1.2 OLED | |
      3. 5.1.3 Micro-LED | |
      4. 5.1.4 Others (E-Paper, Electroluminescent) |
    2. 5.2 By End-User Industry | |
      1. 5.2.1 Retail & Digital Signage | |
      2. 5.2.2 Consumer Electronics & Smart Appliances | |
      3. 5.2.3 Automotive | |
      4. 5.2.4 Aerospace & Defense | |
      5. 5.2.5 Healthcare |
    3. 5.3 By Application | |
      1. 5.3.1 Interactive Storefronts | |
      2. 5.3.2 Head-Up Displays (HUD) | |
      3. 5.3.3 Smart Home Panels | |
      4. 5.3.4 Wearable Displays | |
      5. 5.3.5 Others |
    4. 5.4 By Display Size | |
      1. 5.4.1 Less Than 10 Inches | |
      2. 5.4.2 10–39 Inches | |
      3. 5.4.3 40 Inches and Above
  6. 6 Regional Analysis |
    1. 6.1 North America | |
      1. 6.1.1 United States | |
      2. 6.1.2 Canada | |
      3. 6.1.3 Mexico |
    2. 6.2 Europe | |
      1. 6.2.1 Germany | |
      2. 6.2.2 United Kingdom | |
      3. 6.2.3 France | |
      4. 6.2.4 Italy | |
      5. 6.2.5 Spain | |
      6. 6.2.6 Nordic Countries | |
      7. 6.2.7 Russia | |
      8. 6.2.8 Rest of Europe |
    3. 6.3 Asia-Pacific | |
      1. 6.3.1 China | |
      2. 6.3.2 Japan | |
      3. 6.3.3 South Korea | |
      4. 6.3.4 India | |
      5. 6.3.5 ASEAN | |
      6. 6.3.6 Rest of Asia-Pacific |
    4. 6.4 South America | |
      1. 6.4.1 Brazil | |
      2. 6.4.2 Argentina | |
      3. 6.4.3 Rest of South America |
    5. 6.5 Middle East & Africa | |
      1. 6.5.1 Saudi Arabia | |
      2. 6.5.2 UAE | |
      3. 6.5.3 South Africa | |
      4. 6.5.4 Egypt | |
      5. 6.5.5 Rest of MEA
  7. 7 Competitive Landscape |
    1. 7.1 Market Share Analysis (2025) |
    2. 7.2 Competitive Benchmarking Matrix |
    3. 7.3 Company Profiles | |
      1. 7.3.1 Samsung Electronics | |
      2. 7.3.2 LG Display | |
      3. 7.3.3 BOE Technology | |
      4. 7.3.4 Panasonic Corporation | |
      5. 7.3.5 Planar Systems (Leyard) | |
      6. 7.3.6 Visionox | |
      7. 7.3.7 NEXNOVO Technology | |
      8. 7.3.8 Crystal Display Systems | |
      9. 7.3.9 Lumineq (Beneq) | |
      10. 7.3.10 Pro Display
  8. 8 Future Outlook & Strategic Recommendations (2026–2035) |
    1. 8.1 AI-Driven Content Personalization |
    2. 8.2 Platform Economics and Display-as-a-Service |
    3. 8.3 Sustainability and Circular-Economy Manufacturing |
    4. 8.4 Convergence with Mixed-Reality Ecosystems
  9. 9 Recent Developments & News
  10. 10 Frequently Asked Questions (FAQs)
  11. 11 Report Scope & Methodology |
    1. 11.1 Study Period & Base Year |
    2. 11.2 Data Sources & Citations |
    3. 11.3 Abbreviations
  12. 12 LIST OF TABLES |
  13. TABLE 1 Global Transparent Display Market Size & Forecast, by Revenue (USD Billion), 2021–2035 |
  14. TABLE 2 Global Transparent Display Market — Year-over-Year Growth Analysis, 2021–2035 |
  15. TABLE 3 Global Transparent Display Market — Driver Impact Analysis, 2026–2035 |
  16. TABLE 4 Global Transparent Display Market — Restraint Impact Analysis, 2026–2035 |
  17. TABLE 5 Global Transparent Display Market Size, by Technology, 2021–2035 (USD Billion) |
  18. TABLE 6 Global Transparent Display Market Size, by End-User Industry, 2021–2035 (USD Billion) |
  19. TABLE 7 Global Transparent Display Market Size, by Application, 2021–2035 (USD Billion) |
  20. TABLE 8 Global Transparent Display Market Size, by Display Size, 2021–2035 (USD Billion) |
  21. TABLE 9 Global Transparent Display Market Size, by Region, 2021–2035 (USD Billion) |
  22. TABLE 10 North America Transparent Display Market Size, by Country, 2021–2035 (USD Billion) |
  23. TABLE 11 Europe Transparent Display Market Size, by Country, 2021–2035 (USD Billion) |
  24. TABLE 12 Asia-Pacific Transparent Display Market Size, by Country, 2021–2035 (USD Billion) |
  25. TABLE 13 South America Transparent Display Market Size, by Country, 2021–2035 (USD Billion) |
  26. TABLE 14 Middle East & Africa Transparent Display Market Size, by Country, 2021–2035 (USD Billion) |
  27. TABLE 15 Competitive Benchmarking Matrix — Global Transparent Display Market, 2025 |
  28. TABLE 16 Company Profiles — Key Players, Global Transparent Display Market |
  29. TABLE 17 Recent Developments & Strategic Announcements, 2023–2025 |
  30. TABLE 18 North America Transparent Display Market Size, by Technology, 2021–2035 (USD Billion) |
  31. TABLE 19 North America Transparent Display Market Size, by End-User Industry, 2021–2035 (USD Billion) |
  32. TABLE 20 North America Transparent Display Market Size, by Application, 2021–2035 (USD Billion) |
  33. TABLE 21 North America Transparent Display Market Size, by Display Size, 2021–2035 (USD Billion) |
  34. TABLE 22 Europe Transparent Display Market Size, by Technology, 2021–2035 (USD Billion) |
  35. TABLE 23 Europe Transparent Display Market Size, by End-User Industry, 2021–2035 (USD Billion) |
  36. TABLE 24 Europe Transparent Display Market Size, by Application, 2021–2035 (USD Billion) |
  37. TABLE 25 Europe Transparent Display Market Size, by Display Size, 2021–2035 (USD Billion) |
  38. TABLE 26 Asia-Pacific Transparent Display Market Size, by Technology, 2021–2035 (USD Billion) |
  39. TABLE 27 Asia-Pacific Transparent Display Market Size, by End-User Industry, 2021–2035 (USD Billion) |
  40. TABLE 28 Asia-Pacific Transparent Display Market Size, by Application, 2021–2035 (USD Billion) |
  41. TABLE 29 Asia-Pacific Transparent Display Market Size, by Display Size, 2021–2035 (USD Billion) |
  42. TABLE 30 South America Transparent Display Market Size, by Technology, 2021–2035 (USD Billion) |
  43. TABLE 31 South America Transparent Display Market Size, by End-User Industry, 2021–2035 (USD Billion) |
  44. TABLE 32 South America Transparent Display Market Size, by Application, 2021–2035 (USD Billion) |
  45. TABLE 33 South America Transparent Display Market Size, by Display Size, 2021–2035 (USD Billion) |
  46. TABLE 34 Middle East & Africa Transparent Display Market Size, by Technology, 2021–2035 (USD Billion) |
  47. TABLE 35 Middle East & Africa Transparent Display Market Size, by End-User Industry, 2021–2035 (USD Billion) |
  48. TABLE 36 Middle East & Africa Transparent Display Market Size, by Application, 2021–2035 (USD Billion) |
  49. TABLE 37 Middle East & Africa Transparent Display Market Size, by Display Size, 2021–2035 (USD Billion) |
  50. TABLE 38 United States Transparent Display Market Size, by Technology, 2021–2035 (USD Billion) |
  51. TABLE 39 United States Transparent Display Market Size, by End-User Industry, 2021–2035 (USD Billion) |
  52. TABLE 40 United States Transparent Display Market Size, by Application, 2021–2035 (USD Billion) |
  53. TABLE 41 United States Transparent Display Market Size, by Display Size, 2021–2035 (USD Billion) |
  54. TABLE 42 Canada Transparent Display Market Size, by Technology, 2021–2035 (USD Billion) |
  55. TABLE 43 Canada Transparent Display Market Size, by End-User Industry, 2021–2035 (USD Billion) |
  56. TABLE 44 Canada Transparent Display Market Size, by Application, 2021–2035 (USD Billion) |
  57. TABLE 45 Canada Transparent Display Market Size, by Display Size, 2021–2035 (USD Billion) |
  58. TABLE 46 Mexico Transparent Display Market Size, by Technology, 2021–2035 (USD Billion) |
  59. TABLE 47 Mexico Transparent Display Market Size, by End-User Industry, 2021–2035 (USD Billion) |
  60. TABLE 48 Mexico Transparent Display Market Size, by Application, 2021–2035 (USD Billion) |
  61. TABLE 49 Mexico Transparent Display Market Size, by Display Size, 2021–2035 (USD Billion) |
  62. TABLE 50 Germany Transparent Display Market Size, by Technology, 2021–2035 (USD Billion) |
  63. TABLE 51 Germany Transparent Display Market Size, by End-User Industry, 2021–2035 (USD Billion) |
  64. TABLE 52 Germany Transparent Display Market Size, by Application, 2021–2035 (USD Billion) |
  65. TABLE 53 Germany Transparent Display Market Size, by Display Size, 2021–2035 (USD Billion) |
  66. TABLE 54 United Kingdom Transparent Display Market Size, by Technology, 2021–2035 (USD Billion) |
  67. TABLE 55 United Kingdom Transparent Display Market Size, by End-User Industry, 2021–2035 (USD Billion) |
  68. TABLE 56 United Kingdom Transparent Display Market Size, by Application, 2021–2035 (USD Billion) |
  69. TABLE 57 United Kingdom Transparent Display Market Size, by Display Size, 2021–2035 (USD Billion) |
  70. TABLE 58 France Transparent Display Market Size, by Technology, 2021–2035 (USD Billion) |
  71. TABLE 59 France Transparent Display Market Size, by End-User Industry, 2021–2035 (USD Billion) |
  72. TABLE 60 France Transparent Display Market Size, by Application, 2021–2035 (USD Billion) |
  73. TABLE 61 France Transparent Display Market Size, by Display Size, 2021–2035 (USD Billion) |
  74. TABLE 62 Italy Transparent Display Market Size, by Technology, 2021–2035 (USD Billion) |
  75. TABLE 63 Italy Transparent Display Market Size, by End-User Industry, 2021–2035 (USD Billion) |
  76. TABLE 64 Italy Transparent Display Market Size, by Application, 2021–2035 (USD Billion) |
  77. TABLE 65 Italy Transparent Display Market Size, by Display Size, 2021–2035 (USD Billion) |
  78. TABLE 66 Spain Transparent Display Market Size, by Technology, 2021–2035 (USD Billion) |
  79. TABLE 67 Spain Transparent Display Market Size, by End-User Industry, 2021–2035 (USD Billion) |
  80. TABLE 68 Spain Transparent Display Market Size, by Application, 2021–2035 (USD Billion) |
  81. TABLE 69 Spain Transparent Display Market Size, by Display Size, 2021–2035 (USD Billion) |
  82. TABLE 70 China Transparent Display Market Size, by Technology, 2021–2035 (USD Billion) |
  83. TABLE 71 China Transparent Display Market Size, by End-User Industry, 2021–2035 (USD Billion) |
  84. TABLE 72 China Transparent Display Market Size, by Application, 2021–2035 (USD Billion) |
  85. TABLE 73 China Transparent Display Market Size, by Display Size, 2021–2035 (USD Billion) |
  86. TABLE 74 Japan Transparent Display Market Size, by Technology, 2021–2035 (USD Billion) |
  87. TABLE 75 Japan Transparent Display Market Size, by End-User Industry, 2021–2035 (USD Billion) |
  88. TABLE 76 Japan Transparent Display Market Size, by Application, 2021–2035 (USD Billion) |
  89. TABLE 77 Japan Transparent Display Market Size, by Display Size, 2021–2035 (USD Billion) |
  90. TABLE 78 South Korea Transparent Display Market Size, by Technology, 2021–2035 (USD Billion) |
  91. TABLE 79 South Korea Transparent Display Market Size, by End-User Industry, 2021–2035 (USD Billion) |
  92. TABLE 80 South Korea Transparent Display Market Size, by Application, 2021–2035 (USD Billion) |
  93. TABLE 81 South Korea Transparent Display Market Size, by Display Size, 2021–2035 (USD Billion) |
  94. TABLE 82 India Transparent Display Market Size, by Technology, 2021–2035 (USD Billion) |
  95. TABLE 83 India Transparent Display Market Size, by End-User Industry, 2021–2035 (USD Billion) |
  96. TABLE 84 India Transparent Display Market Size, by Application, 2021–2035 (USD Billion) |
  97. TABLE 85 India Transparent Display Market Size, by Display Size, 2021–2035 (USD Billion) |
  98. TABLE 86 Brazil Transparent Display Market Size, by Technology, 2021–2035 (USD Billion) |
  99. TABLE 87 Brazil Transparent Display Market Size, by End-User Industry, 2021–2035 (USD Billion) |
  100. TABLE 88 Brazil Transparent Display Market Size, by Application, 2021–2035 (USD Billion) |
  101. TABLE 89 Brazil Transparent Display Market Size, by Display Size, 2021–2035 (USD Billion) |
  102. TABLE 90 Saudi Arabia Transparent Display Market Size, by Technology, 2021–2035 (USD Billion) |
  103. TABLE 91 Saudi Arabia Transparent Display Market Size, by End-User Industry, 2021–2035 (USD Billion) |
  104. TABLE 92 Saudi Arabia Transparent Display Market Size, by Application, 2021–2035 (USD Billion) |
  105. TABLE 93 Saudi Arabia Transparent Display Market Size, by Display Size, 2021–2035 (USD Billion) |
  106. TABLE 94 UAE Transparent Display Market Size, by Technology, 2021–2035 (USD Billion) |
  107. TABLE 95 UAE Transparent Display Market Size, by End-User Industry, 2021–2035 (USD Billion) |
  108. TABLE 96 UAE Transparent Display Market Size, by Application, 2021–2035 (USD Billion) |
  109. TABLE 97 UAE Transparent Display Market Size, by Display Size, 2021–2035 (USD Billion) |
  110. TABLE 98 South Africa Transparent Display Market Size, by Technology, 2021–2035 (USD Billion) |
  111. TABLE 99 South Africa Transparent Display Market Size, by End-User Industry, 2021–2035 (USD Billion) |
  112. TABLE 100 South Africa Transparent Display Market Size, by Application, 2021–2035 (USD Billion) |
  113. TABLE 101 South Africa Transparent Display Market Size, by Display Size, 2021–2035 (USD Billion) |
  114. TABLE 102 Report Scope & Methodology — Global Transparent Display Market |
  115. TABLE 103 Detailed Sources and Citations
  116. 13 LIST OF FIGURES |
  117. FIGURE 1 Global Transparent Display Market Dynamics — Drivers, Restraints, and Opportunities |
  118. FIGURE 2 Industry Value Chain Analysis — Transparent Display Market |
  119. FIGURE 3 Porter's Five Forces Analysis — Transparent Display Market |
  120. FIGURE 4 Global Transparent Display Market Size Trend (USD Billion), 2021–2035 |
  121. FIGURE 5 Global Transparent Display Market Share, by Technology, 2025 (%) |
  122. FIGURE 6 Global Transparent Display Market Share, by End-User Industry, 2025 (%) |
  123. FIGURE 7 Global Transparent Display Market Share, by Application, 2025 (%) |
  124. FIGURE 8 Global Transparent Display Market Share, by Display Size, 2025 (%) |
  125. FIGURE 9 Global Transparent Display Market Share, by Region, 2025 (%) |
  126. FIGURE 10 North America Transparent Display Market Size Trend, 2021–2035 |
  127. FIGURE 11 Europe Transparent Display Market Size Trend, 2021–2035 |
  128. FIGURE 12 Asia-Pacific Transparent Display Market Size Trend, 2021–2035 |
  129. FIGURE 13 South America Transparent Display Market Size Trend, 2021–2035 |
  130. FIGURE 14 Middle East & Africa Transparent Display Market Size Trend, 2021–2035 |
  131. FIGURE 15 Competitive Landscape — Market Share Analysis, 2025 |
  132. FIGURE 16 Competitive Benchmarking Radar — Top 10 Players

Segmentation Quick Reference

DimensionSub-SegmentsDominant Segment (2025)Fastest Growing Segment (2026–2035)
TechnologyLCD, OLED, Micro-LED, OthersLCDMicro-LED
End-User IndustryRetail & Digital Signage, Consumer Electronics & Smart Appliances, Automotive, Transparent Display Market, HealthcareRetail & Digital SignageAutomotive
ApplicationInteractive Storefronts, HUD, Smart Home Panels, Wearable Displays, OthersInteractive StorefrontsHead-Up Displays (HUD)
Display SizeLess Than 10 Inches, 10–39 Inches, 40 Inches and Above40 Inches and Above40 Inches and Above
GeographyNorth America, Europe, Asia-Pacific, South America, Middle East & AfricaAsia-PacificAsia-Pacific


Market Segmentation Overview

By Technology

Sub-SegmentKey Trend
LCDCost-driven adoption in high-volume retail signage
OLEDPremium positioning in automotive and luxury retail
Micro-LEDRapid brightness and lifespan gains driving commercial interest
Others (E-Paper, Electroluminescent)Low-power niche applications in harsh environments


LCD remains the workhorse technology for large-scale transparent signage deployments, while OLED serves premium verticals demanding superior contrast and flexibility. Micro-LED is rapidly closing the cost gap and is expected to surpass OLED in revenue share by the early 2030s as die-transfer yields improve.

By End-User Industry

Sub-SegmentKey Trend
Retail & Digital SignageOmnichannel strategies driving interactive storefront investment
Consumer Electronics & Smart AppliancesSmart-home hubs and transparent refrigerator panels
AutomotiveAR head-up display integration across luxury and mid-tier vehicles
Transparent Display MarketTransparent cockpit canopy modernization programs
HealthcareOperating theater and cleanroom visualization overlays


Retail remains the anchor demand segment, but automotive is closing fast. Defense procurement cycles are longer but contract values per unit are significantly higher, providing stable revenue contributions across the forecast horizon.

By Application

Sub-SegmentKey Trend
Interactive StorefrontsExperiential commerce and pedestrian engagement
Head-Up Displays (HUD)Safety regulation incentives and autonomous driving convergence
Smart Home PanelsIoT integration and ambient computing
Wearable DisplaysAR glasses miniaturization
OthersIndustrial process monitoring, museum installations


Interactive storefronts command the largest share today due to rapid deployment timelines and high advertiser ROI. Head-up displays represent the fastest growth path as automotive OEMs move from concept to series production.

By Display Size

Sub-SegmentKey Trend
Less Than 10 InchesWearable devices and compact instrument clusters
10–39 InchesAppliance panels, automotive HUD, point-of-sale
40 Inches and AboveLarge-format retail, transit, and architectural installations


Large-format panels above 40 inches dominate revenue because per-unit prices are substantially higher and replacement cycles extend to 7–10 years. Sub-10-inch panels are growing in unit volume as AR eyewear and smartwatch categories expand, though revenue contribution remains modest relative to large-format installations.

By Geography

Sub-SegmentKey Trend
North AmericaDefense and luxury retail driving premium demand
EuropeAutomotive OEM integration and smart-city programs
Asia-PacificPanel manufacturing dominance and smart-city rollouts
South AmericaTransit advertising and organized retail expansion
Middle East & AfricaMega-project construction and tourism infrastructure


Asia-Pacific leads both in production capacity and consumption, supported by government digitization initiatives and the world's largest OLED and Micro-LED fabrication base. North America and Europe follow as mature demand markets with strong verticals in defense, automotive, and premium retail.


Download PDF ×

We do not share your information with anyone. However, we may send you emails based on your report interest from time to time. You may contact us at any time to opt-out.