Healthcare Market Segmentation
Healthcare By Type (USD Billion, 2025-2035)
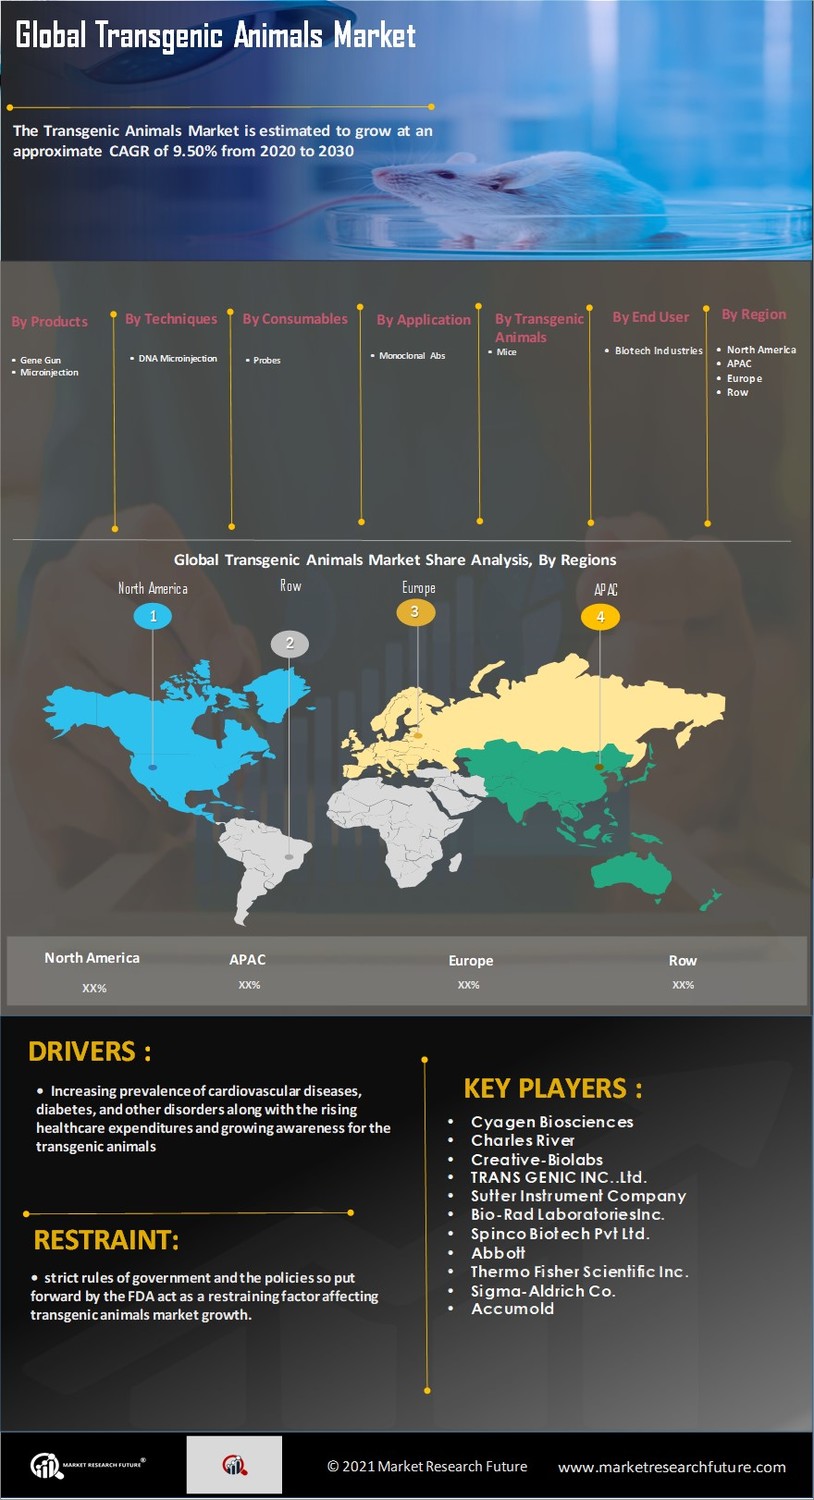
- OCR gene gun
- microinjections
- electroporator
Healthcare By Techniques (USD Billion, 2025-2035)
- retro-virus-mediated transfer of gene
- embryonic stem cell-mediated transfer of gene
- microinjection of DNA
Healthcare By Applications (USD Billion, 2025-2035)
- recombinant human proteins
- monoclonal antibodies
- xenotransplantation
Healthcare By Model Organisms (USD Billion, 2025-2035)
Healthcare By End-Users (USD Billion, 2025-2035)
- biotechnological industry
- research organizations
- academic institutes