ID: MRFR/SEM/0605-HCR | February 2021 | Region: Global | 110 pages
Market Synopsis of Global Touchless Sensing Market
Market Scenario
Touchless sensing is a software-dependent and advanced form of human-machine interaction, where the user can control and monitor devices through contactless modes. This technology is incorporated into mobile phones, tablets, PDAs and other computer-enabled devices. Touchless sensing technology has its application in various industries like healthcare, food and agribusiness, IT and others due to the benefits it offers such as low cost and zero maintenance, reliability, ease of development and integration. In food and agribusiness industry, touchless sensing helps in reducing cross-contamination in the food processing plant. The product overhead can be reduced by eradicating direct human handling during the packaging process. Additionally, as the name suggests, the implementation of touchless sensing technology remedies the hygiene concerns to a considerable extent.
Most commonly used touchless sensing technologies are gesture recognition and speech/voice recognition. In gesture recognition, finger and hand gesture movements allow user interaction with machines, with no physical contact with digital devices. The market for touchless sensing is expected to grow in order to enhance user experience and ease of use, increasing digitalization across industries. Also, the increasing hygiene concerns are contributing substantially to the growth of touchless sensing market. However, the absence of haptic sensation and high power consumption may hamper the growth of touchless sensing market.
Soli is a new sensing technology by Google that uses miniature radar to detect touchless gesture interactions. It does not use conventional visible or even infra-red 2D images, instead, it uses radar for motion tracking of the human hand. These sensors track sub-millimeter motion at high speeds with high accuracy. This allows people to control devices with a simple, universal set of gestures. This technology can be a new opportunity for touchless sensing market.
The Global Touchless Sensing Market, 2018-2023 (USD Billion)
Source: MRFR Analysis
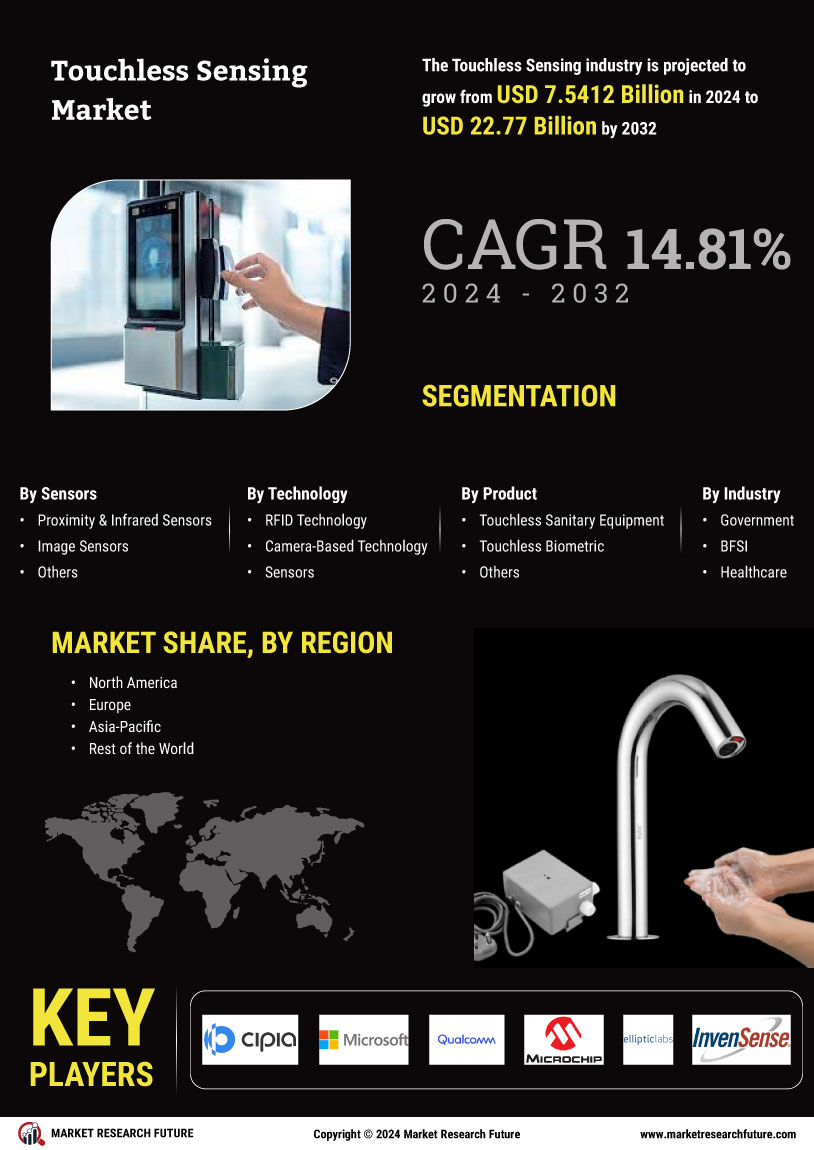
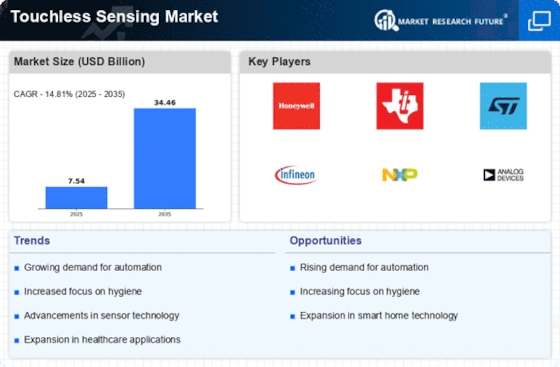
The global touchless sensing market is expected to reach approximately USD 18 Billion by 2023 growing at a ~17.3% CAGR over the forecast period 2018–2023.
Key Players
Some of the key players of Touchless Sensing market include Eyesight Technologies Ltd. (Israel), Microsoft Corporation (U.S.), Qualcomm Inc. (U.S.), Microchip Technology Inc. (U.S.), Intel (U.S.), Elliptic Labs Inc., (Norway), CogniVue Corporation, (Canada), InvenSense (U.S.), Crossmatch (U.S.), NXP Semiconductors (Netherland) among others.
The prominent players keep innovating and investing in research and development to present cost-effective offerings. Merger and Acquisitions among the various players are changing the market structure. For instance, Jabil Inc. and eyeSight Technologies announced a new partnership to develop next-generation in-car sensing technology that delivers the most advanced levels of driver monitoring and gesture control.
Segmentation
By Technology, the market is segmented into RFID Technology, Camera-Based Technology, Sensors, Voice Assistance and Others. Sensors are sub-segmented into Proximity & infrared sensors, image sensors among others.
By Product, the market is segmented into Touchless Sanitary Equipment, Touchless Biometric, and Others. Touchless Sanitary Equipment is sub-segmented into Touchless Faucets, Touchless Soap Dispensers, Touchless Towel Dispensers, Touchless Trashcans, and Hand Dryers.
Touchless Biometric is sub-segmented into Touchless Fingerprint Recognition, Iris Recognition, Face Recognition System, and Voice Recognition.
By Industry, the market is further segmented into Consumer Electronics, Government, BFSI, Healthcare, Automotive, and others.
Regional Analysis
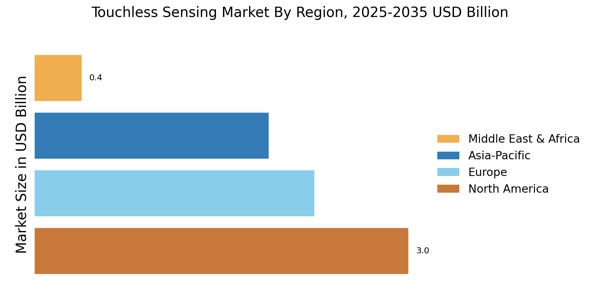
The geographical analysis of Touchless Sensing market is studied for North America, Europe Asia Pacific and the rest of the world. Europe is expected to hold the largest share for touchless sensing market owing to favorable initiatives taken by the government towards hygiene standards. People of countries such as UK, Spain, France believes in higher hygiene standards which is driving the touchless sensing market in Europe. North America is the second largest market. The organizations in North America are shifting towards new and upgraded technologies with the increasing adoption of digital business strategies. The presence of major solution provider of Touchless Sensing in North America is also a driving factor for Touchless Sensing market to grow. Asia Pacific is expected to grow with the highest CAGR during the forecast period. Countries like China, Japan and, India have a huge growth potential and provide a favorable environment for product manufacturers.
Target Audience
Frequently Asked Questions (FAQ) :
Eyesight Technologies Ltd. (Israel), Qualcomm Inc. (U.S.), Microsoft Corporation (U.S.), Microchip Technology Inc. (U.S.), Elliptic Labs Inc., (Norway), and Intel (U.S.) are top-notch players of the touchless sensing market.
The growing demand for enhanced user experience is expected to cause the global touchless sensing market expand at 17.3% CAGR and value at USD 18 billion by 2023.
The increase in adoption of touchless sensing technology across the healthcare and electronics industry are factors that are expected to generate high income for the Europe touchless sensing market.
The consumer electronics is observed as a high end user of touchless sensing technology. Other industries that use the technology are healthcare and automotive.
RFID technology, sensors, camera-based technology, and voice assistance are technologies that are used for touchless sensing. Sensors are heavily deployed in touchless sensing gadgets, thereby can tweak the market growth.
TABLE OF CONTENTS
1 Executive Summary
2 Scope of the Report
2.1 Market Definition
2.2 Scope of the Study
2.2.1 Research Objectives
2.2.2 Assumptions & Limitations
2.3 Markets Structure
3 Market Research Methodology
3.1 Research Process
3.2 Secondary Research
3.3 Primary Research
3.4 Forecast Model
4 Market Landscape
4.1 Porter’s Five Forces Analysis
4.1.1 Threat of New Entrants
4.1.2 Bargaining power of buyers
4.1.3 Threat of substitutes
4.1.4 Segment rivalry
4.1.5 Bargaining power of suppliers
4.2 Value Chain/Supply Chain of Touchless Sensing Market
5 Industry Overview of Touchless Sensing Market
5.1 Introduction
5.2 Growth Drivers
5.3 Impact analysis
5.4 Market Challenges
6. Touchless Sensing Market by Technology
6.1 Introduction
6.2 RFID Technology
6.2.1 Market Estimates & Forecast, 2018-2023
6.2.2 Market Estimates & Forecast by Region, 2018-2023
6.3 Camera-Based Technology
6.3.1 Market Estimates & Forecast, 2018-2023
6.3.2 Market Estimates & Forecast by Region, 2018-2023
6.4 Sensors
6.4.1 Market Estimates & Forecast, 2018-2023
6.4.2 Market Estimates & Forecast by Region, 2018-2023
6.5 Voice Assistance
6.5.1 Market Estimates & Forecast, 2018-2023
6.5.2 Market Estimates & Forecast by Region, 2018-2023
6.6 Others
6.6.1 Market Estimates & Forecast, 2018-2023
6.6.2 Market Estimates & Forecast by Region, 2018-2023
7. Touchless Sensing Market by Sensors
7.1 Introduction
7.2 Proximity & infrared sensors
7.2.1 Market Estimates & Forecast, 2018-2023
7.2.2 Market Estimates & Forecast by Region, 2018-2023
7.3 Image sensors
7.3.1 Market Estimates & Forecast, 2018-2023
7.3.2 Market Estimates & Forecast by Region, 2018-2023
7.4 Others
7.4.1 Market Estimates & Forecast, 2018-2023
7.4.2 Market Estimates & Forecast by Region, 2018-2023
8. Touchless Sensing Market by Product
8.1 Introduction
8.2 Touchless Sanitary Equipment
8.2.1 Market Estimates & Forecast, 2018-2023
8.2.2 Market Estimates & Forecast by Region, 2018-2023
8.3 Touchless Biometric
8.3.1 Market Estimates & Forecast, 2018-2023
8.3.2 Market Estimates & Forecast by Region, 2018-2023
8.4 Others
8.4.1 Market Estimates & Forecast, 2018-2023
8.4.2 Market Estimates & Forecast by Region, 2018-2023
9. Touchless Sensing Market by Touchless Sanitary Equipment
9.1 Introduction
9.2 Touchless Faucets
9.2.1 Market Estimates & Forecast, 2018-2023
9.2.2 Market Estimates & Forecast by Region, 2018-2023
9.3 Touchless Soap Dispensers
9.3.1 Market Estimates & Forecast, 2018-2023
9.3.2 Market Estimates & Forecast by Region, 2018-2023
9.4 Touchless Towel Dispensers
9.4.1 Market Estimates & Forecast, 2018-2023
9.4.2 Market Estimates & Forecast by Region, 2018-2023
9.5 Touchless Trashcans
9.5.1 Market Estimates & Forecast, 2018-2023
9.5.2 Market Estimates & Forecast by Region, 2018-2023
9.6 Hand Dryers
9.6.1 Market Estimates & Forecast, 2018-2023
9.6.2 Market Estimates & Forecast by Region, 2018-2023
10. Touchless Sensing Market by Touchless Biometric
10.1 Introduction
10.2 Touchless Fingerprint Recognition
10.2.1 Market Estimates & Forecast, 2018-2023
10.2.2 Market Estimates & Forecast by Region, 2018-2023
10.3 Iris Recognition
10.3.1 Market Estimates & Forecast, 2018-2023
10.3.2 Market Estimates & Forecast by Region, 2018-2023
10.3 Face Recognition System
10.4.1 Market Estimates & Forecast, 2018-2023
10.4.2 Market Estimates & Forecast by Region, 2018-2023
10.5 Voice Recognition
10.5.1 Market Estimates & Forecast, 2018-2023
10.5.2 Market Estimates & Forecast by Region, 2018-2023
11. Touchless Sensing Market by Industry
11.1 Introduction
11.2 Consumer Electronics
11.2.1 Market Estimates & Forecast, 2018-2023
11.2.2 Market Estimates & Forecast by Region, 2018-2023
11.3 Government
11.3.1 Market Estimates & Forecast, 2018-2023
11.3.2 Market Estimates & Forecast by Region, 2018-2023
11.4 BFSI
11.4.1 Market Estimates & Forecast, 2018-2023
11.4.2 Market Estimates & Forecast by Region, 2018-2023
11.5 Healthcare
11.5.1 Market Estimates & Forecast, 2018-2023
11.5.2 Market Estimates & Forecast by Region, 2018-2023
11.6 Automotive
11.6.1 Market Estimates & Forecast, 2018-2023
11.6.2 Market Estimates & Forecast by Region, 2018-2023
11.7 Others
11.7.1 Market Estimates & Forecast, 2018-2023
11.7.2 Market Estimates & Forecast by Region, 2018-2023
12. Touchless Sensing Market by Region
12.1 Introduction
12.2 North America
12.2.1 Market Estimates & Forecast, 2018-2023
12.2.2 Market Estimates & Forecast by Technology, 2018-2023
12.2.3 Market Estimates & Forecast by Product, 2018-2023
12.2.4 Market Estimates & Forecast by Industry, 2018-2023
12.2.5 U.S.
12.2.5.1 Market Estimates & Forecast, 2018-2023
12.2.5.2 Market Estimates & Forecast by Technology, 2018-2023
12.2.5.3 Market Estimates & Forecast by Product, 2018-2023
12.2.5.4 Market Estimates & Forecast by Industry, 2018-2023
12.2.6 Canada
12.2.6.1 Market Estimates & Forecast, 2018-2023
12.2.6.2 Market Estimates & Forecast by Technology, 2018-2023
12.2.6.3 Market Estimates & Forecast by Product, 2018-2023
12.2.6.4 Market Estimates & Forecast by Industry, 2018-2023
12.2.7 Mexico
12.2.7.1 Market Estimates & Forecast, 2018-2023
12.2.7.2 Market Estimates & Forecast by Technology, 2018-2023
12.2.7.3 Market Estimates & Forecast by Product, 2018-2023
12.2.7.4 Market Estimates & Forecast by Industry, 2018-2023
12.3 Europe
12.3.1 Market Estimates & Forecast, 2018-2023
12.3.2 Market Estimates & Forecast by Technology, 2018-2023
12.3.3 Market Estimates & Forecast by Product, 2018-2023
12.3.4 Market Estimates & Forecast by Industry, 2018-2023
12.3.5 Germany
12.3.5.1 Market Estimates & Forecast, 2018-2023
12.3.5.2 Market Estimates & Forecast by Technology, 2018-2023
12.3.5.3 Market Estimates & Forecast by Product, 2018-2023
12.3.5.4 Market Estimates & Forecast by Industry, 2018-2023
12.3.6 France
12.3.6.1 Market Estimates & Forecast, 2018-2023
12.3.6.2 Market Estimates & Forecast by Technology, 2018-2023
12.3.6.3 Market Estimates & Forecast by Product, 2018-2023
12.3.6.4 Market Estimates & Forecast by Industry, 2018-2023
12.3.7 Italy
12.3.7.1 Market Estimates & Forecast, 2018-2023
12.3.7.2 Market Estimates & Forecast by Technology, 2018-2023
12.3.7.3 Market Estimates & Forecast by Product, 2018-2023
12.3.7.4 Market Estimates & Forecast by Industry, 2018-2023
12.3.8 Spain
12.3.8.1 Market Estimates & Forecast, 2018-2023
12.3.8.2 Market Estimates & Forecast by Technology, 2018-2023
12.3.8.3 Market Estimates & Forecast by Product, 2018-2023
12.3.8.4 Market Estimates & Forecast by Industry, 2018-2023
12.3.9 U.K
12.3.9.1 Market Estimates & Forecast, 2018-2023
12.3.9.2 Market Estimates & Forecast by Technology, 2018-2023
12.3.9.3 Market Estimates & Forecast by Product, 2018-2023
12.3.9.4 Market Estimates & Forecast by Industry, 2018-2023
12.4 Asia Pacific
12.4.1 Market Estimates & Forecast, 2018-2023
12.4.2 Market Estimates & Forecast by Technology, 2018-2023
12.4.3 Market Estimates & Forecast by Product, 2018-2023
12.4.4 Market Estimates & Forecast by Industry, 2018-2023
12.4.5 China
12.4.5.1 Market Estimates & Forecast, 2018-2023
12.4.5.2 Market Estimates & Forecast by Technology, 2018-2023
12.4.5.3 Market Estimates & Forecast by Product, 2018-2023
12.4.5.4 Market Estimates & Forecast by Industry, 2018-2023
12.4.6 India
12.4.6.1 Market Estimates & Forecast, 2018-2023
12.4.6.2 Market Estimates & Forecast by Technology, 2018-2023
12.4.6.3 Market Estimates & Forecast by Product, 2018-2023
12.4.6.4 Market Estimates & Forecast by Industry, 2018-2023
12.4.7 Japan
12.4.7.1 Market Estimates & Forecast, 2018-2023
12.4.7.2 Market Estimates & Forecast by Technology, 2018-2023
12.4.7.3 Market Estimates & Forecast by Product, 2018-2023
12.4.7.4 Market Estimates & Forecast by Industry, 2018-2023
12.4.8 Rest of Asia Pacific
12.4.8.1 Market Estimates & Forecast, 2018-2023
12.4.8.2 Market Estimates & Forecast by Technology, 2018-2023
12.4.8.3 Market Estimates & Forecast by Product, 2018-2023
12.4.8.4 Market Estimates & Forecast by Industry, 2018-2023
12.5 Rest of the World
12.5.1 Market Estimates & Forecast, 2018-2023
12.5.2 Market Estimates & Forecast by Technology, 2018-2023
12.5.3 Market Estimates & Forecast by Product, 2018-2023
12.5.4 Market Estimates & Forecast by Industry, 2018-2023
12.5.5 The Middle East & Africa
12.5.5.1 Market Estimates & Forecast, 2018-2023
12.5.5.2 Market Estimates & Forecast by Technology, 2018-2023
12.5.5.3 Market Estimates & Forecast by Product, 2018-2023
12.5.5.4 Market Estimates & Forecast by Industry, 2018-2023
12.5.6 Latin America
12.5.6.1 Market Estimates & Forecast, 2018-2023
12.5.6.2 Market Estimates & Forecast by Technology, 2018-2023
12.5.6.3 Market Estimates & Forecast by Product, 2018-2023
12.5.6.4 Market Estimates & Forecast by Industry, 2018-2023
13. Company Landscape
14. Company Profiles
14.1 Eyesight Technologies Ltd.
14.1.1 Company Overview
14.1.2 Product/Business Segment Overview
14.1.3 Financial Updates
14.1.4 Key Developments
14.2 Microsoft Corporation
14.2.1 Company Overview
14.2.2 Product/Business Segment Overview
14.2.3 Financial Updates
14.2.4 Key Developments
14.3 Qualcomm Inc.
14.3.1 Company Overview
14.3.2 Product/Business Segment Overview
14.3.3 Financial Updates
14.3.4 Key Developments
14.4 Microchip Technology Inc.
14.4.1 Company Overview
14.4.2 Product/Business Segment Overview
14.4.3 Financial Updates
14.4.4 Key Developments
14.5 Elliptic Labs Inc.,
14.5.1 Company Overview
14.5.2 Product/Business Segment Overview
14.5.3 Financial Updates
14.5.4 Key Developments
14.6 CogniVue Corporation
14.6.1 Company Overview
14.6.2 Product/Business Segment Overview
14.6.3 Financial Updates
14.6.4 Key Developments
14.7 InvenSense
14.7.1 Company Overview
14.7.2 Product/Business Segment Overview
14.7.3 Financial Updates
14.7.4 Key Developments
14.8 Crossmatch
14.8.1 Company Overview
14.8.2 Product/Business Segment Overview
14.8.3 Financial Updates
14.8.4 Key Developments
14.9 NXP Semiconductors
14.9.1 Company Overview
14.9.2 Product/Business Segment Overview
14.9.3 Financial Updates
14.9.4 Key Developments
14.10 Cognitec Systems GmbH
14.10.1 Company Overview
14.10.2 Product/Business Segment Overview
14.10.3 Financial Updates
14.10.4 Key Developments
15 Conclusion
List of Tables
Table 1 Touchless Sensing Market: By Region, 2018-2023
Table 2 North America Touchless Sensing Market: By Country, 2018-2023
Table 3 Europe Touchless Sensing Market: By Country, 2018-2023
Table 4 Asia Pacific Touchless Sensing Market: By Country, 2018-2023
Table 5 The Middle East & Africa Touchless Sensing Market: By Country, 2018-2023
Table 6 Latin America Touchless Sensing Market: By Country, 2018-2023
Table 7 Global Touchless Sensing by Technology Market: By Regions, 2018-2023
Table 8 North America Touchless Sensing by Technology Market: By Country, 2018-2023
Table 9 Europe Touchless Sensing by Technology Market: By Country, 2018-2023
Table10 Asia Pacific Touchless Sensing by Technology Market: By Country, 2018-2023
Table11 The Middle East & Africa Touchless Sensing by Technology Market: By Country, 2018-2023
Table12 Latin America Touchless Sensing by Technology Market: By Country, 2018-2023
Table13 Global Touchless Sensing by Product Market: By Regions, 2018-2023
Table14 North America Touchless Sensing by Product Market: By Country, 2018-2023
Table15 Europe Touchless Sensing by Product Market: By Country, 2018-2023
Table16 Asia Pacific Touchless Sensing by Product Market: By Country, 2018-2023
Table17 The Middle East & Africa Touchless Sensing by Product Market: By Country, 2018-2023
Table18 Latin America Touchless Sensing by Product Market: By Country, 2018-2023
Table19 Global Solutions Market: By Region, 2018-2023
Table20 Global Services Market: By Region, 2018-2023
Table21 North America Touchless Sensing Market, By Country
Table22 North America Touchless Sensing Market, By Technology
Table23 North America Touchless Sensing Market, By Product
Table24 Europe: Touchless Sensing Market, By Country
Table25 Europe: Touchless Sensing Market, By Technology
Table26 Europe: Touchless Sensing Market, By Product
LIST OF FIGURES
FIGURE 1 Global Touchless Sensing Market Segmentation
FIGURE 2 Forecast Methodology
FIGURE 3 Porter’s Five Forces Analysis of Global Touchless Sensing Market
FIGURE 4 Value Chain of Global Touchless Sensing Market
FIGURE 5 Share of Touchless Sensing Market in 2018, by country (in %)
FIGURE 6 Global Touchless Sensing Market, 2018-2023,
FIGURE 7 Global Touchless Sensing Market size by Technology, 2018
FIGURE 8 Share of Global Touchless Sensing Market by Technology, 2018 TO 2023
FIGURE 9 Global Touchless Sensing Market size by Product, 2018
FIGURE 10 Share of Global Touchless Sensing Market by Technology, 2018 TO 2023
FIGURE 11 Global Touchless Sensing Market size by Product, 2018
FIGURE 12 Share of Global Touchless Sensing Market by Product, 2018 TO 2023
FIGURE 11 Global Touchless Sensing Market size by Industry, 2018
FIGURE 12 Share of Global Touchless Sensing Market by Industry, 2018 TO 2023