Telecom Managed Services Market (2025 - 2035)

ID: MRFR/ICT/4382-HCR
100 Pages
Apoorva Priyadarshi
Last Updated: June 30, 2026
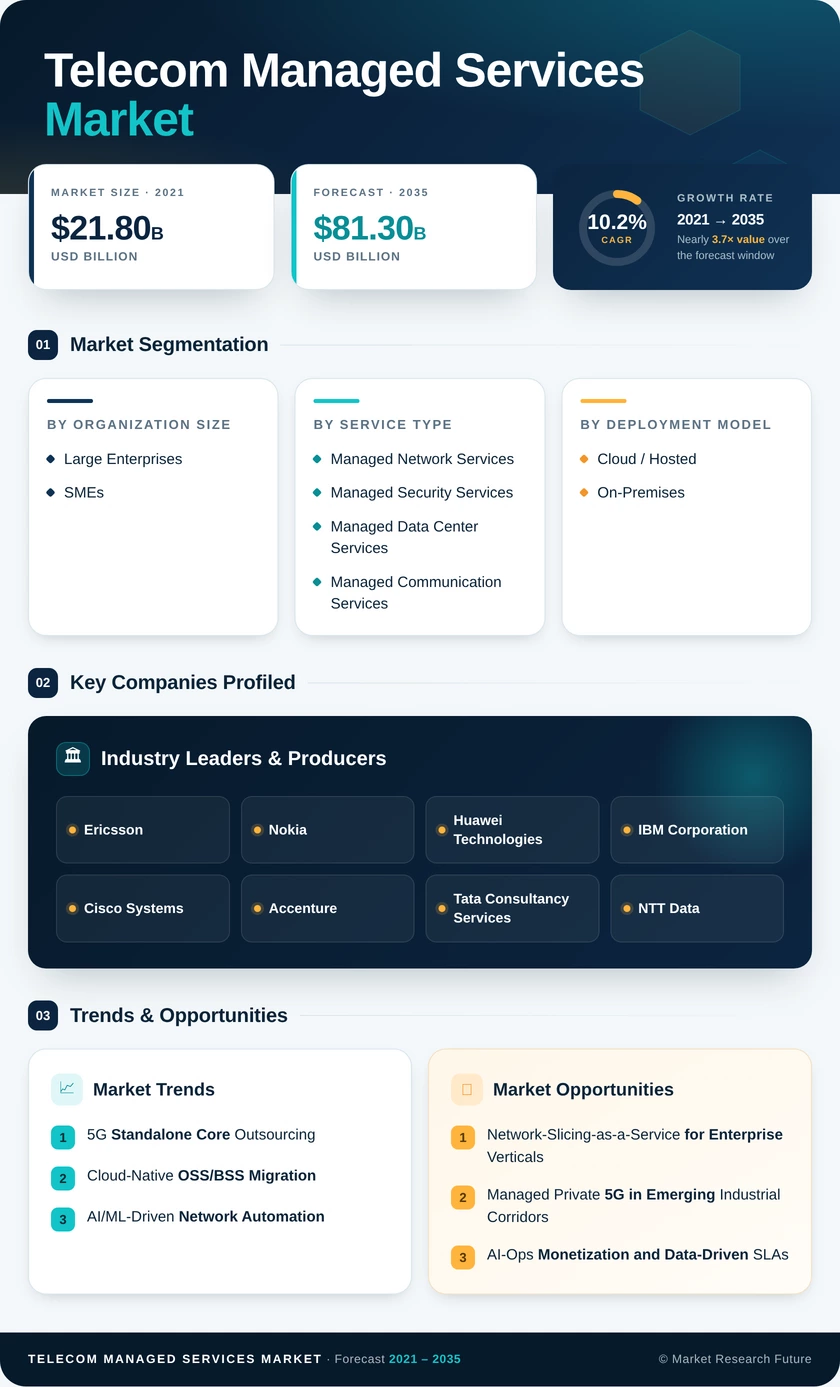
Telecom Managed Services Market Size, Share and Research Report By Organization Size (Large Enterprises, SMEs), By Service Type (Managed Network Services, Managed Security Services, Managed Data Center Services, Managed Communication Services), By Deployment Model (Cloud / Hosted, On-Premises), By Telecom Operator Type (Mobile Network Operators (MNOs), Internet Service Providers (ISPs), MVNOs), By End-User Vertical (Consumer Segment, Enterprise Segment, Government & Public Sector) and By Regional (North America, Europe, South America, Asia Pacific, Middle East and Africa) - Industry Forecast to 2035.
Telecom Managed Services Market
Market Size
Forecast Period2025-2035
CAGR (2025-2035)10.2%
2025 Market SizeUSD 30.78 Billion
2035 Market SizeUSD 81.30 Billion
Key Players
Ericsson
Nokia
Huawei Technologies
IBM Corporation
Cisco Systems
Accenture
Opportunities
  • Network-Slicing-as-a-Service for Enterprise Verticals
  • Managed Private 5G in Emerging Industrial Corridors
  • AI-Ops Monetization and Data-Driven SLAs
  1. 1 Market Overview |
    1. 1.1 Study Assumptions & Market Definition |
    2. 1.2 Scope of the Study |
    3. 1.3 Research Methodology
  2. 2 Market Summary & Key Takeaways
  3. 3 Market Dynamics |
    1. 3.1 Market Drivers Analysis | |
      1. 3.1.1 5G Standalone Core Outsourcing | |
      2. 3.1.2 Cloud-Native OSS/BSS Migration | |
      3. 3.1.3 AI/ML-Driven Network Automation | |
      4. 3.1.4 Zero-Trust Security Mandates | |
      5. 3.1.5 Enterprise Private 5G Adoption | |
      6. 3.1.6 Emerging-Market Fiber/Mobile Expansion | |
      7. 3.1.7 Network-Slicing Monetization |
    2. 3.2 Market Restraints Analysis | |
      1. 3.2.1 Data-Sovereignty and Localization Laws | |
      2. 3.2.2 Vendor Lock-In and Switching Costs | |
      3. 3.2.3 Skilled-Workforce Shortages | |
      4. 3.2.4 Legacy-Contract Inertia | |
      5. 3.2.5 Cybersecurity Breach-Liability Disputes |
    3. 3.3 Market Opportunity Analysis | |
      1. 3.3.1 Network-Slicing-as-a-Service for Enterprise Verticals | |
      2. 3.3.2 Managed Private 5G in Emerging Industrial Corridors | |
      3. 3.3.3 AI-Ops Monetization and Data-Driven SLAs | |
      4. 3.3.4 Sustainability-Linked Managed Services | |
      5. 3.3.5 Open-RAN Ecosystem Integration |
    4. 3.4 Industry Value Chain Analysis |
    5. 3.5 Porter's Five Forces Analysis
  4. 4 Global Telecom Managed Services Market Size & Forecast (2021–2035) |
    1. 4.1 Historical Market Size (2021–2025) |
    2. 4.2 Current & Forecast Market Size (2026–2035) |
    3. 4.3 Market Size by Revenue (USD Billion) |
    4. 4.4 Year-over-Year Growth Analysis
  5. 5 Segmentation Analysis |
    1. 5.1 By Organization Size | |
      1. 5.1.1 Large Enterprises | |
      2. 5.1.2 SMEs |
    2. 5.2 By Service Type | |
      1. 5.2.1 Managed Network Services | |
      2. 5.2.2 Managed Security Services | |
      3. 5.2.3 Managed Data Center Services | |
      4. 5.2.4 Managed Communication Services |
    3. 5.3 By Deployment Model | |
      1. 5.3.1 Cloud / Hosted | |
      2. 5.3.2 On-Premises |
    4. 5.4 By Telecom Operator Type | |
      1. 5.4.1 Mobile Network Operators (MNOs) | |
      2. 5.4.2 Internet Service Providers (ISPs) | |
      3. 5.4.3 MVNOs |
    5. 5.5 By End-User Vertical | |
      1. 5.5.1 Consumer Segment | |
      2. 5.5.2 Enterprise Segment | |
      3. 5.5.3 Government & Public Sector
  6. 6 Regional Analysis |
    1. 6.1 North America | |
      1. 6.1.1 United States | |
      2. 6.1.2 Canada | |
      3. 6.1.3 Mexico |
    2. 6.2 Europe | |
      1. 6.2.1 Germany | |
      2. 6.2.2 United Kingdom | |
      3. 6.2.3 France | |
      4. 6.2.4 Italy | |
      5. 6.2.5 Spain | |
      6. 6.2.6 Nordic Countries | |
      7. 6.2.7 Russia | |
      8. 6.2.8 Rest of Europe |
    3. 6.3 Asia-Pacific | |
      1. 6.3.1 China | |
      2. 6.3.2 India | |
      3. 6.3.3 Japan | |
      4. 6.3.4 South Korea | |
      5. 6.3.5 ASEAN | |
      6. 6.3.6 Rest of Asia-Pacific |
    4. 6.4 South America | |
      1. 6.4.1 Brazil | |
      2. 6.4.2 Argentina | |
      3. 6.4.3 Rest of South America |
    5. 6.5 Middle East & Africa | |
      1. 6.5.1 Saudi Arabia | |
      2. 6.5.2 UAE | |
      3. 6.5.3 South Africa | |
      4. 6.5.4 Egypt | |
      5. 6.5.5 Rest of MEA
  7. 7 Competitive Landscape |
    1. 7.1 Market Share Analysis (2025) |
    2. 7.2 Competitive Benchmarking Matrix |
    3. 7.3 Company Profiles | |
      1. 7.3.1 Ericsson | |
      2. 7.3.2 Nokia | |
      3. 7.3.3 Huawei Technologies | |
      4. 7.3.4 IBM Corporation | |
      5. 7.3.5 Cisco Systems | |
      6. 7.3.6 Accenture | |
      7. 7.3.7 Tata Consultancy Services | |
      8. 7.3.8 NTT Data | |
      9. 7.3.9 Amdocs | |
      10. 7.3.10 Tech Mahindra
  8. 8 Future Outlook & Strategic Recommendations (2026–2035) |
    1. 8.1 Autonomous Network Operations |
    2. 8.2 Platform Economics and As-a-Service Models |
    3. 8.3 Energy Optimization and ESG Integration |
    4. 8.4 6G Preparedness and R&D Partnerships
  9. 9 Recent Developments & News
  10. 10 Frequently Asked Questions (FAQs)
  11. 11 Report Scope & Methodology |
    1. 11.1 Study Period & Base Year |
    2. 11.2 Data Sources & Citations |
    3. 11.3 Abbreviations
  12. 12 LIST OF TABLES |
  13. TABLE 1 Global Telecom Managed Services Market Size & Forecast, by Revenue (USD Billion), 2021–2035 |
  14. TABLE 2 Global Telecom Managed Services Market – Year-over-Year Growth Analysis, 2021–2035 |
  15. TABLE 3 Global Telecom Managed Services Market – Driver Impact Analysis |
  16. TABLE 4 Global Telecom Managed Services Market – Restraint Impact Analysis |
  17. TABLE 5 Global Telecom Managed Services Market Size, by Organization Size, 2021–2035 (USD Billion) |
  18. TABLE 6 Global Telecom Managed Services Market Size, by Service Type, 2021–2035 (USD Billion) |
  19. TABLE 7 Global Telecom Managed Services Market Size, by Deployment Model, 2021–2035 (USD Billion) |
  20. TABLE 8 Global Telecom Managed Services Market Size, by Telecom Operator Type, 2021–2035 (USD Billion) |
  21. TABLE 9 Global Telecom Managed Services Market Size, by End-User Vertical, 2021–2035 (USD Billion) |
  22. TABLE 10 Global Telecom Managed Services Market Size, by Region, 2021–2035 (USD Billion) |
  23. TABLE 11 North America Telecom Managed Services Market Size, by Country, 2021–2035 (USD Billion) |
  24. TABLE 12 North America Telecom Managed Services Market Size, by Service Type, 2021–2035 (USD Billion) |
  25. TABLE 13 North America Telecom Managed Services Market Size, by Deployment Model, 2021–2035 (USD Billion) |
  26. TABLE 14 Europe Telecom Managed Services Market Size, by Country, 2021–2035 (USD Billion) |
  27. TABLE 15 Europe Telecom Managed Services Market Size, by Service Type, 2021–2035 (USD Billion) |
  28. TABLE 16 Europe Telecom Managed Services Market Size, by Deployment Model, 2021–2035 (USD Billion) |
  29. TABLE 17 Asia-Pacific Telecom Managed Services Market Size, by Country, 2021–2035 (USD Billion) |
  30. TABLE 18 Asia-Pacific Telecom Managed Services Market Size, by Service Type, 2021–2035 (USD Billion) |
  31. TABLE 19 Asia-Pacific Telecom Managed Services Market Size, by Deployment Model, 2021–2035 (USD Billion) |
  32. TABLE 20 South America Telecom Managed Services Market Size, by Country, 2021–2035 (USD Billion) |
  33. TABLE 21 South America Telecom Managed Services Market Size, by Service Type, 2021–2035 (USD Billion) |
  34. TABLE 22 Middle East & Africa Telecom Managed Services Market Size, by Country, 2021–2035 (USD Billion) |
  35. TABLE 23 Middle East & Africa Telecom Managed Services Market Size, by Service Type, 2021–2035 (USD Billion) |
  36. TABLE 24 Competitive Benchmarking Matrix – Global Telecom Managed Services Market, 2025 |
  37. TABLE 25 Company Profiles – Key Players, Global Telecom Managed Services Market |
  38. TABLE 26 Recent Developments & Strategic Announcements, 2023–2025 |
  39. TABLE 27 Report Scope & Methodology Summary |
  40. TABLE 28 Detailed Sources and Citations
  41. 13 LIST OF FIGURES |
  42. FIGURE 1 Global Telecom Managed Services Market Dynamics (Drivers, Restraints, Opportunities) |
  43. FIGURE 2 Industry Value Chain Analysis – Telecom Managed Services Market |
  44. FIGURE 3 Porter's Five Forces Analysis – Telecom Managed Services Market |
  45. FIGURE 4 Global Telecom Managed Services Market Size Trend, 2021–2035 (USD Billion) |
  46. FIGURE 5 Global Telecom Managed Services Market Share, by Organization Size, 2025 (%) |
  47. FIGURE 6 Global Telecom Managed Services Market Share, by Service Type, 2025 (%) |
  48. FIGURE 7 Global Telecom Managed Services Market Share, by Deployment Model, 2025 (%) |
  49. FIGURE 8 Global Telecom Managed Services Market Share, by Telecom Operator Type, 2025 (%) |
  50. FIGURE 9 Global Telecom Managed Services Market Share, by End-User Vertical, 2025 (%) |
  51. FIGURE 10 Global Telecom Managed Services Market Share, by Region, 2025 (%) |
  52. FIGURE 11 North America Telecom Managed Services Market Share, by Country, 2025 (%) |
  53. FIGURE 12 Europe Telecom Managed Services Market Share, by Country, 2025 (%) |
  54. FIGURE 13 Asia-Pacific Telecom Managed Services Market Share, by Country, 2025 (%) |
  55. FIGURE 14 South America Telecom Managed Services Market Share, by Country, 2025 (%) |
  56. FIGURE 15 Middle East & Africa Telecom Managed Services Market Share, by Country, 2025 (%) |
  57. FIGURE 16 Competitive Landscape – Market Share Analysis, 2025

Segmentation Quick Reference

DimensionSub-SegmentsDominant SegmentFastest Growing Segment
Organization SizeLarge Enterprises, SMEsLarge EnterprisesSMEs
Service TypeManaged Network Services, Managed Security Services, Managed Data Center Services, Managed Communication ServicesManaged Network ServicesManaged Security Services
Deployment ModelTelecom Managed Services Market / Hosted, On-PremisesTelecom Managed Services Market / HostedTelecom Managed Services Market / Hosted
Telecom Operator TypeMNOs, ISPs, MVNOsMNOsISPs
End-User VerticalConsumer Segment, Enterprise Segment, Government & Public SectorConsumer SegmentEnterprise Segment


Market Segmentation Overview

By Organization Size

Sub-SegmentKey Trend
Large EnterprisesMulti-site NOC consolidation and private 5G integration drive long-term managed-service engagements.
SMEsTelecom Managed Services Market-managed SD-WAN and subscription-based security bundles lower the entry barrier for smaller organizations.


Large enterprises continue to dominate spending as they rationalize complex, multi-geography network estates through centralized managed-service platforms. At the same time, SMEs are the faster-growing cohort as cloud-delivered, opex-friendly service packages expand addressable demand.

By Service Type

Sub-SegmentKey Trend
Managed Network ServicesCore and access-layer outsourcing accelerates with open-RAN multi-vendor integration requirements.
Managed Security ServicesRegulatory mandates (NIS2, CISA zero-trust) and rising DDoS sophistication expand SOC-as-a-service adoption.
Managed Data Center ServicesEdge-compute hosting and colocation management gain traction as operators deploy distributed architectures
Managed Communication ServicesUCaaS and CPaaS integration into carrier portfolios drives bundled managed-service contracts.


Managed network services remain the revenue cornerstone, while managed security services are experiencing the fastest growth as compliance requirements and threat complexity outpace operators' in-house capabilities.

By Deployment Model

Sub-SegmentKey Trend
Telecom Managed Services Market / HostedHyperscaler partnerships enable elastic scaling and continuous platform updates for BSS/OSS workloads.
On-PremisesData-sovereignty constraints and ultra-low-latency requirements sustain demand for localized managed deployments.


Telecom Managed Services Market-hosted platforms command the majority share and continue to gain ground as operators prioritize agility and cost efficiency. However, on-premises managed services retain relevance in regulated markets with strict data-localization mandates.

By Telecom Operator Type

Sub-SegmentKey Trend
Mobile Network Operators (MNOs)5G SA core lifecycle management and AI-driven RAN optimization define large-scale managed-service contracts
Internet Service Providers (ISPs)Government-funded fiber buildouts (BEAD, BharatNet) create new managed-service demand among mid-tier ISPs
MVNOsFull-stack outsourcing and eSIM management enable asset-light business models for virtual operators.


MNOs remain the largest buyer category due to the scale and complexity of their network estates. At the same time, ISPs represent the fastest-growing operator segment as public broadband-subsidy programs require operational-readiness partnerships.

By End-User Vertical

Sub-SegmentKey Trend
Consumer SegmentBroadband and mobile subscriber lifecycle management underpins stable, high-volume managed-service contracts.
Enterprise SegmentIndustry 4.0, IoT, and private-network deployments drive rapid growth in enterprise-facing managed services.
Government & Public SectorPublic-safety networks (FirstNet, ESN) and smart-city initiatives create specialized managed-service opportunities


The consumer segment accounts for the largest share of managed-service revenue due to the sheer scale of subscriber operations, while enterprise demand is accelerating as industrial digitalization projects require carrier-grade connectivity with guaranteed SLAs.


 

Download PDF ×

We do not share your information with anyone. However, we may send you emails based on your report interest from time to time. You may contact us at any time to opt-out.