Synthetic Monitoring Market (2026 - 2035)

ID: MRFR/ICT/4159-CR
138 Pages
Ankit Gupta
Last Updated: July 21, 2026
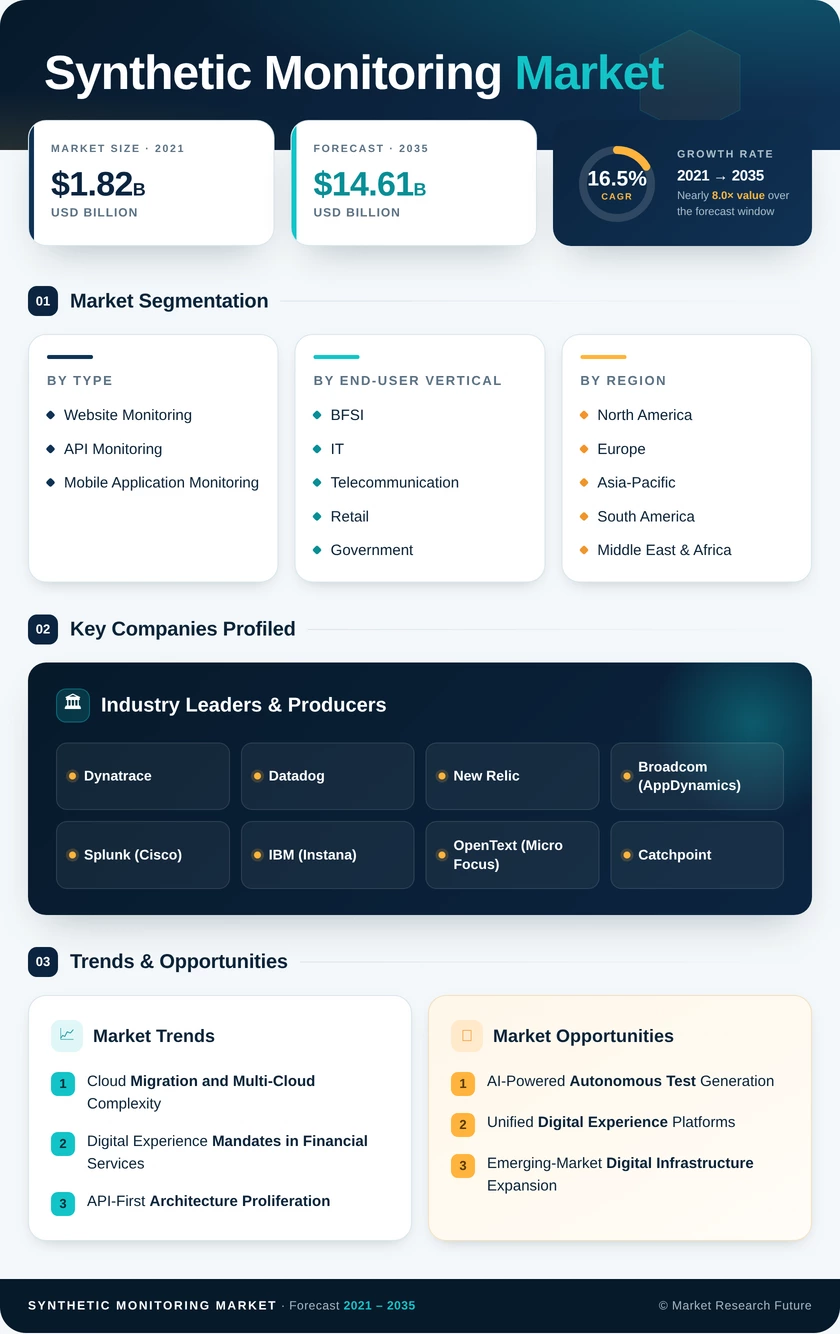
Synthetic Monitoring Market Size, Share and Research Report By Type (Website Monitoring, API Monitoring, Mobile Application Monitoring), By End-User Vertical (BFSI, IT and Telecommunication, Retail, Government, Manufacturing and Automotive, Military and Defense, Other End-User Verticals) and By Regional (North America, Europe, South America, Asia Pacific, Middle East and Africa) - Industry Forecast to 2035.
Synthetic Monitoring Market
Market Size
Forecast Period2026-2035
CAGR (2026-2035)16.5%
2035 Market SizeUSD 14.61 Billion
Key Players
Dynatrace
Datadog
New Relic
Broadcom
Splunk
IBM
Opportunities
  • AI-Powered Autonomous Test Generation
  • Unified Digital Experience Platforms
  • Emerging-Market Digital Infrastructure Expansion
  1. 1 Market Overview |
    1. 1.1 Study Assumptions & Market Definition |
    2. 1.2 Scope of the Study |
    3. 1.3 Research Methodology
  2. 2 Market Summary & Key Takeaways
  3. 3 Market Dynamics |
    1. 3.1 Market Drivers Analysis | |
      1. 3.1.1 Cloud Migration and Multi-Cloud Complexity | |
      2. 3.1.2 Digital Experience Mandates in Financial Services | |
      3. 3.1.3 API-First Architecture Proliferation | |
      4. 3.1.4 5G and Edge Computing Infrastructure | |
      5. 3.1.5 Regulatory Uptime and Accessibility Requirements | |
      6. 3.1.6 Mobile-First Consumer Engagement Strategies | |
      7. 3.1.7 AI-Augmented Test Creation and Anomaly Detection |
    2. 3.2 Market Restraints Analysis | |
      1. 3.2.1 High Implementation and Orchestration Costs | |
      2. 3.2.2 False Positives and Alert Fatigue | |
      3. 3.2.3 Inability to Capture Real-User Behavioral Variance | |
      4. 3.2.4 Data Privacy and Checkpoint Jurisdiction Constraints | |
      5. 3.2.5 Vendor Lock-In and Integration Complexity |
    3. 3.3 Market Opportunity Analysis | |
      1. 3.3.1 AI-Powered Autonomous Test Generation | |
      2. 3.3.2 Unified Digital Experience Platforms | |
      3. 3.3.3 Emerging-Market Digital Infrastructure Expansion | |
      4. 3.3.4 Compliance-as-a-Service Monitoring Bundles | |
      5. 3.3.5 IoT and Connected Device Endpoint Monitoring |
    4. 3.4 Industry Value Chain Analysis |
    5. 3.5 Porter's Five Forces Analysis
  4. 4 Global Synthetic Monitoring Market Size & Forecast (2021–2035) |
    1. 4.1 Historical Market Size (2021–2025) |
    2. 4.2 Current & Forecast Market Size (2026–2035) |
    3. 4.3 Market Size by Revenue (USD Billion) |
    4. 4.4 Year-over-Year Growth Analysis
  5. 5 Segmentation Analysis |
    1. 5.1 By Type | |
      1. 5.1.1 Website Monitoring | |
      2. 5.1.2 API Monitoring | |
      3. 5.1.3 Mobile Application Monitoring |
    2. 5.2 By End-User Vertical | |
      1. 5.2.1 BFSI | |
      2. 5.2.2 IT and Telecommunication | |
      3. 5.2.3 Retail | |
      4. 5.2.4 Government | |
      5. 5.2.5 Manufacturing and Automotive | |
      6. 5.2.6 Military and Defense | |
      7. 5.2.7 Other End-User Verticals
  6. 6 Regional Analysis |
    1. 6.1 North America | |
      1. 6.1.1 United States | |
      2. 6.1.2 Canada | |
      3. 6.1.3 Mexico |
    2. 6.2 Europe | |
      1. 6.2.1 Germany | |
      2. 6.2.2 United Kingdom | |
      3. 6.2.3 France | |
      4. 6.2.4 Italy | |
      5. 6.2.5 Spain | |
      6. 6.2.6 Nordic Countries | |
      7. 6.2.7 Russia | |
      8. 6.2.8 Rest of Europe |
    3. 6.3 Asia-Pacific | |
      1. 6.3.1 China | |
      2. 6.3.2 India | |
      3. 6.3.3 Japan | |
      4. 6.3.4 South Korea | |
      5. 6.3.5 ASEAN | |
      6. 6.3.6 Rest of Asia-Pacific |
    4. 6.4 South America | |
      1. 6.4.1 Brazil | |
      2. 6.4.2 Argentina | |
      3. 6.4.3 Rest of South America |
    5. 6.5 Middle East & Africa | |
      1. 6.5.1 Saudi Arabia | |
      2. 6.5.2 UAE | |
      3. 6.5.3 South Africa | |
      4. 6.5.4 Egypt | |
      5. 6.5.5 Rest of MEA
  7. 7 Competitive Landscape |
    1. 7.1 Market Share Analysis (2025) |
    2. 7.2 Competitive Benchmarking Matrix |
    3. 7.3 Company Profiles | |
      1. 7.3.1 Dynatrace | |
      2. 7.3.2 Datadog | |
      3. 7.3.3 New Relic | |
      4. 7.3.4 Broadcom (AppDynamics) | |
      5. 7.3.5 Splunk (Cisco) | |
      6. 7.3.6 IBM (Instana) | |
      7. 7.3.7 OpenText (Micro Focus) | |
      8. 7.3.8 Catchpoint | |
      9. 7.3.9 SmartBear | |
      10. 7.3.10 Uptrends
  8. 8 Future Outlook & Strategic Recommendations (2026–2035) |
    1. 8.1 AI-Driven Autonomous Monitoring (2026–2028) |
    2. 8.2 Platform Consolidation and Observability Convergence (2028–2031) |
    3. 8.3 Edge-Native and IoT Monitoring Expansion (2030–2033) |
    4. 8.4 Sustainability and Green IT Reporting Integration (2032–2035)
  9. 9 Recent Developments & News
  10. 10 Frequently Asked Questions (FAQs)
  11. 11 Report Scope & Methodology |
    1. 11.1 Study Period & Base Year |
    2. 11.2 Data Sources & Citations |
    3. 11.3 Abbreviations
  12. 12 LIST OF TABLES |
  13. TABLE 1 Global Synthetic Monitoring Market Size & Forecast, by Revenue (USD Billion), 2021–2035 |
  14. TABLE 2 Global Synthetic Monitoring Market – Year-over-Year Growth Analysis, 2021–2035 |
  15. TABLE 3 Global Synthetic Monitoring Market – Driver Impact Analysis |
  16. TABLE 4 Global Synthetic Monitoring Market – Restraint Impact Analysis |
  17. TABLE 5 Global Synthetic Monitoring Market Size, by Type, 2021–2035 (USD Billion) |
  18. TABLE 6 Global Synthetic Monitoring Market Size, by End-User Vertical, 2021–2035 (USD Billion) |
  19. TABLE 7 Global Synthetic Monitoring Market Size, by Region, 2021–2035 (USD Billion) |
  20. TABLE 8 North America Synthetic Monitoring Market Size, by Country, 2021–2035 (USD Billion) |
  21. TABLE 9 Europe Synthetic Monitoring Market Size, by Country, 2021–2035 (USD Billion) |
  22. TABLE 10 Asia-Pacific Synthetic Monitoring Market Size, by Country, 2021–2035 (USD Billion) |
  23. TABLE 11 South America Synthetic Monitoring Market Size, by Country, 2021–2035 (USD Billion) |
  24. TABLE 12 Middle East & Africa Synthetic Monitoring Market Size, by Country, 2021–2035 (USD Billion) |
  25. TABLE 13 Competitive Benchmarking Matrix – Global Synthetic Monitoring Market, 2025 |
  26. TABLE 14 Company Profiles – Key Players, Global Synthetic Monitoring Market |
  27. TABLE 15 Recent Developments & Strategic Announcements, 2024–2025 |
  28. TABLE 16 Report Scope & Methodology Summary |
  29. TABLE 17 Detailed Sources and Citations |
  30. TABLE 18 North America Synthetic Monitoring Market Size, by Type, 2021–2035 (USD Billion) |
  31. TABLE 19 North America Synthetic Monitoring Market Size, by End-User Vertical, 2021–2035 (USD Billion) |
  32. TABLE 20 Europe Synthetic Monitoring Market Size, by Type, 2021–2035 (USD Billion) |
  33. TABLE 21 Europe Synthetic Monitoring Market Size, by End-User Vertical, 2021–2035 (USD Billion) |
  34. TABLE 22 Asia-Pacific Synthetic Monitoring Market Size, by Type, 2021–2035 (USD Billion) |
  35. TABLE 23 Asia-Pacific Synthetic Monitoring Market Size, by End-User Vertical, 2021–2035 (USD Billion) |
  36. TABLE 24 South America Synthetic Monitoring Market Size, by Type, 2021–2035 (USD Billion) |
  37. TABLE 25 South America Synthetic Monitoring Market Size, by End-User Vertical, 2021–2035 (USD Billion) |
  38. TABLE 26 Middle East & Africa Synthetic Monitoring Market Size, by Type, 2021–2035 (USD Billion) |
  39. TABLE 27 Middle East & Africa Synthetic Monitoring Market Size, by End-User Vertical, 2021–2035 (USD Billion)
  40. 13 LIST OF FIGURES |
  41. FIGURE 1 Synthetic Monitoring Market Dynamics (Drivers, Restraints, Opportunities) |
  42. FIGURE 2 Industry Value Chain Analysis – Synthetic Monitoring Market |
  43. FIGURE 3 Porter's Five Forces Analysis – Synthetic Monitoring Market |
  44. FIGURE 4 Global Synthetic Monitoring Market Size Trend (USD Billion), 2021–2035 |
  45. FIGURE 5 Synthetic Monitoring Market Share, by Type (%), 2025 |
  46. FIGURE 6 Synthetic Monitoring Market Share, by End-User Vertical (%), 2025 |
  47. FIGURE 7 Synthetic Monitoring Market Share, by Region (%), 2025 |
  48. FIGURE 8 North America Synthetic Monitoring Market Size Trend, 2021–2035 |
  49. FIGURE 9 Europe Synthetic Monitoring Market Size Trend, 2021–2035 |
  50. FIGURE 10 Asia-Pacific Synthetic Monitoring Market Size Trend, 2021–2035 |
  51. FIGURE 11 South America Synthetic Monitoring Market Size Trend, 2021–2035 |
  52. FIGURE 12 Middle East & Africa Synthetic Monitoring Market Size Trend, 2021–2035 |
  53. FIGURE 13 Competitive Landscape – Market Share Analysis, 2025 |
  54. FIGURE 14 Competitive Benchmarking Radar Chart, 2025

Segmentation Quick Reference

DimensionSub-SegmentsDominant SegmentFastest Growing Segment
By TypeWebsite Monitoring, API Monitoring, Mobile Application MonitoringWebsite MonitoringAPI Monitoring
By End-User VerticalBFSI, IT and Telecommunication, Retail, Government, Manufacturing and Automotive, Military and Defense, Other End-User VerticalsBFSIIT and Telecommunication
By RegionNorth America, Europe, Asia-Pacific, South America, Middle East & AfricaNorth AmericaAsia-Pacific


Market Segmentation Overview

By Type

Sub-SegmentKey Trend
Website MonitoringMulti-browser scripted checks remain foundational for consumer-facing reliability assurance
API MonitoringMicroservices and API-gateway proliferation drive fastest adoption among type segments
Mobile Application MonitoringMobile-first strategies in banking and retail expand scripted-app testing requirements


Website Monitoring continues to anchor the type segmentation, driven by the universal need for page-load and checkout-flow validation. API Monitoring is gaining share rapidly as organizations expose hundreds of endpoints through API gateways, each requiring automated health verification.

By End-User Vertical

Sub-SegmentKey Trend
BFSIRegulatory mandates (DORA, PCI-DSS 4.0) formalize continuous availability testing
IT and Telecommunication5G network-slice SLAs require synthetic endpoint validation
RetailSub-second page-load correlation with conversion rates justifies monitoring investment
GovernmentCitizen-portal accessibility and uptime standards drive public-sector adoption
Manufacturing and AutomotiveConnected-factory and supply-chain portal reliability requirements grow
Military and DefenseSecure application readiness testing under classified-network constraints
Other End-User VerticalsHealthcare telehealth platforms and media streaming services expand testing scope


BFSI dominates vertical spending due to the direct financial impact of outages and the escalating regulatory burden. IT and Telecommunications is the fastest-growing vertical, propelled by the complexity of 5G service-level management and network function virtualization.


Download PDF ×

We do not share your information with anyone. However, we may send you emails based on your report interest from time to time. You may contact us at any time to opt-out.