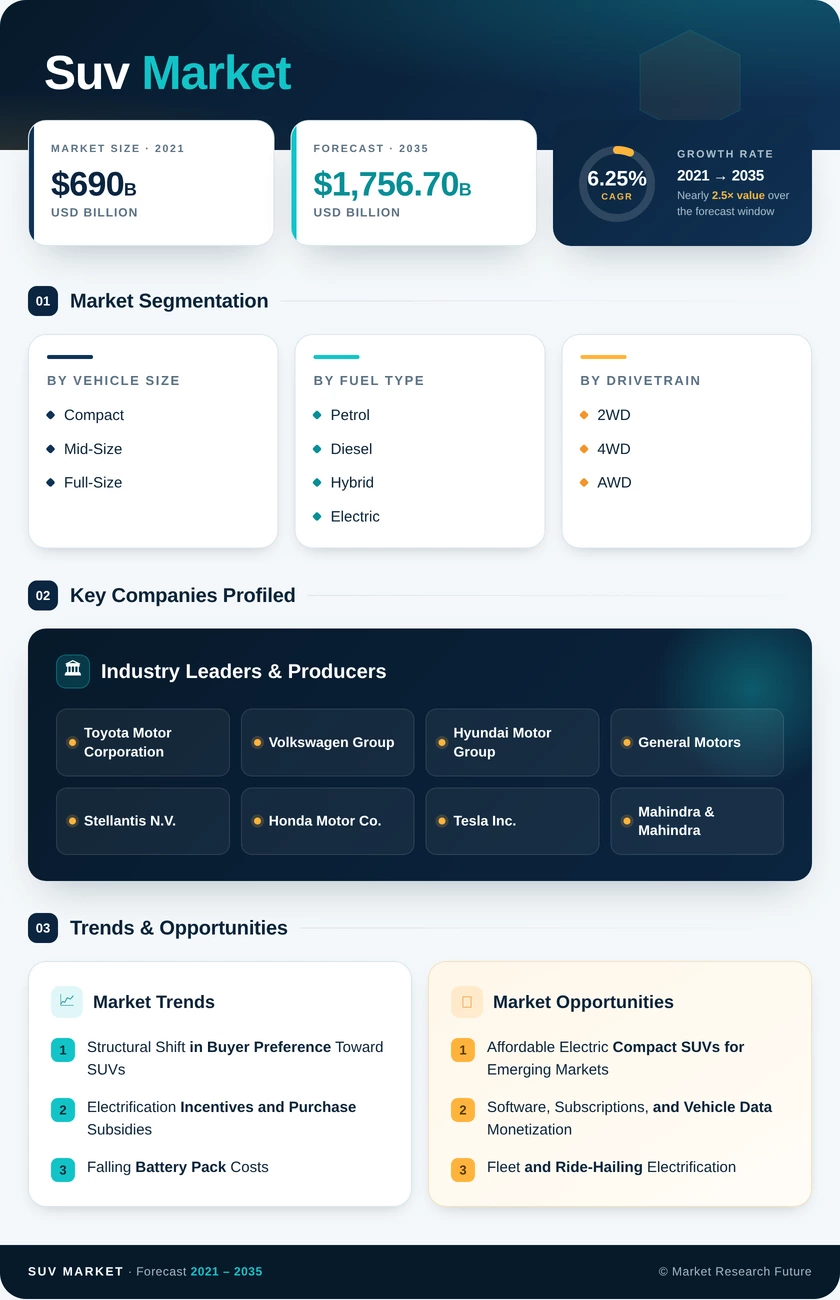
SUV Market (2026 - 2035)

ID: MRFR/AT/66162-HCR 200 Pages Shubham Munde Last Updated: October 21, 2026
SUV Market Research Report By Vehicle Size (Compact, Mid-Size, Full-Size), By Fuel Type (Petrol, Diesel, Hybrid, Electric), By Drivetrain (2WD, 4WD, AWD), By End-User (Personal Use, Commercial Use), By Seating Capacity (5-Seater, 7-Seater) - Forecast to 2035
SUV Market
Market Size
Forecast Period2026-2035
CAGR (2026-2035)6.25%
2025 Market SizeUSD 958.1 billion
2035 Market SizeUSD 1,756.7 billion
Key Players
Toyota Motor Corporation
Volkswagen Group
Hyundai Motor Group
General Motors
Stellantis N.V.
Honda Motor Co.
Opportunities
  • Affordable Electric Compact SUVs for Emerging Markets
  • Software, Subscriptions, and Vehicle Data Monetization
  • Fleet and Ride-Hailing Electrification
  1. 1 Market Summary | |
  2. 2 Key Report Takeaways | |
    1. 2.1 By Vehicle Size | |
    2. 2.2 By Fuel Type | |
    3. 2.3 By Drivetrain | |
    4. 2.4 By End-User | |
    5. 2.5 By Seating Capacity | |
    6. 2.6 By Region | |
  3. 3 Market Size and Forecast (2021–2035) | |
  4. 4 Driver Impact Analysis | |
    1. 4.1 Structural Shift in Buyer Preference Toward SUVs | |
    2. 4.2 Electrification Incentives and Purchase Subsidies | |
    3. 4.3 Falling Battery Pack Costs | |
    4. 4.4 Emerging-Market Income Growth and Localization | |
    5. 4.5 ADAS and Connected-Feature Premiumization | |
    6. 4.6 Modular Platform Economics | |
  5. 5 Restraints Impact Analysis | |
    1. 5.1 Tightening CO₂ and Fuel-Economy Standards | |
    2. 5.2 Trade Tariffs and Supply-Chain Disruption | |
    3. 5.3 Affordability and Financing Costs | |
    4. 5.4 Weight-Based Taxes and Urban Restrictions | |
    5. 5.5 Battery Raw Material Volatility | |
  6. 6 Opportunities | |
    1. 6.1 Affordable Electric Compact SUVs for Emerging Markets | |
    2. 6.2 Software, Subscriptions, and Vehicle Data Monetization | |
    3. 6.3 Fleet and Ride-Hailing Electrification | |
    4. 6.4 Hybrid Powertrains as a Transitional Bridge | |
    5. 6.5 Localized Production Under Tariff Regimes | |
  7. 7 Regional Market Share and Country-Level Analysis | |
    1. 7.1 North America | | |
      1. 7.1.1 United States | | |
      2. 7.1.2 Canada | | |
      3. 7.1.3 Mexico | |
    2. 7.2 Europe | | |
      1. 7.2.1 Germany | | |
      2. 7.2.2 United Kingdom | | |
      3. 7.2.3 France | | |
      4. 7.2.4 Italy | | |
      5. 7.2.5 Spain | | |
      6. 7.2.6 Nordic Countries | | |
      7. 7.2.7 Russia | | |
      8. 7.2.8 Rest of Europe | |
    3. 7.3 Asia-Pacific | | |
      1. 7.3.1 China | | |
      2. 7.3.2 India | | |
      3. 7.3.3 Japan | | |
      4. 7.3.4 South Korea | | |
      5. 7.3.5 ASEAN | | |
      6. 7.3.6 Rest of Asia-Pacific | |
    4. 7.4 South America | | |
      1. 7.4.1 Brazil | | |
      2. 7.4.2 Argentina | | |
      3. 7.4.3 Rest of South America | |
    5. 7.5 Middle East and Africa | | |
      1. 7.5.1 Saudi Arabia | | |
      2. 7.5.2 UAE | | |
      3. 7.5.3 South Africa | | |
      4. 7.5.4 Egypt | | |
      5. 7.5.5 Rest of Middle East and Africa | |
  8. 8 Future Outlook (2026–2035) | |
    1. 8.1 Driver Assistance and Conditional Autonomy | |
    2. 8.2 Software-Defined Platforms and New Revenue Pools | |
    3. 8.3 Electrification Supercycle | |
    4. 8.4 Lifecycle Carbon and Materials Accountability | |
  9. 9 Segmentation Analysis | |
    1. 9.1 By Vehicle Size | | |
      1. 9.1.1 Compact | | |
      2. 9.1.2 Mid-Size | | |
      3. 9.1.3 Full-Size | |
    2. 9.2 By Fuel Type | | |
      1. 9.2.1 Petrol | | |
      2. 9.2.2 Diesel | | |
      3. 9.2.3 Hybrid | | |
      4. 9.2.4 Electric | |
    3. 9.3 By Drivetrain | | |
      1. 9.3.1 2WD | | |
      2. 9.3.2 4WD | | |
      3. 9.3.3 AWD | |
    4. 9.4 By End-User | | |
      1. 9.4.1 Personal Use | | |
      2. 9.4.2 Commercial Use | |
    5. 9.5 By Seating Capacity | | |
      1. 9.5.1 5-Seater | | |
      2. 9.5.2 7-Seater | |
  10. 10 Competitive Landscape | |
    1. 10.1 Market Concentration Analysis | |
    2. 10.2 Competitive Benchmarking Matrix | |
  11. 11 Recent News & Developments | |
  12. 12 Report Scope and Methodology | |
  13. 13 Detailed Sources and Citations | |
  14. 14 Frequently Asked Questions (FAQs) | | LIST OF TABLES | |
  15. TABLE 1 Global Market Snapshot – Study Period, Market Size, CAGR and Leading Regions | |
  16. TABLE 2 Global Market Size & Forecast, by Revenue (USD billion), 2021–2035 | |
  17. TABLE 3 Driver Impact Analysis on CAGR, 2026–2035 | |
  18. TABLE 4 Restraints Impact Analysis on CAGR, 2026–2035 | |
  19. TABLE 5 Regional Summary, 2025 | |
  20. TABLE 6 North America – Country-Level Analysis, 2025 | |
  21. TABLE 7 Europe – Country-Level Analysis, 2025 | |
  22. TABLE 8 Asia-Pacific – Country-Level Analysis, 2025 | |
  23. TABLE 9 South America – Country-Level Analysis, 2025 | |
  24. TABLE 10 Middle East and Africa – Country-Level Analysis, 2025 | |
  25. TABLE 11 Segmentation by Vehicle Size, 2025 | |
  26. TABLE 12 Segmentation by Fuel Type, 2025 | |
  27. TABLE 13 Segmentation by Drivetrain, 2025 | |
  28. TABLE 14 Segmentation by End-User, 2025 | |
  29. TABLE 15 Segmentation by Seating Capacity, 2025 | |
  30. TABLE 16 Competitive Benchmarking Matrix, 2025 | |
  31. TABLE 17 Report Scope and Methodology | |
  32. TABLE 18 Detailed Sources and Citations | |
  33. TABLE 19 Segmentation Quick Reference | | LIST OF FIGURES | |
  34. FIGURE 1 Market Dynamics Overview – Drivers, Restraints and Opportunities | |
  35. FIGURE 2 Industry Value Chain Analysis | |
  36. FIGURE 3 Porter's Five Forces Analysis | |
  37. FIGURE 4 Global Market Size Trend, 2021–2035 (USD billion) | |
  38. FIGURE 5 Year-over-Year Growth Trend, 2021–2035 | |
  39. FIGURE 6 Market Share by Vehicle Size, 2025 | |
  40. FIGURE 7 Market Share by Fuel Type, 2025 | |
  41. FIGURE 8 Market Share by Drivetrain, 2025 | |
  42. FIGURE 9 Market Share by End-User, 2025 | |
  43. FIGURE 10 Market Share by Seating Capacity, 2025 | |
  44. FIGURE 11 Regional Market Share, 2025 | |
  45. FIGURE 12 Asia-Pacific Country Share, 2025 | |
  46. FIGURE 13 North America Country Share, 2025 | |
  47. FIGURE 14 Competitive Landscape – Estimated Revenue Share Ranges, 2025 | |
  48. FIGURE 15 Recent Strategic Developments Timeline, 2023–2025

Segmentation Quick Reference

DimensionSub-SegmentsDominant SegmentFastest Growing Segment
By Vehicle SizeCompact, Mid-Size, Full-SizeCompact (46.0% share)Full-Size (10.5% CAGR)
By Fuel TypePetrol, Diesel, Hybrid, ElectricPetrol (55.4% share)Electric (19.1% CAGR)
By Drivetrain2WD, 4WD, AWD2WD (50.6% share)AWD (9.1% CAGR)
By End-UserPersonal Use, Commercial UsePersonal Use (78.9% share)Commercial Use (8.4% CAGR)
By Seating Capacity5-Seater, 7-Seater5-Seater (66.9% share)7-Seater (7.3% CAGR)
By RegionNorth America, Europe, Asia-Pacific, South America, Middle East and AfricaAsia-Pacific (45.8% share)Asia-Pacific (45.8% share)

Market Segmentation Overview

By Vehicle Size

Sub-SegmentKey Trend
CompactUrban buyers and tax brackets favor smaller footprints
Mid-SizeWheelbase stretching on modular platforms blurs size boundaries.
Full-SizePremium cabins and driver assistance lift per-unit margins.

Compact leads on volume because parking limits, congestion charges, and engine-size tax bands in Asia and Europe reward smaller footprints. Full-Size grows fastest, as North American and Gulf households pay for three-row space and luxury trims. Mid-Size sits between the two, gaining from platforms that stretch a compact base without new tooling.

By Fuel Type

Sub-SegmentKey Trend
PetrolStill the default where charging is scarce
DieselRetreating in Europe, holding in towing-heavy markets
HybridBridge technology with no charging dependence
ElectricFastest growth on subsidies and falling battery costs

Petrol leads because most emerging markets still lack reliable public charging. Electric grows fastest as battery pack prices fall and CO₂ rules in China, Europe, and the United States tighten. Hybrid fills the gap in between, while Diesel loses ground as European emissions limits and city restrictions bite.

By Drivetrain

Sub-SegmentKey Trend
2WDPrice and efficiency focus in emerging markets
4WDSteady demand for off-road and towing capability
AWDDual-motor electric layouts expand availability.

2WD leads because cost-conscious buyers in India, Southeast Asia, and Latin America prioritize price and fuel economy. AWD grows fastest since dual-motor battery-electric designs drive both axles with fewer mechanical parts than a transfer case. 4WD retains a loyal base in desert and rugged-terrain markets.

By End-User

Sub-SegmentKey Trend
Personal UseSeating position and cargo flexibility drive purchase
Commercial UseFleets value utilization and strong residuals

Personal Use dominates because private buyers prize elevated seating, versatility, and perceived safety. Commercial Use grows faster as ride-hailing and corporate shuttle operators adopt SUVs for passenger comfort and resale value. Lower running costs for battery-electric models are accelerating bulk fleet orders.

By Seating Capacity

Sub-SegmentKey Trend
5-SeaterBest balance of cargo space and urban maneuverability
7-SeaterMultigenerational travel and shuttle use lift demand.

5-Seater layouts lead because they combine generous cargo room with city-friendly dimensions and better fuel economy. 7-Seater models grow faster, helped by sliding second rows, power-assisted entry, and family-focused marketing. Manufacturers price seven-seat variants at a premium for their added utility.


Download PDF ×

We do not share your information with anyone. However, we may send you emails based on your report interest from time to time. You may contact us at any time to opt-out.