Market Segmentation Tab
Global Superalloys Market by Material Type Outlook (USD Million, 2019-2035)
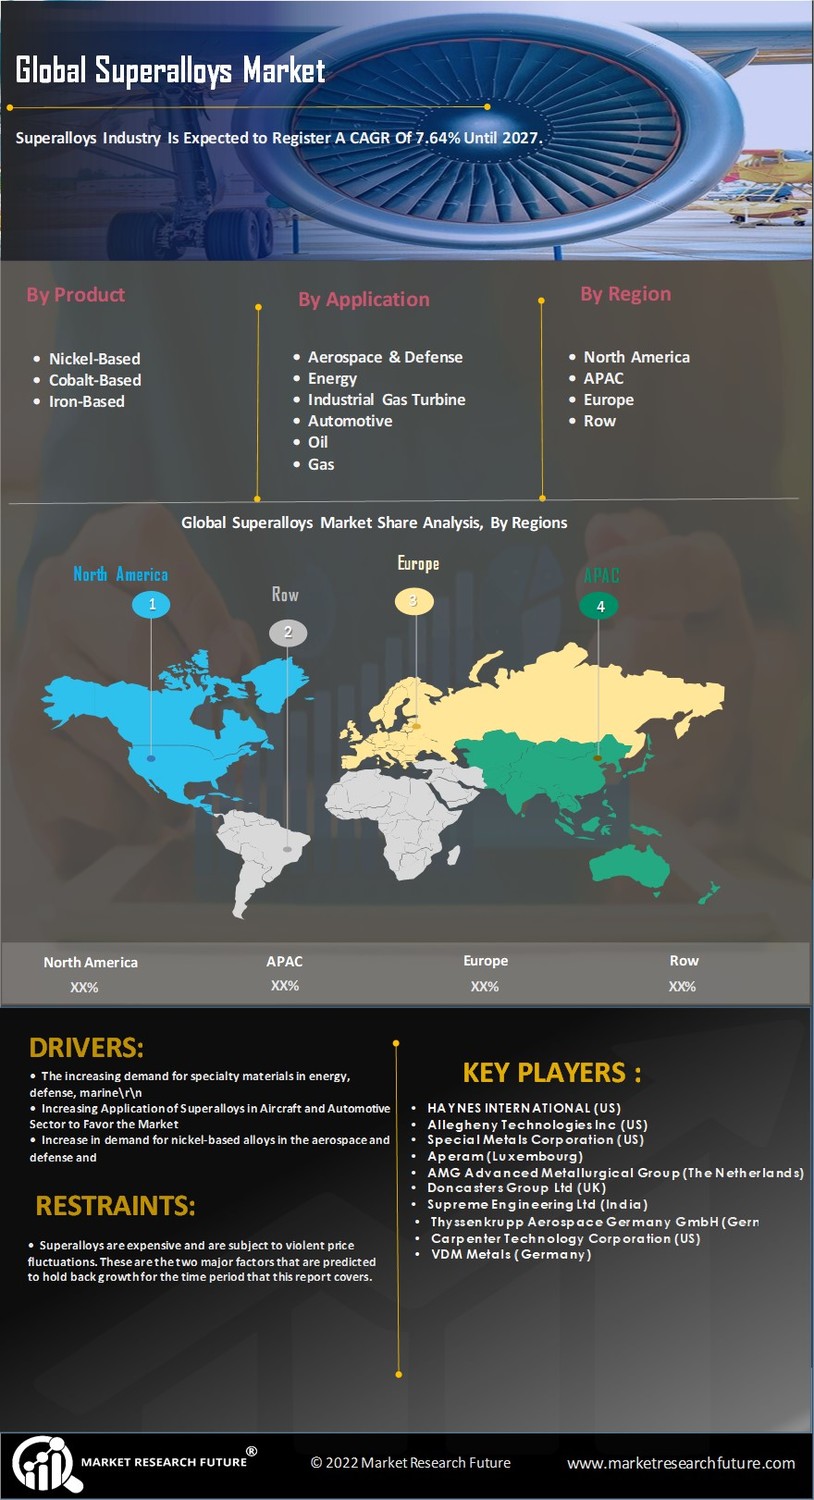
Nickel-Based
Iron-Based
Cobalt-Based
Global Superalloys Market by Product Form Outlook (USD Million, 2019-2035)
Cast Ingot
Wrought Superalloys
Powder Metallurgy (PM) Superalloys
Others
Global Superalloys Market by Application Outlook (USD Million, 2019-2035)
Automotive
Power Generation
Oil and Gas
Aerospace
Others
Superalloys Market Regional Outlook (USD Million, 2019-2035)
North America Outlook (USD Million, 2019-2035)
Nickel-Based
Iron-Based
Cobalt-Based
North America Superalloys Market by Product Form Outlook (USD Million, 2019-2035)
Cast Ingot
Wrought Superalloys
Powder Metallurgy (PM) Superalloys
Others
North America Superalloys Market by Application Outlook (USD Million, 2019-2035)
Automotive
Power Generation
Oil and Gas
Aerospace
Others
US Outlook (USD Million, 2019-2035)
Nickel-Based
Iron-Based
Cobalt-Based
US Superalloys Market by Product Form Outlook (USD Million, 2019-2035)
Cast Ingot
Wrought Superalloys
Powder Metallurgy (PM) Superalloys
Others
US Superalloys Market by Application Outlook (USD Million, 2019-2035)
Automotive
Power Generation
Oil and Gas
Aerospace
Others
Canada Outlook (USD Million, 2019-2035)
Canada Superalloys Market by Material Type Outlook (USD Million, 2019-2035)
Nickel-Based
Iron-Based
Cobalt-Based
Canada Superalloys Market by Product Form Outlook (USD Million, 2019-2035)
Cast Ingot
Wrought Superalloys
Powder Metallurgy (PM) Superalloys
Others
Canada Superalloys Market by Application Outlook (USD Million, 2019-2035)
Automotive
Power Generation
Oil and Gas
Aerospace
Others
Nickel-Based
Iron-Based
Cobalt-Based
Global Superalloys Market by Product Form Outlook (USD Million, 2019-2035)
Cast Ingot
Wrought Superalloys
Powder Metallurgy (PM) Superalloys
Others
Global Superalloys Market by Application Outlook (USD Million, 2019-2035)
Automotive
Power Generation
Oil and Gas
Aerospace
Others
GermanyOutlook (USD Million, 2019-2035)
Global Superalloys Market by Material Type Outlook (USD Million, 2019-2035)
Nickel-Based
Iron-Based
Cobalt-Based
Global Superalloys Market by Product Form Outlook (USD Million, 2019-2035)
Cast Ingot
Wrought Superalloys
Powder Metallurgy (PM) Superalloys
Others
Global Superalloys Market by Application Outlook (USD Million, 2019-2035)
Automotive
Power Generation
Oil and Gas
Aerospace
Others
UK Outlook (USD Million, 2019-2035)
UK Mass Spectrometry Software Market by Software Type Outlook (USD Million, 2019-2035)
Data Acquisition Software
Data Analysis Software
Visualization Software
Control Software
UK Mass Spectrometry Software Market Product by Application Outlook (USD Million, 2019-2035)
Superalloys Markets
Environmental Testing
Food and Beverage Testing
Clinical Research
Biotechnology
Others
UK Mass Spectrometry Software Market by Deployment Type Outlook (USD Million, 2019-2035)
On-Premises
Cloud-Based
Others
UK Mass Spectrometry Software Market by End-User Outlook (USD Million, 2019-2035)
Superalloys Market and Biotech Companies
Hospital and Clinics
Food and beverage Industry
Chemical Industry
Others
France Outlook (USD Million, 2019-2035)
France Mass Spectrometry Software Market by Software Type Outlook (USD Million, 2019-2035)
Data Acquisition Software
Data Analysis Software
Visualization Software
Control Software
France Mass Spectrometry Software Market Product by Application Outlook (USD Million, 2019-2035)
Superalloys Markets
Environmental Testing
Food and Beverage Testing
Clinical Research
Biotechnology
Others
France Mass Spectrometry Software Market by Deployment Type Outlook (USD Million, 2019-2035)
On-Premises
Cloud-Based
Others
France Mass Spectrometry Software Market by End-User Outlook (USD Million, 2019-2035)
Superalloys Market and Biotech Companies
Hospital and Clinics
Food and beverage Industry
Chemical Industry
Others
Russia Outlook (USD Million, 2019-2035)
Russia Mass Spectrometry Software Market by Software Type Outlook (USD Million, 2019-2035)
Data Acquisition Software
Data Analysis Software
Visualization Software
Control Software
Russia Mass Spectrometry Software Market Product by Application Outlook (USD Million, 2019-2035)
Superalloys Markets
Environmental Testing
Food and Beverage Testing
Clinical Research
Biotechnology
Others
Russia Mass Spectrometry Software Market by Deployment Type Outlook (USD Million, 2019-2035)
On-Premises
Cloud-Based
Others
Russia Mass Spectrometry Software Market by End-User Outlook (USD Million, 2019-2035)
Superalloys Market and Biotech Companies
Hospital and Clinics
Food and beverage Industry
Chemical Industry
Others
Italy Outlook (USD Million, 2019-2035)
Italy Mass Spectrometry Software Market by Software Type Outlook (USD Million, 2019-2035)
Data Acquisition Software
Data Analysis Software
Visualization Software
Control Software
Italy Mass Spectrometry Software Market Product by Application Outlook (USD Million, 2019-2035)
Superalloys Markets
Environmental Testing
Food and Beverage Testing
Clinical Research
Biotechnology
Others
Italy Mass Spectrometry Software Market by Deployment Type Outlook (USD Million, 2019-2035)
On-Premises
Cloud-Based
Others
Italy Mass Spectrometry Software Market by End-User Outlook (USD Million, 2019-2035)
Superalloys Market and Biotech Companies
Hospital and Clinics
Food and beverage Industry
Chemical Industry
Others
Spain Outlook (USD Million, 2019-2035)
Data Acquisition Software
Data Analysis Software
Visualization Software
Control Software
Spain Mass Spectrometry Software Market Product by Application Outlook (USD Million, 2019-2035)
Superalloys Markets
Environmental Testing
Food and Beverage Testing
Clinical Research
Biotechnology
Others
Spain Mass Spectrometry Software Market by Deployment Type Outlook (USD Million, 2019-2035)
On-Premises
Cloud-Based
Others
Spain Mass Spectrometry Software Market by End-User Outlook (USD Million, 2019-2035)
Superalloys Market and Biotech Companies
Hospital and Clinics
Food and beverage Industry
Chemical Industry
Others
Rest Of Europe Outlook (USD Million, 2019-2035)
Rest Of Europe Mass Spectrometry Software Market by Software Type Outlook (USD Million, 2019-2035)
Data Acquisition Software
Data Analysis Software
Visualization Software
Control Software
Rest Of Europe Mass Spectrometry Software Market Product by Application Outlook (USD Million, 2019-2035)
Superalloys Markets
Environmental Testing
Food and Beverage Testing
Clinical Research
Biotechnology
Others
Rest Of Europe Mass Spectrometry Software Market by Deployment Type Outlook (USD Million, 2019-2035)
On-Premises
Cloud-Based
Others
Rest Of Europe Mass Spectrometry Software Market by End-User Outlook (USD Million, 2019-2035)
Superalloys Market and Biotech Companies
Hospital and Clinics
Food and beverage Industry
Chemical Industry
Others
Asia-Pacific Outlook (USD Million, 2019-2035)
Asia-Pacific Mass Spectrometry Software Market by Software Type Outlook (USD Million, 2019-2035)
Data Acquisition Software
Data Analysis Software
Visualization Software
Control Software
Asia-Pacific Mass Spectrometry Software Market Product by Application Outlook (USD Million, 2019-2035)
Superalloys Markets
Environmental Testing
Food and Beverage Testing
Clinical Research
Biotechnology
Others
Asia-Pacific Mass Spectrometry Software Market by Deployment Type Outlook (USD Million, 2019-2035)
On-Premises
Cloud-Based
Others
North America Mass Spectrometry Software Market by End-User Outlook (USD Million, 2019-2035)
Superalloys Market and Biotech Companies
Hospital and Clinics
Food and beverage Industry
Chemical Industry
Others
China Outlook (USD Million, 2019-2035)
China Mass Spectrometry Software Market by Software Type Outlook (USD Million, 2019-2035)
Data Acquisition Software
Data Analysis Software
Visualization Software
Control Software
China Mass Spectrometry Software Market Product by Application Outlook (USD Million, 2019-2035)
Superalloys Markets
Environmental Testing
Food and Beverage Testing
Clinical Research
Biotechnology
Others
China Mass Spectrometry Software Market by Deployment Type Outlook (USD Million, 2019-2035)
On-Premises
Cloud-Based
Others
China Mass Spectrometry Software Market by End-User Outlook (USD Million, 2019-2035)
Superalloys Market and Biotech Companies
Hospital and Clinics
Food and beverage Industry
Chemical Industry
Others
India Outlook (USD Million, 2019-2035)
India Mass Spectrometry Software Market by Software Type Outlook (USD Million, 2019-2035)
Data Acquisition Software
Data Analysis Software
Visualization Software
Control Software
India Mass Spectrometry Software Market Product by Application Outlook (USD Million, 2019-2035)
Superalloys Markets
Environmental Testing
Food and Beverage Testing
Clinical Research
Biotechnology
Others
India Mass Spectrometry Software Market by Deployment Type Outlook (USD Million, 2019-2035)
On-Premises
Cloud-Based
Others
India Mass Spectrometry Software Market by End-User Outlook (USD Million, 2019-2035)
Superalloys Market and Biotech Companies
Hospital and Clinics
Food and beverage Industry
Chemical Industry
Others
Japan Outlook (USD Million, 2019-2035)
Japan Mass Spectrometry Software Market by Software Type Outlook (USD Million, 2019-2035)
Data Acquisition Software
Data Analysis Software
Visualization Software
Control Software
Japan Mass Spectrometry Software Market Product by Application Outlook (USD Million, 2019-2035)
Superalloys Markets
Environmental Testing
Food and Beverage Testing
Clinical Research
Biotechnology
Others
Japan Mass Spectrometry Software Market by Deployment Type Outlook (USD Million, 2019-2035)
On-Premises
Cloud-Based
Others
Japan Mass Spectrometry Software Market by End-User Outlook (USD Million, 2019-2035)
Superalloys Market and Biotech Companies
Hospital and Clinics
Food and beverage Industry
Chemical Industry
Others
South Korea Outlook (USD Million, 2019-2035)
South Korea Mass Spectrometry Software Market by Software Type Outlook (USD Million, 2019-2035)
Data Acquisition Software
Data Analysis Software
Visualization Software
Control Software
South Korea Mass Spectrometry Software Market Product by Application Outlook (USD Million, 2019-2035)
Superalloys Markets
Environmental Testing
Food and Beverage Testing
Clinical Research
Biotechnology
Others
South Korea Mass Spectrometry Software Market by Deployment Type Outlook (USD Million, 2019-2035)
On-Premises
Cloud-Based
Others
South Korea Mass Spectrometry Software Market by End-User Outlook (USD Million, 2019-2035)
Superalloys Market and Biotech Companies
Hospital and Clinics
Food and beverage Industry
Chemical Industry
Others
Rest of Asia-Pacific Outlook (USD Million, 2019-2035)
Rest of Asia-Pacific Mass Spectrometry Software Market by Software Type Outlook (USD Million, 2019-2035)
Data Acquisition Software
Data Analysis Software
Visualization Software
Control Software
Rest of Asia-Pacific Mass Spectrometry Software Market Product by Application Outlook (USD Million, 2019-2035)
Superalloys Markets
Environmental Testing
Food and Beverage Testing
Clinical Research
Biotechnology
Others
Rest of Asia-Pacific Mass Spectrometry Software Market by Deployment Type Outlook (USD Million, 2019-2035)
On-Premises
Cloud-Based
Others
Rest of Asia-Pacific Mass Spectrometry Software Market by End-User Outlook (USD Million, 2019-2035)
Superalloys Market and Biotech Companies
Hospital and Clinics
Food and beverage Industry
Chemical Industry
Others
South America Outlook (USD Million, 2019-2035)
Data Acquisition Software
Data Analysis Software
Visualization Software
Control Software
South America Mass Spectrometry Software Market Product by Application Outlook (USD Million, 2019-2035)
Superalloys Markets
Environmental Testing
Food and Beverage Testing
Clinical Research
Biotechnology
Others
South America Mass Spectrometry Software Market by Deployment Type Outlook (USD Million, 2019-2035)
On-Premises
Cloud-Based
Others
South America Mass Spectrometry Software Market by End-User Outlook (USD Million, 2019-2035)
Superalloys Market and Biotech Companies
Hospital and Clinics
Food and beverage Industry
Chemical Industry
Others
Brazil Outlook (USD Million, 2019-2035)
Brazil Mass Spectrometry Software Market by Software Type Outlook (USD Million, 2019-2035)
Data Acquisition Software
Data Analysis Software
Visualization Software
Control Software
Brazil Mass Spectrometry Software Market Product by Application Outlook (USD Million, 2019-2035)
Superalloys Markets
Environmental Testing
Food and Beverage Testing
Clinical Research
Biotechnology
Others
Brazil Mass Spectrometry Software Market by Deployment Type Outlook (USD Million, 2019-2035)
On-Premises
Cloud-Based
Others
Brazil Mass Spectrometry Software Market by End-User Outlook (USD Million, 2019-2035)
Superalloys Market and Biotech Companies
Hospital and Clinics
Food and beverage Industry
Chemical Industry
Others
Mexico Outlook (USD Million, 2019-2035)
Mexico Mass Spectrometry Software Market by Software Type Outlook (USD Million, 2019-2035)
Data Acquisition Software
Data Analysis Software
Visualization Software
Control Software
Mexico Mass Spectrometry Software Market Product by Application Outlook (USD Million, 2019-2035)
Superalloys Markets
Environmental Testing
Food and Beverage Testing
Clinical Research
Biotechnology
Others
Mexico Mass Spectrometry Software Market by Deployment Type Outlook (USD Million, 2019-2035)
On-Premises
Cloud-Based
Others
Mexico Mass Spectrometry Software Market by End-User Outlook (USD Million, 2019-2035)
Superalloys Market and Biotech Companies
Hospital and Clinics
Food and beverage Industry
Chemical Industry
Others
Argentina Outlook (USD Million, 2019-2035)
Argentina Mass Spectrometry Software Market by Software Type Outlook (USD Million, 2019-2035)
Data Acquisition Software
Data Analysis Software
Visualization Software
Control Software
Argentina Mass Spectrometry Software Market Product by Application Outlook (USD Million, 2019-2035)
Superalloys Markets
Environmental Testing
Food and Beverage Testing
Clinical Research
Biotechnology
Others
Argentina Mass Spectrometry Software Market by Deployment Type Outlook (USD Million, 2019-2035)
On-Premises
Cloud-Based
Others
Argentina Mass Spectrometry Software Market by End-User Outlook (USD Million, 2019-2035)
Superalloys Market and Biotech Companies
Hospital and Clinics
Food and beverage Industry
Chemical Industry
Others
Rest of South America Outlook (USD Million, 2019-2035)
Rest of South America Mass Spectrometry Software Market by Software Type Outlook (USD Million, 2019-2035)
Data Acquisition Software
Data Analysis Software
Visualization Software
Control Software
Rest of South America Mass Spectrometry Software Market Product by Application Outlook (USD Million, 2019-2035)
Superalloys Markets
Environmental Testing
Food and Beverage Testing
Clinical Research
Biotechnology
Others
Rest of South America Mass Spectrometry Software Market by Deployment Type Outlook (USD Million, 2019-2035)
On-Premises
Cloud-Based
Others
Rest of South America Mass Spectrometry Software Market by End-User Outlook (USD Million, 2019-2035)
Superalloys Market and Biotech Companies
Hospital and Clinics
Food and beverage Industry
Chemical Industry
Others
Middle East & Africa Outlook (USD Million, 2019-2035)
Middle East & Africa Mass Spectrometry Software Market by Software Type Outlook (USD Million, 2019-2035)
Data Acquisition Software
Data Analysis Software
Visualization Software
Control Software
Middle East & Africa Mass Spectrometry Software Market Product by Application Outlook (USD Million, 2019-2035)
Superalloys Markets
Environmental Testing
Food and Beverage Testing
Clinical Research
Biotechnology
Others
Middle East & Africa Mass Spectrometry Software Market by Deployment Type Outlook (USD Million, 2019-2035)
On-Premises
Cloud-Based
Others
Middle East & Africa Mass Spectrometry Software Market by End-User Outlook (USD Million, 2019-2035)
Superalloys Market and Biotech Companies
Hospital and Clinics
Food and beverage Industry
Chemical Industry
Others
GCC Countries Outlook (USD Million, 2019-2035)
GCC Countries Superalloys Market by Material Type Outlook (USD Million, 2019-2035)
Nickel-Based
Iron-Based
Cobalt-Based
GCC Countries Superalloys Market by Product Form Outlook (USD Million, 2019-2035)
Cast Ingot
Wrought Superalloys
Powder Metallurgy (PM) Superalloys
Others
GCC Countries Superalloys Market by Application Outlook (USD Million, 2019-2035)
Automotive
Power Generation
Oil and Gas
Aerospace
Others
South Africa Outlook (USD Million, 2019-2035)
South Africa Superalloys Market by Material Type Outlook (USD Million, 2019-2035)
Nickel-Based
Iron-Based
Cobalt-Based
South Africa Superalloys Market by Product Form Outlook (USD Million, 2019-2035)
Cast Ingot
Wrought Superalloys
Powder Metallurgy (PM) Superalloys
Others
South Africa Superalloys Market by Application Outlook (USD Million, 2019-2035)
Automotive
Power Generation
Oil and Gas
Aerospace
Others
Rest of Middle East & Africa Outlook (USD Million, 2019-2035)
Rest of Middle East & Africa Superalloys Market by Material Type Outlook (USD Million, 2019-2035)
Nickel-Based
Iron-Based
Cobalt-Based
Rest of Middle East & Africa Superalloys Market by Product Form Outlook (USD Million, 2019-2035)
Cast Ingot
Wrought Superalloys
Powder Metallurgy (PM) Superalloys
Others
Rest of Middle East & Africa Superalloys Market by Application Outlook (USD Million, 2019-2035)
Automotive
Power Generation
Oil and Gas
Aerospace
Others