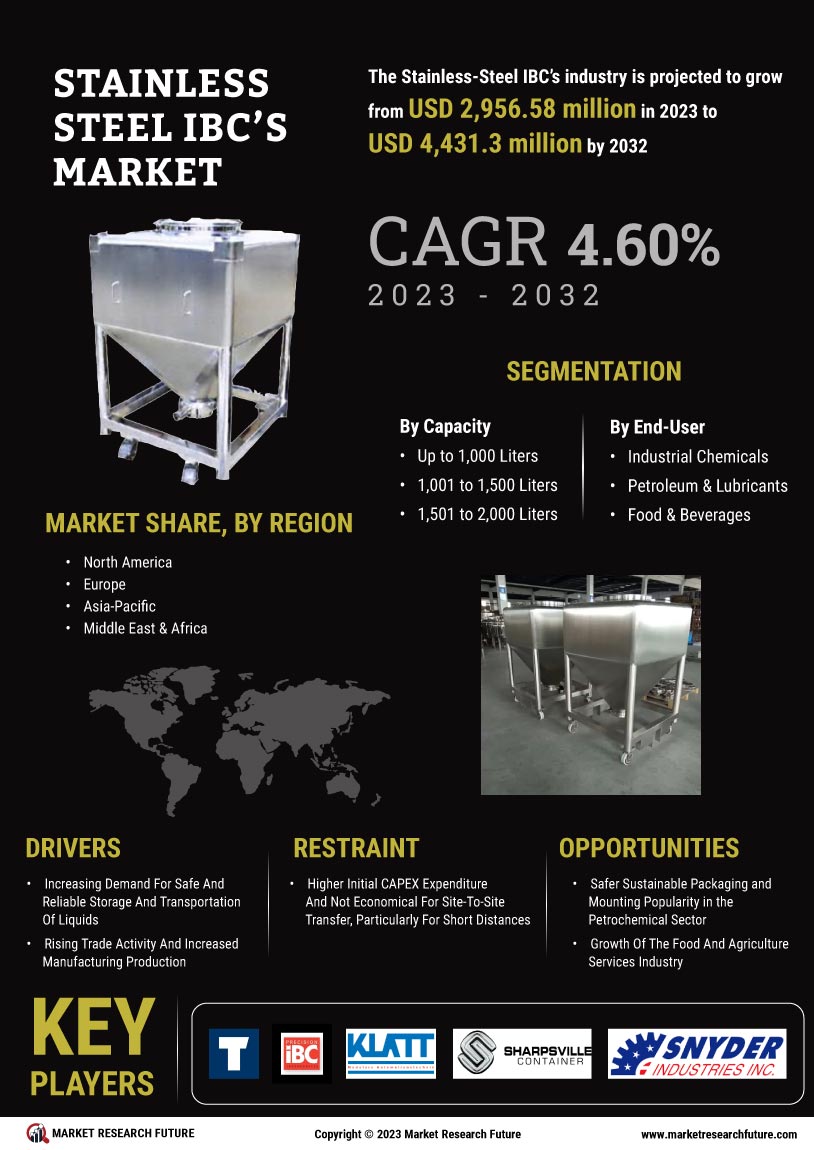
info@marketresearchfuture.com   📞  +1 (855) 661-4441(US)   📞  +44 1720 412 167(UK)
Certified Global Research Member
Isomar fd.webp Wcrc 57.webp
Key Questions Answered
  • Global Market Outlook
  • In-depth analysis of global and regional trends
  • Analyze and identify the major players in the market, their market share, key developments, etc.
  • To understand the capability of the major players based on products offered, financials, and strategies.
  • Identify disrupting products, companies, and trends.
  • To identify opportunities in the market.
  • Analyze the key challenges in the market.
  • Analyze the regional penetration of players, products, and services in the market.
  • Comparison of major players’ financial performance.
  • Evaluate strategies adopted by major players.
  • Recommendations
Why Choose Market Research Future?
  • Vigorous research methodologies for specific market.
  • Knowledge partners across the globe
  • Large network of partner consultants.
  • Ever-increasing/ Escalating data base with quarterly monitoring of various markets
  • Trusted by fortune 500 companies/startups/ universities/organizations
  • Large database of 5000+ markets reports.
  • Effective and prompt pre- and post-sales support.

Stainless Steel IBC’s Market Research Report Information by Capacity (Up to 1,000 Ltrs, 1,001 to 1,500 Ltrs, 1,501 to 2,000 Ltrs and Above 2,000 Ltrs), By End-user (Industrial Chemicals, Petroleum & Lubricants, Food & Beverages, Construction, Pharmaceutical, and Others), And by Region (North America, South America, Europe, Asia Pacific, And Middle East & Africa) –Market Forecast Till 2032


ID: MRFR/PNT/10626-CR | 101 Pages | Author: Snehal Singh| August 2023

Stainless-Steel IBC Market Segmentation


Stainless-Steel IBC Capacity Outlook (USD Million, 2018-2032)


  • Up to 1,000 Liters

  • 1,001 to 1,500 Liters

  • 1,501 to 2,000 Liters

  • Above 2,000 Liters


Stainless-Steel IBC End-User Outlook (USD Million, 2018-2032)


  • Industrial Chemicals

  • Petroleum & Lubricants

  • Food & Beverages

  • Construction

  • Pharmaceutical

  • Others


Stainless-Steel IBC Regional Outlook (USD Million, 2018-2032)


  • North America Outlook (USD Million, 2018-2032)


    • North America Stainless-Steel IBC by Capacity

      • Up to 1,000 Liters

      • 1,001 to 1,500 Liters

      • 1,501 to 2,000 Liters

      • Above 2,000 Liters


    • North America Stainless-Steel IBC by End-User

      • Industrial Chemicals

      • Petroleum & Lubricants

      • Food & Beverages

      • Construction

      • Pharmaceutical

      • Others


    • US Outlook (USD Million, 2018-2032)


    • US Stainless-Steel IBC by Capacity

      • Up to 1,000 Liters

      • 1,001 to 1,500 Liters

      • 1,501 to 2,000 Liters

      • Above 2,000 Liters


    • US Stainless-Steel IBC by End-User

      • Industrial Chemicals

      • Petroleum & Lubricants

      • Food & Beverages

      • Construction

      • Pharmaceutical

      • Others


    • CANADA Outlook (USD Million, 2018-2032)


    • CANADA Stainless-Steel IBC by Capacity

      • Up to 1,000 Liters

      • 1,001 to 1,500 Liters

      • 1,501 to 2,000 Liters

      • Above 2,000 Liters


    • CANADA Stainless-Steel IBC by End-User

      • Industrial Chemicals

      • Petroleum & Lubricants

      • Food & Beverages

      • Construction

      • Pharmaceutical

      • Others


    • MEXICO Outlook (USD Million, 2018-2032)


    • MEXICO Stainless-Steel IBC by Capacity

      • Up to 1,000 Liters

      • 1,001 to 1,500 Liters

      • 1,501 to 2,000 Liters

      • Above 2,000 Liters


    • MEXICO Stainless-Steel IBC by End-User

      • Industrial Chemicals

      • Petroleum & Lubricants

      • Food & Beverages

      • Construction

      • Pharmaceutical

      • Others


    • South America Outlook (USD Million, 2018-2032)


      • South America Stainless-Steel IBC by Capacity

        • Up to 1,000 Liters

        • 1,001 to 1,500 Liters

        • 1,501 to 2,000 Liters

        • Above 2,000 Liters


      • South America Stainless-Steel IBC by End-User

        • Industrial Chemicals

        • Petroleum & Lubricants

        • Food & Beverages

        • Construction

        • Pharmaceutical

        • Others


      • Brazil Outlook (USD Million, 2018-2032)


      • Brazil Stainless-Steel IBC by Capacity

        • Up to 1,000 Liters

        • 1,001 to 1,500 Liters

        • 1,501 to 2,000 Liters

        • Above 2,000 Liters


      • Brazil Stainless-Steel IBC by End-User

        • Industrial Chemicals

        • Petroleum & Lubricants

        • Food & Beverages

        • Construction

        • Pharmaceutical

        • Others


      • Argentina Outlook (USD Million, 2018-2032)


      • Argentina Stainless-Steel IBC by Capacity

        • Up to 1,000 Liters

        • 1,001 to 1,500 Liters

        • 1,501 to 2,000 Liters

        • Above 2,000 Liters


      • Argentina Stainless-Steel IBC by End-User

        • Industrial Chemicals

        • Petroleum & Lubricants

        • Food & Beverages

        • Construction

        • Pharmaceutical

        • Others


      • Rest of South America Outlook (USD Million, 2018-2032)


      • Rest of South America Stainless-Steel IBC by Capacity

        • Up to 1,000 Liters

        • 1,001 to 1,500 Liters

        • 1,501 to 2,000 Liters

        • Above 2,000 Liters


      • Rest of South America Stainless-Steel IBC by End-User

        • Industrial Chemicals

        • Petroleum & Lubricants

        • Food & Beverages

        • Construction

        • Pharmaceutical

        • Others


      • Europe Outlook (USD Million, 2018-2032)


        • Europe Stainless-Steel IBC by Capacity

          • Up to 1,000 Liters

          • 1,001 to 1,500 Liters

          • 1,501 to 2,000 Liters

          • Above 2,000 Liters


        • Europe Stainless-Steel IBC by End-User

          • Industrial Chemicals

          • Petroleum & Lubricants

          • Food & Beverages

          • Construction

          • Pharmaceutical

          • Others


        • Germany Outlook (USD Million, 2018-2032)


        • Germany Stainless-Steel IBC by Capacity

          • Up to 1,000 Liters

          • 1,001 to 1,500 Liters

          • 1,501 to 2,000 Liters

          • Above 2,000 Liters


        • Germany Stainless-Steel IBC by End-User

          • Industrial Chemicals

          • Petroleum & Lubricants

          • Food & Beverages

          • Construction

          • Pharmaceutical

          • Others


        • France Outlook (USD Million, 2018-2032)


        • France Stainless-Steel IBC by Capacity

          • Up to 1,000 Liters

          • 1,001 to 1,500 Liters

          • 1,501 to 2,000 Liters

          • Above 2,000 Liters


        • France Stainless-Steel IBC by End-User

          • Industrial Chemicals

          • Petroleum & Lubricants

          • Food & Beverages

          • Construction

          • Pharmaceutical

          • Others


        • UK Outlook (USD Million, 2018-2032)


        • UK Stainless-Steel IBC by Capacity

          • Up to 1,000 Liters

          • 1,001 to 1,500 Liters

          • 1,501 to 2,000 Liters

          • Above 2,000 Liters


        • UK Stainless-Steel IBC by End-User

          • Industrial Chemicals

          • Petroleum & Lubricants

          • Food & Beverages

          • Construction

          • Pharmaceutical

          • Others


        • Italy Outlook (USD Million, 2018-2032)


        • Italy Stainless-Steel IBC by Capacity

          • Up to 1,000 Liters

          • 1,001 to 1,500 Liters

          • 1,501 to 2,000 Liters

          • Above 2,000 Liters


        • Italy Stainless-Steel IBC by End-User

          • Industrial Chemicals

          • Petroleum & Lubricants

          • Food & Beverages

          • Construction

          • Pharmaceutical

          • Others


        • Spain Outlook (USD Million, 2018-2032)


        • Spain Stainless-Steel IBC by Capacity

          • Up to 1,000 Liters

          • 1,001 to 1,500 Liters

          • 1,501 to 2,000 Liters

          • Above 2,000 Liters


        • Spain Stainless-Steel IBC by End-User

          • Industrial Chemicals

          • Petroleum & Lubricants

          • Food & Beverages

          • Construction

          • Pharmaceutical

          • Others


        • Rest of Europe Outlook (USD Million, 2018-2032)


        • Rest of Europe Stainless-Steel IBC by Capacity

          • Up to 1,000 Liters

          • 1,001 to 1,500 Liters

          • 1,501 to 2,000 Liters

          • Above 2,000 Liters


        • Rest of Europe Stainless-Steel IBC by End-User

          • Industrial Chemicals

          • Petroleum & Lubricants

          • Food & Beverages

          • Construction

          • Pharmaceutical

          • Others


        • Asia Pacific Outlook (USD Million, 2018-2032)


          • Asia Pacific Stainless-Steel IBC by Capacity

            • Up to 1,000 Liters

            • 1,001 to 1,500 Liters

            • 1,501 to 2,000 Liters

            • Above 2,000 Liters


          • Asia Pacific Stainless-Steel IBC by End-User

            • Industrial Chemicals

            • Petroleum & Lubricants

            • Food & Beverages

            • Construction

            • Pharmaceutical

            • Others


          • China Outlook (USD Million, 2018-2032)


          • China Stainless-Steel IBC by Capacity

            • Up to 1,000 Liters

            • 1,001 to 1,500 Liters

            • 1,501 to 2,000 Liters

            • Above 2,000 Liters


          • China Stainless-Steel IBC by End-User

            • Industrial Chemicals

            • Petroleum & Lubricants

            • Food & Beverages

            • Construction

            • Pharmaceutical

            • Others


          • India Outlook (USD Million, 2018-2032)


          • India Stainless-Steel IBC by Capacity

            • Up to 1,000 Liters

            • 1,001 to 1,500 Liters

            • 1,501 to 2,000 Liters

            • Above 2,000 Liters


          • India Stainless-Steel IBC by End-User

            • Industrial Chemicals

            • Petroleum & Lubricants

            • Food & Beverages

            • Construction

            • Pharmaceutical

            • Others


          • Japan Outlook (USD Million, 2018-2032)


          • Japan Stainless-Steel IBC by Capacity

            • Up to 1,000 Liters

            • 1,001 to 1,500 Liters

            • 1,501 to 2,000 Liters

            • Above 2,000 Liters


          • Japan Stainless-Steel IBC by End-User

            • Industrial Chemicals

            • Petroleum & Lubricants

            • Food & Beverages

            • Construction

            • Pharmaceutical

            • Others


          • Australia Outlook (USD Million, 2018-2032)


          • Australia Stainless-Steel IBC by Capacity

            • Up to 1,000 Liters

            • 1,001 to 1,500 Liters

            • 1,501 to 2,000 Liters

            • Above 2,000 Liters


          • Australia Stainless-Steel IBC by End-User

            • Industrial Chemicals

            • Petroleum & Lubricants

            • Food & Beverages

            • Construction

            • Pharmaceutical

            • Others


          • Southeast Asia Outlook (USD Million, 2018-2032)


          • Southeast Asia Stainless-Steel IBC by Capacity

            • Up to 1,000 Liters

            • 1,001 to 1,500 Liters

            • 1,501 to 2,000 Liters

            • Above 2,000 Liters


          • Southeast Asia Stainless-Steel IBC by End-User

            • Industrial Chemicals

            • Petroleum & Lubricants

            • Food & Beverages

            • Construction

            • Pharmaceutical

            • Others


          • Rest of APAC Outlook (USD Million, 2018-2032)


          • Rest of APAC Stainless-Steel IBC by Capacity

            • Up to 1,000 Liters

            • 1,001 to 1,500 Liters

            • 1,501 to 2,000 Liters

            • Above 2,000 Liters


          • Rest of APAC Stainless-Steel IBC by End-User

            • Industrial Chemicals

            • Petroleum & Lubricants

            • Food & Beverages

            • Construction

            • Pharmaceutical

            • Others


          • Middle East and Africa Outlook (USD Million, 2018-2032)


            • Middle East and Africa Stainless-Steel IBC by Capacity

              • Up to 1,000 Liters

              • 1,001 to 1,500 Liters

              • 1,501 to 2,000 Liters

              • Above 2,000 Liters


            • Middle East and Africa Stainless-Steel IBC by End-User

              • Industrial Chemicals

              • Petroleum & Lubricants

              • Food & Beverages

              • Construction

              • Pharmaceutical

              • Others


            • Saudi Arabia Outlook (USD Million, 2018-2032)


            • Saudi Arabia Stainless-Steel IBC by Capacity

              • Up to 1,000 Liters

              • 1,001 to 1,500 Liters

              • 1,501 to 2,000 Liters

              • Above 2,000 Liters


            • Saudi Arabia Stainless-Steel IBC by End-User

              • Industrial Chemicals

              • Petroleum & Lubricants

              • Food & Beverages

              • Construction

              • Pharmaceutical

              • Others


            • UAE Outlook (USD Million, 2018-2032)


            • UAE Stainless-Steel IBC by Capacity

              • Up to 1,000 Liters

              • 1,001 to 1,500 Liters

              • 1,501 to 2,000 Liters

              • Above 2,000 Liters


            • UAE Stainless-Steel IBC by End-User

              • Industrial Chemicals

              • Petroleum & Lubricants

              • Food & Beverages

              • Construction

              • Pharmaceutical

              • Others


            • South Africa Outlook (USD Million, 2018-2032)


            • South Africa Stainless-Steel IBC by Capacity

              • Up to 1,000 Liters

              • 1,001 to 1,500 Liters

              • 1,501 to 2,000 Liters

              • Above 2,000 Liters


            • South Africa Stainless-Steel IBC by End-User

              • Industrial Chemicals

              • Petroleum & Lubricants

              • Food & Beverages

              • Construction

              • Pharmaceutical

              • Others


            • Egypt Outlook (USD Million, 2018-2032)


            • Egypt Stainless-Steel IBC by Capacity

              • Up to 1,000 Liters

              • 1,001 to 1,500 Liters

              • 1,501 to 2,000 Liters

              • Above 2,000 Liters


            • Egypt Stainless-Steel IBC by End-User

              • Industrial Chemicals

              • Petroleum & Lubricants

              • Food & Beverages

              • Construction

              • Pharmaceutical

              • Others


            • Rest of MEA Outlook (USD Million, 2018-2032)


            • Rest of MEA Stainless-Steel IBC by Capacity

              • Up to 1,000 Liters

              • 1,001 to 1,500 Liters

              • 1,501 to 2,000 Liters

              • Above 2,000 Liters


            • Rest of MEA Stainless-Steel IBC by End-User

              • Industrial Chemicals

              • Petroleum & Lubricants

              • Food & Beverages

              • Construction

              • Pharmaceutical

              • Others


Leading companies partner with us for data-driven Insights
client_1 client_2 client_3 client_4 client_5 client_6 client_7 client_8 client_9 client_10
Please fill in Business Email for Quick Response

TABLE OF CONTENTS

1. EXECUTIVE SUMMARY

1.1. Market Attractiveness Analysis

1.1.1. Global Stainless-Steel IBC Market, by Capacity

1.1.2. Global Stainless-Steel IBC Market, by End-user

1.1.3. Global Stainless-Steel IBC Market, by region.

2. MARKET INTRODUCTION

2.1. Definition

2.2. Scope of the Study

2.3. Market Structure

2.4. Key Buying Criteria

2.5. Macro Factor Analysis

3. RESEARCH METHODOLOGY

3.1. Research Process

3.2. Primary Research

3.3. Secondary Research

3.4. Market Size Estimation

3.5. Forecast Model

3.6. List of Assumptions

4. MARKET DYNAMICS

4.1. Introduction

4.2. Drivers

4.2.1. Increasing demand for safe and reliable storage and transportation of liquids

4.2.2. Rising trade activity and increased manufacturing production

4.2.3. Drivers impact analysis

4.3. Restraints

4.3.1. Higher initial CAPEX expenditure and not economical for site-to-site transfer, particularly for short distances

4.4. Opportunities

4.4.1. Safer Sustainable Packaging and Mounting Popularity in the Petrochemical Sector

4.4.2. Growth of the food and agriculture services industry

4.5. Covid 19 Impact Analysis

4.5.1. Impact on Global Stainless-Steel IBC market

4.5.1.1. Economic Impact

4.5.2. Impact on Supply Chain of global Stainless-Steel IBC

4.5.2.1. Price Variation of Key Raw Materials

4.5.2.2. Production Shutdown

4.5.2.3. Cash Flow Constraints

4.5.2.4. Impact on Import/Export

4.5.3. Impact on Market Demand

4.5.3.1. Impact due to restrictions/lockdown

4.5.3.2. Consumer Sentiments

4.5.4. Impact on Pricing of global Stainless-Steel IBC.

5. MARKET FACTOR ANALYSIS

5.1. Value Chain Analysis/Supply Chain Analysis

5.1.1. Raw material supply

5.1.2. Manufacture & Assembly

5.1.3. Supply & distribution

5.1.4. End user

5.1.5. After sale services

5.2. Porter’s Five Forces Model

5.2.1. Bargaining Power of Suppliers

5.2.2. Bargaining Power of Buyers

5.2.3. Threat of New Entrants

5.2.4. Threat of Substitutes

5.2.5. Intensity of Rivalry

5.3. Regulatory Framework

6. GLOBAL STAINLESS-STEEL IBC MARKET ESTIMATES & FORECAST, BY CAPACITY

6.1. Introduction

6.2. Up to 1,000 Liters

6.3. 1,001 to 1,500 Liters

6.4. 1,501 to 2,000 Liters

6.5. Above 2,000 Liters

7. GLOBAL STAINLESS-STEEL IBC MARKET ESTIMATES & FORECAST, BY END-USER

7.1. Introduction

7.2. Industrial Chemicals

7.3. Petroleum & Lubricants

7.4. Food & Beverages

7.5. Construction

7.6. Pharmaceutical

7.7. Others

8. GLOBAL STAINLESS-STEEL IBC MARKET ESTIMATES & FORECAST, BY REGION

8.1. Introduction

8.2. North America

8.2.1. North America Global Stainless-Steel IBC by Capacity (USD Million, 2018 -2032)

8.2.2. North America Global Stainless-Steel IBC by End-User (USD Million, 2018 -2032)

8.2.3. US

8.2.3.1. US Global Stainless-Steel IBC by Capacity (USD Million, 2018 -2032)

8.2.3.2. US Global Stainless-Steel IBC by End-User (USD Million, 2018 -2032)

8.2.4. Canada

8.2.4.1. Canada Global Stainless-Steel IBC by Capacity (USD Million, 2018 -2032)

8.2.4.2. Canada Global Stainless-Steel IBC by End-User (USD Million, 2018 -2032)

8.2.5. Mexico

8.2.5.1. Mexico Global Stainless-Steel IBC by Capacity (USD Million, 2018 -2032)

8.2.5.2. Mexico Global Stainless-Steel IBC by End-User (USD Million, 2018 -2032)

8.3. Europe

8.3.1. Europe Global Stainless-Steel IBC by Capacity (USD Million, 2018 -2032)

8.3.2. Europe Global Stainless-Steel IBC by End-User (USD Million, 2018 -2032)

8.3.3. Germany

8.3.3.1. Germany Global Stainless-Steel IBC by Capacity (USD Million, 2018 -2032)

8.3.3.2. Germany Global Stainless-Steel IBC by End-User (USD Million, 2018 -2032)

8.3.4. France

8.3.4.1. France Global Stainless-Steel IBC by Capacity (USD Million, 2018 -2032)

8.3.4.2. France Global Stainless-Steel IBC by End-User (USD Million, 2018 -2032)

8.3.5. UK

8.3.5.1. UK Global Stainless-Steel IBC by Capacity (USD Million, 2018 -2032)

8.3.5.2. UK Global Stainless-Steel IBC by End-User (USD Million, 2018 -2032)

8.3.6. Italy

8.3.6.1. Italy Global Stainless-Steel IBC by Capacity (USD Million, 2018 -2032)

8.3.6.2. Italy Global Stainless-Steel IBC by End-User (USD Million, 2018 -2032)

8.3.7. Spain

8.3.7.1. Spain Global Stainless-Steel IBC by Capacity (USD Million, 2018 -2032)

8.3.7.2. Spain Global Stainless-Steel IBC by End-User (USD Million, 2018 -2032)

8.3.8. Rest of Europe

8.3.8.1. Rest of Europe Global Stainless-Steel IBC by Capacity (USD Million, 2018 -2032)

8.3.8.2. Rest of Europe Global Stainless-Steel IBC by End-User (USD Million, 2018 -2032)

8.4. Asia-Pacific

8.4.1. Asia-Pacific Global Stainless-Steel IBC by Capacity (USD Million, 2018 -2032)

8.4.2. Asia-Pacific Global Stainless-Steel IBC by End-User (USD Million, 2018 -2032)

8.4.3. China

8.4.3.1. China Global Stainless-Steel IBC by Capacity (USD Million, 2018 -2032)

8.4.3.2. China Global Stainless-Steel IBC by End-User (USD Million, 2018 -2032)

8.4.4. India

8.4.4.1. India Global Stainless-Steel IBC by Capacity (USD Million, 2018 -2032)

8.4.4.2. India Global Stainless-Steel IBC by End-User (USD Million, 2018 -2032)

8.4.5. Japan

8.4.5.1. Japan Global Stainless-Steel IBC by Capacity (USD Million, 2018 -2032)

8.4.5.2. Japan Global Stainless-Steel IBC by End-User (USD Million, 2018 -2032)

8.4.6. Australia

8.4.6.1. Australia Global Stainless-Steel IBC by Capacity (USD Million, 2018 -2032)

8.4.6.2. Australia Global Stainless-Steel IBC by End-User (USD Million, 2018 -2032)

8.4.7. Southeast Asia

8.4.7.1. Southeast Asia Global Stainless-Steel IBC by Capacity (USD Million, 2018 -2032)

8.4.7.2. Southeast Asia Global Stainless-Steel IBC by End-User (USD Million, 2018 -2032)

8.4.8. Rest of Asia-Pacific

8.4.8.1. Rest of Asia-Pacific Global Stainless-Steel IBC by Capacity (USD Million, 2018 -2032)

8.4.8.2. Rest of Asia-Pacific Global Stainless-Steel IBC by End-User (USD Million, 2018 -2032)

8.5. Middle East and Africa

8.5.1. Middle East and Africa Global Stainless-Steel IBC by Capacity (USD Million, 2018 -2032)

8.5.2. Middle East and Africa Global Stainless-Steel IBC by End-User (USD Million, 2018 -2032)

8.5.3. Saudi Arabia

8.5.3.1. Saudi Arabia Global Stainless-Steel IBC by Capacity (USD Million, 2018 -2032)

8.5.3.2. Saudi Arabia Global Stainless-Steel IBC by End-User (USD Million, 2018 -2032)

8.5.4. South Africa

8.5.4.1. South Africa Global Stainless-Steel IBC by Capacity (USD Million, 2018 -2032)

8.5.4.2. South Africa Global Stainless-Steel IBC by End-User (USD Million, 2018 -2032)

8.5.5. UAE

8.5.5.1. UAE Global Stainless-Steel IBC by Capacity (USD Million, 2018 -2032)

8.5.5.2. UAE Global Stainless-Steel IBC by End-User (USD Million, 2018 -2032)

8.5.6. Egypt

8.5.6.1. Egypt Global Stainless-Steel IBC by Capacity (USD Million, 2018 -2032)

8.5.6.2. Egypt Global Stainless-Steel IBC by End-User (USD Million, 2018 -2032)

8.5.7. Rest of MEA

8.5.7.1. Rest of MEA Global Stainless-Steel IBC by Capacity (USD Million, 2018 -2032)

8.5.7.2. Rest of MEA Global Stainless-Steel IBC by End-User (USD Million, 2018 -2032)

8.6. South America

8.6.1. South America Global Stainless-Steel IBC by Capacity (USD Million, 2018 -2032)

8.6.2. South America Global Stainless-Steel IBC by End-User (USD Million, 2018 -2032)

8.6.3. Brazil

8.6.3.1. Brazil Global Stainless-Steel IBC by Capacity (USD Million, 2018 -2032)

8.6.3.2. Brazil Global Stainless-Steel IBC by End-User (USD Million, 2018 -2032)

8.6.4. Argentina

8.6.4.1. Argentina Global Stainless-Steel IBC by Capacity (USD Million, 2018 -2032)

8.6.4.2. Argentina Global Stainless-Steel IBC by End-User (USD Million, 2018 -2032)

8.6.5. Rest of South America

8.6.5.1. Rest of South America Global Stainless-Steel IBC by Capacity (USD Million, 2018 -2032)

8.6.5.2. Rest of South America Global Stainless-Steel IBC by End-User (USD Million, 2018 -2032)

9. COMPETITIVE LANDSCAPE

9.1. Introduction

9.2. Key Players Market Share Analysis, 2022 (%)

9.3. Competitive Benchmarking

9.4. Competitor Dashboard

9.5. Major Growth Strategy in the Market

9.6. Key Developments & Growth Strategies

9.6.1. New Product Development

9.6.2. Mergers & Acquisitions

9.6.3. Contracts & Agreements

9.6.4. Expansions & Investments

10. COMPANY PROFILES

10.1. Thielmann US LLC

10.1.1. Company Overview

10.1.2. Financial Overview

10.1.3. Products Offered

10.1.4. Key Developments

10.1.5. SWOT Analysis

10.1.6. Key Strategies

10.2. Precision IBC

10.2.1. Company Overview

10.2.2. Financial Overview

10.2.3. Products Offered

10.2.4. Key Developments

10.2.5. SWOT Analysis

10.2.6. Key Strategies

10.3. Automationstechnik GmbH

10.3.1. Company Overview

10.3.2. Financial Overview

10.3.3. Products Offered

10.3.4. Key Developments

10.3.5. SWOT Analysis

10.3.6. Key Strategies

10.4. Sharpsville Container Corporation

10.4.1. Company Overview

10.4.2. Financial Overview

10.4.3. Products Offered

10.4.4. Key Developments

10.4.5. SWOT Analysis

10.4.6. Key Strategies

10.5. Hoover Ferguson Group

10.5.1. Company Overview

10.5.2. Financial Overview

10.5.3. Products Offered

10.5.4. Key Developments

10.5.5. SWOT Analysis

10.5.6. Key Strategies

10.6. Snyder Industries Inc.

10.6.1. Company Overview

10.6.2. Financial Overview

10.6.3. Products Offered

10.6.4. Key Developments

10.6.5. SWOT Analysis

10.6.6. Key Strategies

10.7. SCHÄFER Werke GmbH

10.7.1. Company Overview

10.7.2. Financial Overview

10.7.3. Products Offered

10.7.4. Key Developments

10.7.5. SWOT Analysis

10.7.6. Key Strategies

10.8. Custom Metalcraft Inc

10.8.1. Company Overview

10.8.2. Financial Overview

10.8.3. Products Offered

10.8.4. Key Developments

10.8.5. SWOT Analysis

10.8.6. Key Strategies

10.9. Metano Ibc Services Inc.

10.9.1. Company Overview

10.9.2. Financial Overview

10.9.3. Products Offered

10.9.4. Key Developments

10.9.5. SWOT Analysis

10.9.6. Key Strategies

10.10. Matcon Ltd

10.10.1. Company Overview

10.10.2. Financial Overview

10.10.3. Products Offered

10.10.4. Key Developments

10.10.5. SWOT Analysis

10.10.6. Key Strategies

LIST OF TABLES

TABLE 1 PRIMARY INTERVIEWS

TABLE 2 LIST OF ASSUMPTIONS & LIMITATIONS

TABLE 3 GLOBAL STAINLESS STEEL IBC MARKET ESTIMATES & FORECAST, TYPE, 2018–2032 (USD MILLION)

TABLE 4 UP TO 1,000 LTRS: MARKET ESTIMATES & FORECAST, BY REGION, 2018–2032 (USD MILLION)

TABLE 5 1,001 TO 1,500 LITERS: MARKET ESTIMATES & FORECAST, BY REGION, 2018–2032 (USD MILLION)

TABLE 6 1,501 TO 2,000 LTRS: MARKET ESTIMATES & FORECAST, BY REGION, 2018–2032 (USD MILLION)

TABLE 7 ABOVE 2,000 LTRS: MARKET ESTIMATES & FORECAST, BY REGION, 2018–2032 (USD MILLION)

TABLE 8 GLOBAL STAINLESS STEEL IBC MARKET ESTIMATES & FORECAST, BY END USER, 2018–2032 (USD MILLION)

TABLE 9 INDUSTRIAL CHEMICALS: MARKET ESTIMATES & FORECAST, BY REGION, 2018–2032 (USD MILLION)

TABLE 10 PETROLEUM & LUBRICANTS: MARKET ESTIMATES & FORECAST, BY REGION, 2018–2032 (USD MILLION)

TABLE 11 FOOD & BEVERAGES: MARKET ESTIMATES & FORECAST, BY REGION, 2018–2032 (USD MILLION)

TABLE 12 CONSTRUCTION: MARKET ESTIMATES & FORECAST, BY REGION, 2018–2032 (USD MILLION)

TABLE 13 PHARMACEUTICAL: MARKET ESTIMATES & FORECAST, BY REGION, 2018–2032 (USD MILLION)

TABLE 14 OTHERS: MARKET ESTIMATES & FORECAST, BY REGION, 2018–2032 (USD MILLION)

TABLE 15 GLOBAL STAINLESS STEEL IBC MARKET ESTIMATES & FORECAST, BY REGION, 2018–2032 (USD MILLION)

TABLE 16 NORTH AMERICA: MARKET ESTIMATES & FORECAST, BY COUNTRY, 2018–2032 (USD MILLION)

TABLE 17 NORTH AMERICA: STAINLESS STEEL IBC MARKET, CAPACITY, 2018–2032 (USD MILLION)

TABLE 18 NORTH AMERICA: STAINLESS STEEL IBC MARKET, BY END USER, 2018–2032 (USD MILLION)

TABLE 19 US: STAINLESS STEEL IBC MARKET, CAPACITY, 2018–2032 (USD MILLION)

TABLE 20 US: STAINLESS STEEL IBC MARKET, BY END USER, 2018–2032 (USD MILLION)

TABLE 21 CANADA: STAINLESS STEEL IBC MARKET, CAPACITY, 2018–2032 (USD MILLION)

TABLE 22 CANADA: STAINLESS STEEL IBC MARKET, BY END USER, 2018–2032 (USD MILLION)

TABLE 23 MEXICO: STAINLESS STEEL IBC MARKET, CAPACITY, 2018–2032 (USD MILLION)

TABLE 24 MEXICO: STAINLESS STEEL IBC MARKET, BY END USER, 2018–2032 (USD MILLION)

TABLE 25 EUROPE: MARKET ESTIMATES & FORECAST, BY COUNTRY, 2018–2032 (USD MILLION)

TABLE 26 EUROPE: STAINLESS STEEL IBC MARKET, CAPACITY, 2018–2032 (USD MILLION)

TABLE 27 EUROPE: STAINLESS STEEL IBC MARKET, BY END USER, 2018–2032 (USD MILLION)

TABLE 28 GERMANY: STAINLESS STEEL IBC MARKET, CAPACITY, 2018–2032 (USD MILLION)

TABLE 29 GERMANY: STAINLESS STEEL IBC MARKET, BY END USER, 2018–2032 (USD MILLION)

TABLE 30 FRANCE: STAINLESS STEEL IBC MARKET, CAPACITY, 2018–2032 (USD MILLION)

TABLE 31 FRANCE: STAINLESS STEEL IBC MARKET, BY END USER, 2018–2032 (USD MILLION)

TABLE 32 ITALY: STAINLESS STEEL IBC MARKET, CAPACITY, 2018–2032 (USD MILLION)

TABLE 33 ITALY: STAINLESS STEEL IBC MARKET, BY END USER, 2018–2032 (USD MILLION)

TABLE 34 UK: STAINLESS STEEL IBC MARKET, CAPACITY, 2018–2032 (USD MILLION)

TABLE 35 UK: STAINLESS STEEL IBC MARKET, BY END USER, 2018–2032 (USD MILLION)

TABLE 36 SPAIN: STAINLESS STEEL IBC MARKET, CAPACITY, 2018–2032 (USD MILLION)

TABLE 37 SPAIN: STAINLESS STEEL IBC MARKET, BY END USER, 2018–2032 (USD MILLION)

TABLE 38 REST OF EUROPE: STAINLESS STEEL IBC MARKET, CAPACITY, 2018–2032 (USD MILLION)

TABLE 39 REST OF EUROPE: STAINLESS STEEL IBC MARKET, BY END USER, 2018–2032 (USD MILLION)

TABLE 40 ASIA-PACIFIC: MARKET ESTIMATES & FORECAST, BY COUNTRY, 2018–2032 (USD MILLION)

TABLE 41 ASIA PACIFIC: STAINLESS STEEL IBC MARKET, CAPACITY, 2018–2032 (USD MILLION)

TABLE 42 ASIA PACIFIC: STAINLESS STEEL IBC MARKET, BY END USER, 2018–2032 (USD MILLION)

TABLE 43 CHINA: STAINLESS STEEL IBC MARKET, CAPACITY, 2018–2032 (USD MILLION)

TABLE 44 CHINA: STAINLESS STEEL IBC MARKET, BY END USER, 2018–2032 (USD MILLION)

TABLE 45 JAPAN: STAINLESS STEEL IBC MARKET, CAPACITY, 2018–2032 (USD MILLION)

TABLE 46 JAPAN: STAINLESS STEEL IBC MARKET, BY END USER, 2018–2032 (USD MILLION)

TABLE 47 INDIA: STAINLESS STEEL IBC MARKET, CAPACITY, 2018–2032 (USD MILLION)

TABLE 48 INDIA: STAINLESS STEEL IBC MARKET, BY END USER, 2018–2032 (USD MILLION)

TABLE 49 AUSTRALIA: STAINLESS STEEL IBC MARKET, CAPACITY, 2018–2032 (USD MILLION)

TABLE 50 AUSTRALIA: STAINLESS STEEL IBC MARKET, BY END USER, 2018–2032 (USD MILLION)

TABLE 51 SOUTHEAST ASIA: STAINLESS STEEL IBC MARKET, CAPACITY, 2018–2032 (USD MILLION)

TABLE 52 SOUTH KOREA: STAINLESS STEEL IBC MARKET, BY END USER, 2018–2032 (USD MILLION)

TABLE 53 REST OF ASIA PACIFIC: STAINLESS STEEL IBC MARKET, CAPACITY, 2018–2032 (USD MILLION)

TABLE 54 REST OF ASIA PACIFIC: STAINLESS STEEL IBC MARKET, BY END USER, 2018–2032 (USD MILLION)

TABLE 55 SOUTH AMERICA: MARKET ESTIMATES & FORECAST, BY COUNTRY, 2018–2032 (USD MILLION)

TABLE 56 SOUTH AMERICA: STAINLESS STEEL IBC MARKET, CAPACITY, 2018–2032 (USD MILLION)

TABLE 57 SOUTH AMERICA: STAINLESS STEEL IBC MARKET, BY END USER, 2018–2032 (USD MILLION)

TABLE 58 BRAZIL: STAINLESS STEEL IBC MARKET, CAPACITY, 2018–2032 (USD MILLION)

TABLE 59 BRAZIL: STAINLESS STEEL IBC MARKET, BY END USER, 2018–2032 (USD MILLION)

TABLE 60 ARGENTINA: STAINLESS STEEL IBC MARKET, CAPACITY, 2018–2032 (USD MILLION)

TABLE 61 ARGENTINA: STAINLESS STEEL IBC MARKET, BY END USER, 2018–2032 (USD MILLION)

TABLE 62 REST OF SOUTH AMERICA: STAINLESS STEEL IBC MARKET, CAPACITY, 2018–2032 (USD MILLION)

TABLE 63 REST OF SOUTH AMERICA: STAINLESS STEEL IBC MARKET, BY END USER, 2018–2032 (USD MILLION)

TABLE 64 MIDDLE EAST & AFRICA: MARKET ESTIMATES & FORECAST, BY COUNTRY, 2018–2032 (USD MILLION)

TABLE 65 MIDDLE EAST & AFRICA: STAINLESS STEEL IBC MARKET, CAPACITY, 2018–2032 (USD MILLION)

TABLE 66 MIDDLE EAST & AFRICA: STAINLESS STEEL IBC MARKET, BY END USER, 2018–2032 (USD MILLION)

TABLE 67 SAUDI ARABIA: STAINLESS STEEL IBC MARKET, CAPACITY, 2018–2032 (USD MILLION)

TABLE 68 SAUDI ARABIA: STAINLESS STEEL IBC MARKET, BY END USER, 2018–2032 (USD MILLION)

TABLE 69 UAE: STAINLESS STEEL IBC MARKET, CAPACITY, 2018–2032 (USD MILLION)

TABLE 70 UAE: STAINLESS STEEL IBC MARKET, BY END USER, 2018–2032 (USD MILLION)

TABLE 71 SOUTH AFRICA: STAINLESS STEEL IBC MARKET, CAPACITY, 2018–2032 (USD MILLION)

TABLE 72 SOUTH AFRICA: STAINLESS STEEL IBC MARKET, BY END USER, 2018–2032 (USD MILLION)

TABLE 73 EGYPT: STAINLESS STEEL IBC MARKET, CAPACITY, 2018–2032 (USD MILLION)

TABLE 74 EGYPT: STAINLESS STEEL IBC MARKET, BY END USER, 2018–2032 (USD MILLION)

TABLE 75 REST OF MIDDLE EAST & AFRICA: STAINLESS STEEL IBC MARKET, CAPACITY, 2018–2032 (USD MILLION)

TABLE 76 REST OF MIDDLE EAST & AFRICA: STAINLESS STEEL IBC MARKET, BY END USER, 2018–2032 (USD MILLION)

TABLE 77 THIELMANN US LLC.: PRODUCTS OFFERED

TABLE 78 PRECISION IBC, INC: PRODUCTS OFFERED

TABLE 79 AUTOMATIONSTECHNIK GMBH: PRODUCTS OFFERED

TABLE 80 SHARPSVILLE CONTAINER CORPORATION: PRODUCTS OFFERED

TABLE 81 HOOVER FERGUSON GROUP: PRODUCTS OFFERED

TABLE 82 SNYDER INDUSTRIES INC.: PRODUCTS OFFERED

TABLE 83 SCHÄFER WERKE GMBH: PRODUCTS OFFERED

TABLE 84 CUSTOM METALCRAFT: PRODUCTS OFFERED

TABLE 85 METANO IBC: PRODUCTS OFFERED 

List Of Figures

FIGURE 1 MARKET SYNOPSIS

FIGURE 2 GLOBAL STAINLESS STEEL IBC MARKET ANALYSIS, CAPACITY, 2022 AND MARKET VALUE FROM 2018-2032

FIGURE 3 GLOBAL STAINLESS STEEL IBC MARKET ANALYSIS, BY END USER, 2022 AND MARKET VALUE FROM 2018-2032

FIGURE 4 GLOBAL STAINLESS STEEL IBC MARKET ANALYSIS, BY REGION, 2022

FIGURE 5 GLOBAL STAINLESS STEEL IBC MARKET: STRUCTURE

FIGURE 6 RESEARCH PROCESS

FIGURE 7 TOP-DOWN & BOTTOM-UP APPROACHES

FIGURE 8 MARKET DYNAMICS OVERVIEW

FIGURE 9 DRIVERS IMPACT ANALYSIS: GLOBAL STAINLESS STEEL IBC MARKET

FIGURE 10 RESTRAINT IMPACT ANALYSIS: GLOBAL MINING CHEMICALS MARKET

FIGURE 11 GLOBAL STAINLESS STEEL IBC MARKET: SUPPLY / VALUE CHAIN

FIGURE 13 GLOBAL STAINLESS STEEL IBC MARKET, CAPACITY, 2022 (% SHARE)

FIGURE 14 GLOBAL STAINLESS STEEL IBC MARKET, CAPACITY, 2018–2032 (USD MILLION)

FIGURE 15 GLOBAL STAINLESS STEEL IBC MARKET, BY END USER, 2022 (% SHARE)

FIGURE 16 GLOBAL STAINLESS STEEL IBC MARKET, BY END USER, 2018–2032 (USD MILLION)

FIGURE 17 GLOBAL STAINLESS STEEL IBC MARKET, BY REGION, 2018–2032 (USD MILLION)

FIGURE 18 GLOBAL STAINLESS STEEL IBC MARKET, BY REGION, 2022 (% SHARE)

FIGURE 19 NORTH AMERICA: STAINLESS STEEL IBC MARKET SHARE, BY COUNTRY, 2022 (% SHARE)

FIGURE 20 EUROPE: STAINLESS STEEL IBC MARKET SHARE, BY COUNTRY, 2022 (% SHARE)

FIGURE 21 ASIA-PACIFIC: STAINLESS STEEL IBC MARKET SHARE, BY COUNTRY, 2022 (% SHARE)

FIGURE 22 SOUTH AMERICA: STAINLESS STEEL IBC MARKET SHARE, BY COUNTRY, 2022 (% SHARE)

FIGURE 23 MIDDLE EAST & AFRICA: STAINLESS STEEL IBC MARKET SHARE, BY COUNTRY, 2022 (% SHARE)

Purchase Option
Single User $ 4,950
Multiuser License $ 5,950
Enterprise User $ 7,250
Compare Licenses
Tailored for You
  • Dedicated Research on any specifics segment or region.
  • Focused Research on specific players in the market.
  • Custom Report based only on your requirements.
  • Flexibility to add or subtract any chapter in the study.
  • Historic data from 2014 and forecasts outlook till 2040.
  • Flexibility of providing data/insights in formats (PDF, PPT, Excel).
  • Provide cross segmentation in applicable scenario/markets.