Spinning Machinery Market (2026 - 2035)

ID: MRFR/Equip/6667-HCR 100 Pages Snehal Singh Last Updated: October 19, 2026
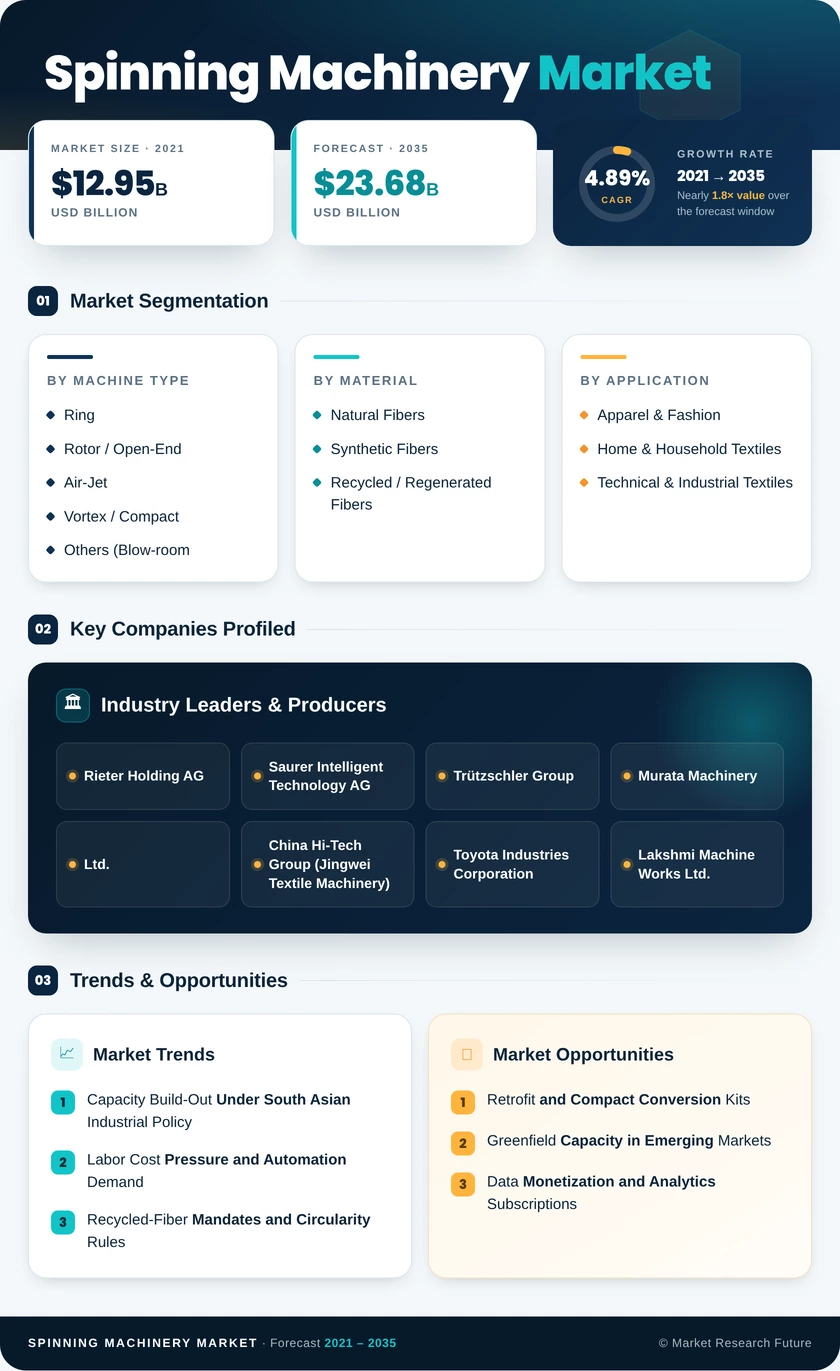
Spinning Machinery Market Research Report By Machine Type (Ring, Rotor / Open-End, Air-Jet, Vortex / Compact, Others (Blow-room, Carding, Draw-frame, Comber, Winder)), By Material (Natural Fibers (Cotton, Jute, Flax/Linen, Hemp, Coir, Wool, Silk, Alpaca, Cashmere, Mohair, etc.), Synthetic Fibers (Polyester, Nylon, Acrylic, Olefin/Polypropylene, Elastane/Spandex, Aramid, etc.), Recycled / Regenerated Fibers (Viscose Rayon, Modal, Lyocell/Tencel, Cupro, Acetate, Recycled Polyester (rPET), Recycled Nylon, PLA Fiber, etc.)), By Application (Apparel & Fashion, Home & Household Textiles, Technical & Industrial Textiles), By Automation Level (Conventional, Semi-Automated, Fully Digital / Smart Factory) - Forecast to 2035
Spinning Machinery Market
Market Size
Forecast Period2026-2035
CAGR (2026-2035)4.89%
2025 Market SizeUSD 14.69 billion
2035 Market SizeUSD 23.68 billion
Key Players
Rieter Holding AG
Saurer Intelligent Technology AG
Trützschler Group
Murata Machinery, Ltd.
China Hi-Tech Group
Toyota Industries Corporation
Opportunities
  • Retrofit and Compact Conversion Kits
  • Greenfield Capacity in Emerging Markets
  • Data Monetization and Analytics Subscriptions
  1. 1 Market Summary | |
  2. 2 Key Report Takeaways | |
    1. 2.1 By Machine Type | |
    2. 2.2 By Material | |
    3. 2.3 By Application | |
    4. 2.4 By Automation Level | |
    5. 2.5 By Region | |
  3. 3 Market Size and Forecast (2021–2035) | |
    1. 3.1 Historical Market Size (2021–2025) | |
    2. 3.2 Forecast Market Size (2026–2035) | |
  4. 4 Driver Impact Analysis | |
    1. 4.1 Capacity Build-Out Under South Asian Industrial Policy | |
    2. 4.2 Labor Cost Pressure and Automation Demand | |
    3. 4.3 Recycled-Fiber Mandates and Circularity Rules | |
    4. 4.4 Energy Efficiency and Decarbonization Targets | |
    5. 4.5 Replacement of Aging Installed Base | |
    6. 4.6 Technical Textile Expansion | |
    7. 4.7 Gulf and African Industrial Diversification | |
  5. 5 Restraints Impact Analysis | |
    1. 5.1 High Capital Cost and Financing Constraints | |
    2. 5.2 Cyclical Yarn Demand and Order Volatility | |
    3. 5.3 Raw Material Price Volatility | |
    4. 5.4 Trade Barriers and Supply Chain Compliance Rules | |
    5. 5.5 Shortage of Skilled Technicians | |
  6. 6 Opportunities | |
    1. 6.1 Retrofit and Compact Conversion Kits | |
    2. 6.2 Greenfield Capacity in Emerging Markets | |
    3. 6.3 Data Monetization and Analytics Subscriptions | |
    4. 6.4 Integrated Recycling-to-Yarn Lines | |
    5. 6.5 Specialty Equipment for High-Performance Yarns | |
  7. 7 Regional Market Share and Country-Level Analysis | |
    1. 7.1 North America | | |
      1. 7.1.1 United States | | |
      2. 7.1.2 Canada | | |
      3. 7.1.3 Mexico | |
    2. 7.2 Europe | | |
      1. 7.2.1 United Kingdom | | |
      2. 7.2.2 Germany | | |
      3. 7.2.3 France | | |
      4. 7.2.4 Italy | | |
      5. 7.2.5 Spain | | |
      6. 7.2.6 BENELUX (Belgium, Netherlands, and Luxembourg) | | |
      7. 7.2.7 NORDICS (Denmark, Finland, Iceland, Norway, and Sweden) | | |
      8. 7.2.8 Rest of Europe | |
    3. 7.3 Asia-Pacific | | |
      1. 7.3.1 China | | |
      2. 7.3.2 India | | |
      3. 7.3.3 Japan | | |
      4. 7.3.4 Australia | | |
      5. 7.3.5 South Korea | | |
      6. 7.3.6 ASEAN (Indonesia, Thailand, Philippines, Malaysia, Vietnam) | | |
      7. 7.3.7 Rest of Asia-Pacific | |
    4. 7.4 South America | | |
      1. 7.4.1 Brazil | | |
      2. 7.4.2 Argentina | | |
      3. 7.4.3 Rest of South America | |
    5. 7.5 Middle East and Africa | | |
      1. 7.5.1 Saudi Arabia | | |
      2. 7.5.2 United Arab Emirates | | |
      3. 7.5.3 Qatar | | |
      4. 7.5.4 Kuwait | | |
      5. 7.5.5 Turkey | | |
      6. 7.5.6 Egypt | | |
      7. 7.5.7 South Africa | | |
      8. 7.5.8 Nigeria | | |
      9. 7.5.9 Rest of Middle East and Africa | |
  8. 8 Future Outlook (2026–2035) | |
    1. 8.1 AI-Driven Mill Operations | |
    2. 8.2 Circularity and Digital Traceability | |
    3. 8.3 Energy and Decarbonization Pressure | |
    4. 8.4 Geographic Rebalancing of Capacity | |
  9. 9 Segmentation Analysis | |
    1. 9.1 By Machine Type | | |
      1. 9.1.1 Ring | | |
      2. 9.1.2 Rotor / Open-End | | |
      3. 9.1.3 Air-Jet | | |
      4. 9.1.4 Vortex / Compact | | |
      5. 9.1.5 Others (Blow-room, Carding, Draw-frame, Comber, Winder) | |
    2. 9.2 By Material | | |
      1. 9.2.1 Natural Fibers (Cotton, Jute, Flax/Linen, Hemp, Coir, Wool, Silk, Alpaca, Cashmere, Mohair, etc.) | | |
      2. 9.2.2 Synthetic Fibers (Polyester, Nylon, Acrylic, Olefin/Polypropylene, Elastane/Spandex, Aramid, etc.) | | |
      3. 9.2.3 Recycled / Regenerated Fibers (Viscose Rayon, Modal, Lyocell/Tencel, Cupro, Acetate, Recycled Polyester (rPET), Recycled Nylon, PLA Fiber, etc.) | |
    3. 9.3 By Application | | |
      1. 9.3.1 Apparel & Fashion | | |
      2. 9.3.2 Home & Household Textiles | | |
      3. 9.3.3 Technical & Industrial Textiles | |
    4. 9.4 By Automation Level | | |
      1. 9.4.1 Conventional | | |
      2. 9.4.2 Semi-Automated | | |
      3. 9.4.3 Fully Digital / Smart Factory | |
  10. 10 Competitive Landscape | |
    1. 10.1 Market Concentration Analysis | |
    2. 10.2 Competitive Benchmarking Matrix | |
    3. 10.3 Company Profiles | | |
      1. 10.3.1 Rieter Holding AG | | |
      2. 10.3.2 Saurer Intelligent Technology AG | | |
      3. 10.3.3 Trützschler Group | | |
      4. 10.3.4 Murata Machinery, Ltd. | | |
      5. 10.3.5 China Hi-Tech Group (Jingwei Textile Machinery) | | |
      6. 10.3.6 Toyota Industries Corporation | | |
      7. 10.3.7 Lakshmi Machine Works Ltd. | | |
      8. 10.3.8 Marzoli Machines Textile (Camozzi Group) | | |
      9. 10.3.9 Savio Macchine Tessili S.p.A. | | |
      10. 10.3.10 ANDRITZ AG | |
  11. 11 Recent News & Developments | |
  12. 12 Report Scope and Methodology | |
  13. 13 Detailed Sources and Citations | |
  14. 14 Frequently Asked Questions (FAQs) | | LIST OF TABLES | |
  15. TABLE 1 Global Market Summary Snapshot, 2025–2035 | |
  16. TABLE 2 Global Market Size & Forecast, by Revenue (USD billion), 2021–2035 | |
  17. TABLE 3 Driver Impact Analysis, 2026–2035 | |
  18. TABLE 4 Restraints Impact Analysis, 2026–2035 | |
  19. TABLE 5 Regional Summary, 2025 | |
  20. TABLE 6 North America Country-Level Analysis, 2025 | |
  21. TABLE 7 Europe Country-Level Analysis, 2025 | |
  22. TABLE 8 Asia-Pacific Country-Level Analysis, 2025 | |
  23. TABLE 9 South America Country-Level Analysis, 2025 | |
  24. TABLE 10 Middle East and Africa Country-Level Analysis, 2025 | |
  25. TABLE 11 Global Market Size, by Machine Type, 2021–2035 (USD billion) | |
  26. TABLE 12 Global Market Size, by Material, 2021–2035 (USD billion) | |
  27. TABLE 13 Global Market Size, by Application, 2021–2035 (USD billion) | |
  28. TABLE 14 Global Market Size, by Automation Level, 2021–2035 (USD billion) | |
  29. TABLE 15 Competitive Benchmarking Matrix, 2025 | |
  30. TABLE 16 Report Scope and Methodology | |
  31. TABLE 17 Detailed Sources and Citations | | LIST OF FIGURES | |
  32. FIGURE 1 Market Dynamics Overview (Drivers, Restraints, Opportunities) | |
  33. FIGURE 2 Industry Value Chain Analysis | |
  34. FIGURE 3 Porter's Five Forces Analysis | |
  35. FIGURE 4 Global Market Size Trend, 2021–2035 (USD billion) | |
  36. FIGURE 5 Market Share by Machine Type, 2025 | |
  37. FIGURE 6 Market Share by Material, 2025 | |
  38. FIGURE 7 Market Share by Application, 2025 | |
  39. FIGURE 8 Market Share by Automation Level, 2025 | |
  40. FIGURE 9 Regional Market Share, 2025 | |
  41. FIGURE 10 Regional Growth Comparison, 2026–2035 | |
  42. FIGURE 11 Competitive Landscape Positioning Map, 2025 | |
  43. FIGURE 12 Estimated Revenue Share of Key Players, 2025

Segmentation Quick Reference

DimensionSub-SegmentsDominant SegmentFastest Growing Segment
By Machine TypeRing; Rotor / Open-End; Air-Jet; Vortex / Compact; Others (Blow-room, Carding, Draw-frame, Comber, Winder)Ring (Share: 52.6%)Vortex / Compact (CAGR: 6.2%)
By MaterialNatural Fibers; Synthetic Fibers; Recycled / Regenerated FibersSynthetic Fibers (Share: 66.2%)Recycled / Regenerated Fibers (CAGR: 6.6%)
By ApplicationApparel & Fashion; Home & Household Textiles; Technical & Industrial TextilesApparel & Fashion (Share: 58.0%)Technical & Industrial Textiles (CAGR: 6.3%)
By Automation LevelConventional; Semi-Automated; Fully Digital / Smart FactorySemi-Automated (Share: 52.5%)Fully Digital / Smart Factory (CAGR: 7.1%)
By RegionNorth America; Europe; Asia-Pacific; South America; Middle East and AfricaAsia-Pacific (Share: 68.5%)Middle East and Africa (CAGR: 6.1%)

Market Segmentation Overview

By Machine Type

Sub-SegmentKey Trend
RingCompact conversion kits extend frame life and improve evenness
Rotor / Open-EndRising use for denim and recycled fiber blends
Air-JetAdoption in viscose and polyester specialty mills
Vortex / CompactFast growth in technical and blended yarn demand
Others (Blow-room, Carding, Draw-frame, Comber, Winder)Bundled line procurement with efficiency guarantees

Ring frames lead this dimension because mills value their ability to switch between cotton, polyester, and blends without retooling. Vortex / Compact grows fastest, as buyers of technical yarns pay premiums for low hairiness and high strength. Rotor / Open-End holds steady demand where recycled and coarse yarns dominate, while preparatory units increasingly sell as part of complete lines.

By Material

Sub-SegmentKey Trend
Natural Fibers (Cotton, Jute, Flax/Linen, Hemp, Coir, Wool, Silk, Alpaca, Cashmere, Mohair, etc.)Premium positioning amid climate-related supply risk
Synthetic Fibers (Polyester, Nylon, Acrylic, Olefin/Polypropylene, Elastane/Spandex, Aramid, etc.)Polyester cost advantage supports high spindle speeds
Recycled / Regenerated Fibers (Viscose Rayon, Modal, Lyocell/Tencel, Cupro, Acetate, Recycled Polyester (rPET), Recycled Nylon, PLA Fiber, etc.)Brand pledges and EU EPR rules drive rapid uptake

Synthetic Fibers dominate because polyester's uniform staple allows faster processing at lower unit cost. Recycled / Regenerated Fibers expand fastest, propelled by EU circularity rules and brand recycled-content targets, though their short staple requires adaptive carding. Natural Fibers keep a strong premium niche in shirting and bed linen.

By Application

Sub-SegmentKey Trend
Apparel & FashionSeasonal design cycles reward flexible frames
Home & Household TextilesProductive air-jet lines favored for bulk orders
Technical & Industrial TextilesGeotextile, filtration, and EV demand lifts growth

Apparel & Fashion holds the largest share because global garment consumption and fast-fashion replenishment sustain constant yarn demand. Technical & Industrial Textiles grow fastest, supported by infrastructure, medical, and battery applications that need high-tenacity yarns. Home & Household Textiles deliver steady mid-single-digit growth tied to rising incomes.

By Automation Level

Sub-SegmentKey Trend
ConventionalPersists in capital-constrained mills in Africa and South Asia
Semi-AutomatedAuto-piecing offers an affordable step toward smart production
Fully Digital / Smart FactoryCloud connectivity tied to brand compliance audits

Semi-Automated lines lead because they deliver auto-piecing benefits without the full cost of a connected mill. Fully Digital / Smart Factory systems grow fastest as brands require production data in audits and labor costs climb in China and Turkey. Conventional frames remain common where financing is scarce, but their share will erode steadily through 2035.


Download PDF ×

We do not share your information with anyone. However, we may send you emails based on your report interest from time to time. You may contact us at any time to opt-out.