ID: MRFR/MED/1370-HCR | February 2021 | Region: Global | 110 Pages
Table of Content
1. Report Prologue
2. Market Introduction
2.1 Definition
2.2 Scope of the Study
2.2.1 Research Objective
2.2.2 Assumptions
2.2.3 Limitations
3. Research Methodology
3.1 Introduction
3.2 Primary Research
3.3 Secondary research
3.4 Market Size Estimation
4. Market Dynamics
4.1 Drivers
4.2 Restraints
4.3 Opportunities
4.4 Challenges
4.5 Macroeconomic Indicators
4.6 Technology Trends & Assessment
5. Market Factor Analysis
5.1 Porters Five Forces Analysis
5.2 Value Chain Analysis
5.3 Investment Feasibility Analysis
5.4 Pricing Analysis
6. Global Spinal Traction Market, by Type
6.1 Introduction
6.2 Manual Spinal Traction
6.2.1 Market Estimates & Forecast, 2020-2027
6.3 Mechanical Spinal Traction
6.3.1 Market Estimates & Forecast, 2020-2027
7. Global Spinal Traction Market, by Applications
7.1 Introduction
7.2 Slipped Discs
7.2.1 Market Estimates & Forecast, 2020-2027
7.3 Bone Spurs
7.3.1 Market Estimates & Forecast, 2020-2027
7.4 Degenerative Disc Disease
7.4.1 Market Estimates & Forecast, 2020-2027
7.5 Herniated Discs
7.5.1 Market Estimates & Forecast, 2020-2027
7.6 Facet Disease
7.6.1 Market Estimates & Forecast, 2020-2027
7.7 Sciatica
7.7.1 Market Estimates & Forecast, 2020-2027
7.8 Foramina Stenosis
7.8.1 Market Estimates & Forecast, 2020-2027
7.9 Pinched Nerves
7.9.1 Market Estimates & Forecast, 2020-2027
8. Global Spinal Traction Market, by Devices
8.1 Introduction
8.2 Continuous Traction
8.2.1 Market Estimates & Forecast, 2020-2027
8.3 Gravity-Dependent Traction
8.3.1 Market Estimates & Forecast, 2020-2027
8.4 Manual Traction
8.4.1 Market Estimates & Forecast, 2020-2027
9. Global Spinal Traction Market, by Region
9.1 Introduction
9.2 Americas
9.2.1 North America
9.2.1.1 US
9.2.1.2 Canada
9.2.2 South America
9.3 Europe
9.3.1 Western Europe
9.3.1.1 Germany
9.3.1.2 France
9.3.1.3 UK
9.3.1.4 Italy
9.3.1.5 Spain
9.3.1.6 Rest of Western Europe
9.3.2 Eastern Europe
9.4 Asia Pacific
9.4.1 Japan
9.4.2 China
9.4.3 India
9.4.4 Australia
9.4.5 Republic of Korea
9.4.6 Rest of Asia Pacific
9.5 The Middle East & Africa
9.5.1 United Arab Emirates
9.5.2 Saudi Arabia
9.5.3 Oman
9.5.4 Kuwait
9.5.5 Qatar
9.5.6 Rest of the Middle East & Africa
10 Company Landscape
10.1 Introduction
10.2 Market Share Analysis
10.3 Key Development & Strategies
10.3.1 Key Developments
11 Company Profiles
11.1 Saunders Group, Inc.
11.1.1 Overview
11.1.2 Product Overview
11.1.3 Financials
11.1.4 Key Developments
11.2 Scrip, Inc.
11.2.1 Overview
11.2.2 Product Overview
11.2.3 Financials
11.2.4 Key Developments
11.3 BTL
11.3.1 Overview
11.3.2 Product Overview
11.3.3 Financials
11.3.4 Key Development
11.4 Stoll Medizintechnik GmbH
11.4.1 Overview
11.4.2 Product Overview
11.4.3 Financials
11.4.4 Key Development
11.5 Hill Laboratories Company
11.5.1 Overview
11.5.2 Product Overview
11.5.3 Financials
11.5.4 Key Development
11.6 North American Medical Corporation
11.6.1 Overview
11.6.2 Product Overview
11.6.3 Financials
11.6.4 Key Development
11.7 Spinetronics LLC
11.7.1 Overview
11.7.2 Product Overview
11.7.3 Financials
11.7.4 Key Development
11.8 Dentsply International
11.8.1 Overview
11.8.2 Product Overview
11.8.3 Financials
11.8.4 Key Development
11.9 Medtronic, Inc.
11.9.1 Overview
11.9.2 Product Overview
11.9.3 Financials
11.9.4 Key Development
11.10 Others
11.10.1 Overview
11.10.2 Product Overview
11.10.3 Financials
11.10.4 Key Development
12 MRFR Conclusion
12.1 Key Findings
12.1.1 From CEO’s View Point
12.1.2 Unmet Needs of the Market
12.2 Key Companies to Watch
12.3 Prediction of Spinal Traction Treatment Industry
13 Appendix
List of Tables
TABLE 1 GLOBAL SPINAL TRACTION MARKET, BY TYPES, 2020-2027 (USD MILLION)
TABLE 2 MANUAL SPINAL TRACTION FOR SPINAL TRACTION MARKET, BY REGION, 2020-2027 (USD MILLION)
TABLE 3 MECHANICAL SPINAL TRACTION FOR SPINAL TRACTION MARKET, BY REGION 2020-2027 (USD MILLION)
TABLE 4 GLOBAL SPINAL TRACTION MARKET, BY APPLICATIONS, 2020-2027 (USD MILLION)
TABLE 5 SLIPPED DISCS FOR SPINAL TRACTION MARKET, BY REGION, 2020-2027 (USD MILLION)
TABLE 6 BONE SPURS FOR SPINAL TRACTION MARKET, BY REGION 2020-2027 (USD MILLION)
TABLE 7 DEGENERATIVE DISC DISEASE FOR SPINAL TRACTION MARKET, BY REGION 2020-2027 (USD MILLION)
TABLE 8 HERNIATED DISCS FOR SPINAL TRACTION MARKET, BY REGION 2020-2027 (USD MILLION)
TABLE 9 FACET DISEASE FOR SPINAL TRACTION MARKET, BY REGION 2020-2027 (USD MILLION)
TABLE 10 SCIATICA FOR SPINAL TRACTION MARKET, BY REGION 2020-2027 (USD MILLION)
TABLE 11 FORAMINA STENOSIS FOR SPINAL TRACTION MARKET, BY REGION 2020-2027 (USD MILLION)
TABLE 12 PINCHED NERVES FOR SPINAL TRACTION MARKET, BY REGION 2020-2027 (USD MILLION)
TABLE 13 GLOBAL SPINAL TRACTION MARKET, BY DEVICES, 2020-2027 (USD MILLION)
TABLE 14 CONTINUOUS TRACTION FOR SPINAL TRACTION MARKET, BY REGION, 2020-2027 (USD MILLION)
TABLE 15 GRAVITY-DEPENDENT TRACTION FOR SPINAL TRACTION MARKET, BY REGION 2020-2027 (USD MILLION)
TABLE 16 MANUAL TRACTION FOR SPINAL TRACTION MARKET, BY REGION 2020-2027 (USD MILLION)
TABLE 17 GLOBAL SPINAL TRACTION MARKET, BY END USER, 2020-2027 (USD MILLION)
TABLE 18 NORTH AMERICA SPINAL TRACTION MARKET, BY COUNTRY 2020-2027 (USD MILLION)
TABLE 19 NORTH AMERICA SPINAL TRACTION MARKET, BY TYPES 2020-2027 (USD MILLION)
TABLE 20 NORTH AMERICA SPINAL TRACTION MARKET, BY APPLICATIONS 2020-2027 (USD MILLION)
TABLE 21 NORTH AMERICA SPINAL TRACTION MARKET, BY DEVICES 2020-2027 (USD MILLION)
TABLE 22 NORTH AMERICA SPINAL TRACTION MARKET, BY END USER, 2020-2027 (USD MILLION)
TABLE 23 NORTH AMERICA SPINAL TRACTION MARKET BY REGION 2020-2027 (USD MILLION
TABLE 24 EUROPE SPINAL TRACTION MARKET BY COUNTRY 2020-2027 (USD MILLION)
TABLE 25 EUROPE SPINAL TRACTION MARKET, BY TYPES 2020-2027 (USD MILLION)
TABLE 26 EUROPE SPINAL TRACTION MARKET, BY APPLICATIONS 2020-2027 (USD MILLION)
TABLE 27 EUROPE SPINAL TRACTION MARKET, BY DEVICES 2020-2027 (USD MILLION)
TABLE 28 EUROPE SPINAL TRACTION MARKET, BY END USER, 2020-2027 (USD MILLION)
TABLE 29 EUROPE SPINAL TRACTION MARKET, BY REGION 2020-2027 (USD MILLION)
TABLE 30 ASIA PACIFIC SPINAL TRACTION MARKET BY COUNTRY 2020-2027 (USD MILLION)
TABLE 31 ASIA PACIFIC SPINAL TRACTION MARKET, BY TYPES 2020-2027 (USD MILLION)
TABLE 32 ASIA PACIFIC SPINAL TRACTION MARKET, BY APPLICATIONS 2020-2027 (USD MILLION)
TABLE 33 ASIA PACIFIC SPINAL TRACTION MARKET, BY DEVICES 2020-2027 (USD MILLION)
TABLE 34 ASIA PACIFIC SPINAL TRACTION MARKET, BY END USER, 2020-2027 (USD MILLION)
TABLE 35 ASIA PACIFIC SPINAL TRACTION MARKET, BY REGION 2020-2027 (USD MILLION)
TABLE 36 MIDDLE EAST & AFRICA SPINAL TRACTION MARKET, BY REGION 2020-2027 (USD MILLION)
TABLE 37 MIDDLE EAST & AFRICA SPINAL TRACTION MARKET BY COUNTRY 2020-2027 (USD MILLION)
TABLE 38 MIDDLE EAST & AFRICA SPINAL TRACTION MARKET, BY TYPES 2020-2027 (USD MILLION)
TABLE 39 MIDDLE EAST & AFRICA SPINAL TRACTION MARKET, BY APPLICATIONS 2020-2027 (USD MILLION)
TABLE 40 MIDDLE EAST & AFRICA SPINAL TRACTION MARKET, BY DEVICES 2020-2027 (USD MILLION)
TABLE 41 MIDDLE EAST & AFRICA SPINAL TRACTION MARKET, BY END USER, 2020-2027 (USD MILLION)
TABLE 42 MIDDLE EAST & AFRICA SPINAL TRACTION MARKET, BY REGION 2020-2027 (USD MILLION)
List of Figures
FIGURE 1 RESEARCH PROCESS
FIGURE 2 MARKET DYNAMICS FOR GLOBAL SPINAL TRACTION MARKET
FIGURE 3 GLOBAL SPINAL TRACTION MAKRET, BY SEGMENT, 2020
FIGURE 4 GLOBAL SPINAL TRACTION SUCCESS MARKET, BY REGION
FIGURE 5 GLOBAL SPINAL TRACTION MARKET SHARE, BY TYPES 2020
FIGURE 6 GLOBAL SPINAL TRACTION MARKET SHARE, BY APPLICATIONS 2020
FIGURE 7 GLOBAL SPINAL TRACTION MARKET SHARE, BY DEVICES 2020
FIGURE 8 GLOBAL SPINAL TRACTION MARKET SHARE, BY END USER, 2020
FIGURE 9 GLOBAL SPINAL TRACTION MARKET SHARE, 2020
FIGURE 10 GLOBAL SPINAL TRACTION MARKET SHARE, BY REGION, 2020
FIGURE 11 NORTH AMERICA SPINAL TRACTION MARKET SHARE, BY COUNTRY, 2020
FIGURE 12 EUROPE SPINAL TRACTION MARKET SHARE, BY COUNTRY, 2020
FIGURE 13 ASIA PACIFIC SPINAL TRACTION MARKET SHARE, BY COUNTRY, 2020
FIGURE 14 MIDDLE EAST & AFRICA SPINAL TRACTION MARKET, BY REGION, 2020
FIGURE 15 GLOBAL SPINAL TRACTION MARKET: COMPANY SHARE ANALYSIS, 2020 (%)
FIGURE 16 SAUNDERS GROUP, INC.: KEY FINANCIALS
FIGURE 17 SAUNDERS GROUP, INC.: SEGMENTAL REVENUE
FIGURE 18 SAUNDERS GROUP, INC.: GEOGRAPHICAL REVENUE
FIGURE 19 SCRIP, INC: KEY FINANCIALS
FIGURE 20 SCRIP, INC: SEGMENTAL REVENUE
FIGURE 21 SCRIP, INC: GEOGRAPHICAL REVENUE
FIGURE 22 BTL.: KEY FINANCIALS
FIGURE 23 BTL.: SEGMENTAL REVENUE
FIGURE 24 BTL.: GEOGRAPHICAL REVENUE
FIGURE 25 STOLL MEDIZINTECHNIK GMBH: KEY FINANCIALS
FIGURE 26 STOLL MEDIZINTECHNIK GMBH: SEGMENTAL REVENUE
FIGURE 27 STOLL MEDIZINTECHNIK GMBH: GEOGRAPHICAL REVENUE
FIGURE 28 MEDTRONIC, INC: FINANCIAL REVENUE
FIGURE 29 MEDTRONIC, INC: SEGMENTAL REVENUE
FIGURE 30 MEDTRONIC, INC: GEOGRPAHICAL REVENUE
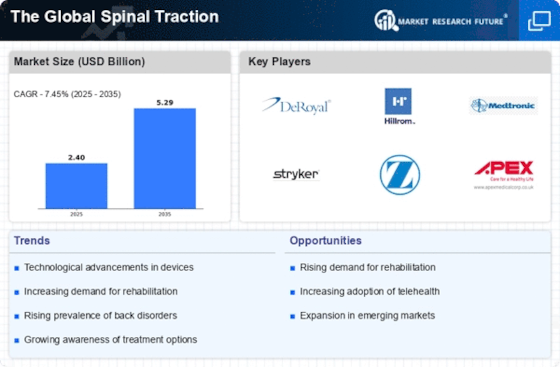
The spinal traction market is expected to reach USD 6.0 billion by 2023 at a CAGR of ~ 7.7 % during the forecast period 2017-2023.
The devices used for spinal traction helps in decompressing and stabilizing the spine thus helps in the treatment of various spinal disorders or orthopedic conditions like muscle contracture, fracture of a bone, and various deformities associated with it like scoliosis, kyphosis, etc. these devices are used by doctors for the treatment of muscle spasm and the back pain of the lower part of the body. It makes the patient prepare oneself for surgical terms like endoscopic spine surgery, repair of vertebral compression, fixation of interspinal bones, etc. globally in the spinal traction market it was marked that the treatment is performed both manually as well as in a mechanical way. Spinal traction is used for the treatment of sciatica, pinched nerves, degenerative discs, and many other spinal conditions. The market scenario gave information about the structure of the market data and the developmental plans so carried out by the researchers. It signifies the product base analysis of the refurbished market.
COVID 19 ANALYSIS
The spread of the coronavirus has taken place in almost every developing country globally. When the government felt the impact of COVID, the countrywide lockdown was announced by him. The impact of the COVID was observed among the public which had a great impact on the spinal traction market. The huge economic loss was marked as the shutdown of restaurants and hotels took place. Flight cancellations and quarantines took place.
The government imposed strict rules and regulations among the public. Countrywide shutdown or lockdown was observed.
Market Dynamics
Drivers- spinal traction market size can be increased by geriatric population, rise in diseases of the spinal cord, expansion of screening and awareness about the spinal traction and development in the healthcare sector. The trauma of the spinal cord had increased the market size. Deformities of the spinal at an infant stage boosts up the spinal traction global market growth.
Opportunities- demand of expenditure for setting up of healthcare for perfect treatment has enhanced the opportunity of spinal traction market size. The presence of a large number of spinal companies and large hospital facilities in the developing regions steers up the growth. Revolution in the spinal traction global market traction promotes annual compound growth and gives a lucrative opportunity for expansion of this market size.
Challenges- the large cost of raw materials, price as per spinal traction market trends, and spinal traction industry analysis are the challenging factor of this market scenario during the spinal traction global market forecast period. The market competition faced due to the less or large supply of the products urges a challenging factor on the domestic or local tariffs during this market forecast period.
Cumulative growth- shifting as per the priority of patients and surgeons by adopting advanced surgical methods. Carrying out clinical trials by using the latest technology helps in the expansion of the spinal traction market growth. Spinal traction hospital forming chains play a holistic role in the cumulative growth of the market. Natural compounds have been extracted from certain plants that help in the stimulation of cells and help in the transplantation of the injured spinal cells.
Restraints- lack of proper clinical data, rise in the cost of the spinal devices, high cost for medical treatment, less demand for the invasive procedures, risk during the surgery like the risk of infection, post-surgery back pain are the major restraining factor of the spinal market.
Value Chain Analysis
The supply chain in the spinal traction market has brought light key development strategies thus encircling minimal cost structure. This enables a sound understanding of the growth of the market. Market positioning and targeting the customers are the basis of the value supply chain.
Segment Overview
By type- based on the type the spinal traction market has been divided based on end-users, diagnosis, and treatment. According to the devices, the market is again bifurcated into continuous traction and manual traction.
By technology- with the advancement of technology innovation of new spinal devices took place. Innovative technology strategized the many companies where the major focus was especially on the development of such devices. The technology offered the best diagnosis and treatment to the patient having spine disorder. It led to the discovery of wireless sensor technology which led to the production of advanced products connected to external devices which helps in market for spinal traction analysis and recovery process. The use of new methodologies, treatment, and therapeutics has brought effective results in the spinal traction industry. Regulatory framework and development of medical technological methods and certain policies push up the growth of the market. The new technology provides good and best solutions that fulfill the requirements of the customer.
Figure 1 Spinal traction Global Market by Types, 2016 (%)
Regional Analysis
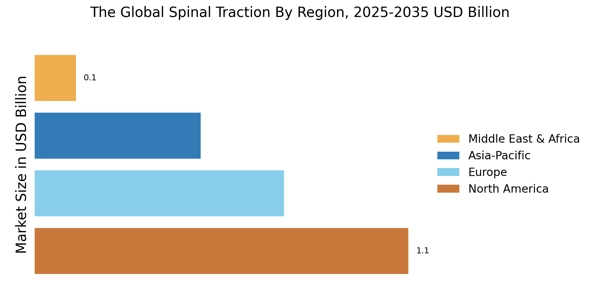
The major region of America covers the spinal traction market share and spends a large sum on the healthcare of the spinal ailment people. The adoption of new medical devices and new diagnosis facilities in the United States drives the spinal market. North America shared a major part of the spinal traction global market. This is because here major spin disorder patients are present. Europe followed after North America covers the next larger portion of spinal traction market share due to its high expenses and good health facilities. France and Germany lead the market. The UK is marked as the market growing at a faster pace. Asia Pacific countries like India and China due to their fastest-growing health sector and fulfilling the unmet huge requirement spur the growth. South Asian countries are estimated to grow rapidly during this market forecast period. The markets of the Middle East and Saudi America show cumulative growth emerge as the fastest growing market with an expansion of healthcare insurance. There are still some developing countries that need to be evenly tapped.
Competitive Landscape
The information about the competitive landscape of spinal traction market is provided by the competitors forming partnerships with other companies. The above company focuses majorly on production sites, generation of revenue, weakness, and strength of the company, launching of a new product, taking new marketing initiatives, etc. some of the competitors during the market for spinal traction forecast period are Saunders Group, Inc., Scrip, Inc., BTL, Stoll Medizintechnik Gmbh, Hill Laboratories Company, North American Medical Corporation, Spinetronics, LLC, Dentsply International, Medtronics, Inc., Spine Rx technology, Spinal designs International, CERT Health Sciences, LLC and VAX-D technologies and many more.
Report Overview
From spinal traction market analysis, it was marked about the holistic evaluation of the segmentation done by the spinal traction of the market. Each part of the segment elaborates on the various components and the division so done. From spinal traction industry trends yearly progress of the market was marked. The report also provides insights about the COVID period that has affected the market during the spinal traction industry forecast period. It provides an in-depth analysis of the status and future prospectus of the spinal traction industry. From the market for spinal traction outlook, the report diversifies about the challenges, opportunities, spinal traction global market trends, drivers that enhance the spinal traction industry size, and the restraints that hamper the growth. The report concentrated on the developmental activities. The report also signifies the price put forward by the competitors to target the brands thus understanding the spinal traction value.
Report Attribute/Metric | Details |
---|---|
Market Size | 2023: USD 6.0 billion |
CAGR | 2017-2023: 7.7% |
Base Year | 2019 |
Forecast Period | 2027 |
Historical Data | 2018 |
Forecast Units | Value (USD Billion) |
Report Coverage | Revenue Forecast, Competitive Landscape, Growth Factors, and Trends |
Segments Covered | Types, Diagnosis, Treatment, and End-User |
Geographies Covered | North America, Europe, Asia-Pacific, and Rest of the World (RoW) |
Key Vendors | Saunders Group, Inc., Scrip, Inc., BTL, Stoll Medizintechnik GmbH, Hill Laboratories Company, North American Medical (NAM) Corporation, Spinetronics, LLC, Dentsply International, Medtronic, Inc., SpineRx Technology, Spinal Designs International, Inc., CERT Health Sciences, LLC and VAX-D Medical Technologies, LLC |
Key Market Opportunities | Development of new Devices with Advanced Technology |
Key Market Drivers |
|
Frequently Asked Questions (FAQ) :
By 2023, Spinal Traction Market would grow up to USD 6 billion.
Innovation has the major edge in taking the global Spinal Traction Market ahead.
The CAGR of Spinal Traction Market would be 7.7% during the forecast period of 2017 to 2023.
The Spinal Traction Market has gravity-dependent traction, continuous traction, and manual traction.
The Spinal Traction Market has segments like bone spurs, slipped discs, herniated discs, facet disease, degenerative disc disease, foramina stenosis, sciatica, and pinched nerves.