South Korea Industrial Automation & Equipment Market Segmentation
Industrial Automation & Equipment By Procedure (USD Million, 2025-2035)
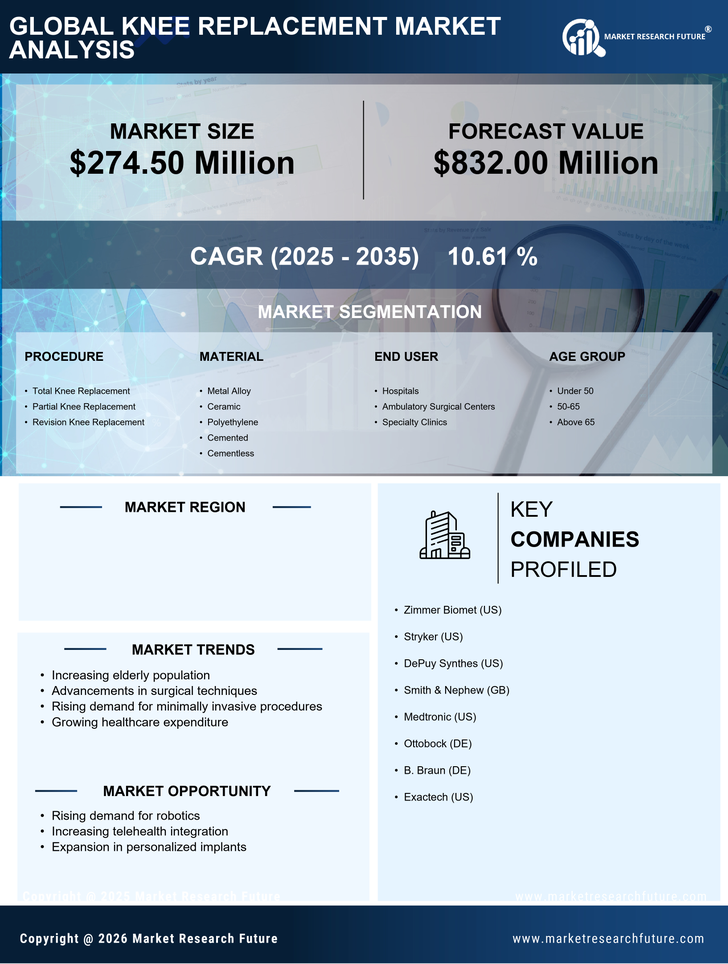
- Total Knee Replacement
- Partial Knee Replacement
- Revision Knee Replacement
Industrial Automation & Equipment By Material (USD Million, 2025-2035)
- Metal Alloy
- Ceramic
- Polyethylene
- Cemented
- Cementless
Industrial Automation & Equipment By End User (USD Million, 2025-2035)
- Hospitals
- Ambulatory Surgical Centers
- Specialty Clinics
Industrial Automation & Equipment By Age Group (USD Million, 2025-2035)
- Under 50
- 50-65
- Above 65