

South America Industrial Automation & Equipment Market Segmentation
Industrial Automation & Equipment By Type (USD Million, 2025-2035)
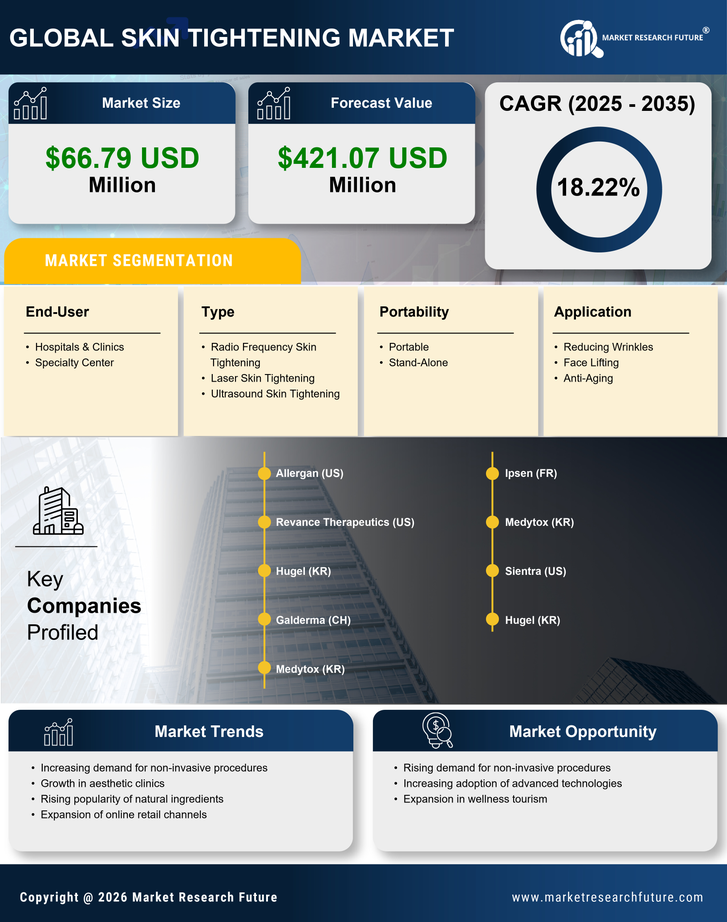
- Radio Frequency Skin Tightening
- Laser Skin Tightening
- Ultrasound Skin Tightening
Industrial Automation & Equipment By Portability (USD Million, 2025-2035)
- Portable
- Stand-Alone
Industrial Automation & Equipment By End-User (USD Million, 2025-2035)
- Hospitals & Clinics
- Specialty Center
Industrial Automation & Equipment By Application (USD Million, 2025-2035)
- Reducing Wrinkles
- Face Lifting
- Anti-Aging


