South America South America Peripheral Nerve Stimulators Market Segmentation
South America Peripheral Nerve Stimulators Market By Product (USD Million, 2025-2035)
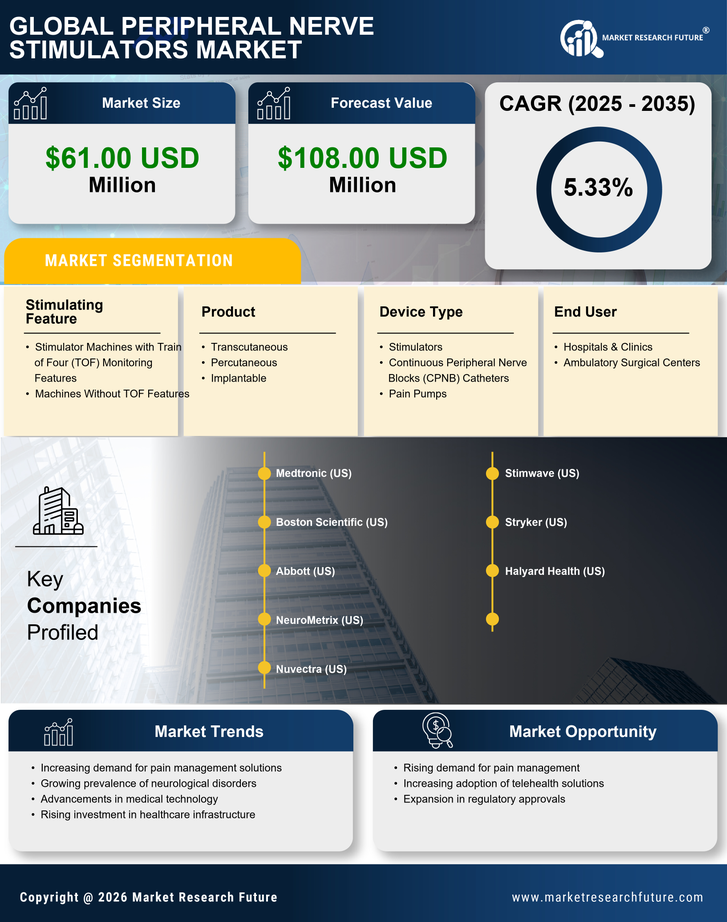
- Transcutaneous
- Percutaneous
- Implantable
South America Peripheral Nerve Stimulators Market By Device Type (USD Million, 2025-2035)
- Stimulators
- Continuous Peripheral Nerve Blocks (CPNB) Catheters
- Pain Pumps
South America Peripheral Nerve Stimulators Market By Stimulating Feature (USD Million, 2025-2035)
- Stimulator Machines with Train of Four (TOF) Monitoring Features
- Machines Without TOF Features
South America Peripheral Nerve Stimulators Market By End User (USD Million, 2025-2035)
- Hospitals & Clinics
- Ambulatory Surgical Centers