South America South America Hepatitis Test Solution Diagnosis Market Segmentation
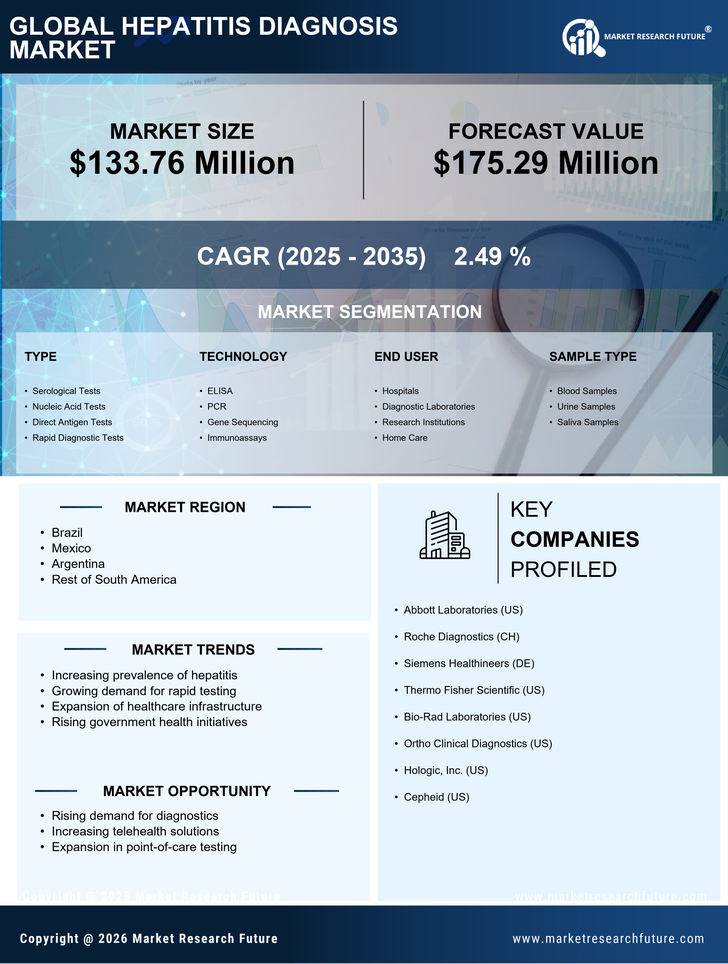
South America Hepatitis Test Solution Diagnosis Market By Test Type (USD Million, 2022-2035)
- Serological Tests
- Molecular Tests
- Antigen Tests
- Rapid Tests
South America Hepatitis Test Solution Diagnosis Market By End User (USD Million, 2022-2035)
- Hospitals
- Diagnostic Laboratories
- Clinics
- Home Care Settings
South America Hepatitis Test Solution Diagnosis Market By Technology (USD Million, 2022-2035)
- Enzyme-Linked Immunosorbent Assay
- Polymerase Chain Reaction
- Lateral Flow Assay
- Nucleic Acid Testing
South America Hepatitis Test Solution Diagnosis Market By Disease Type (USD Million, 2022-2035)
- Hepatitis A
- Hepatitis B
- Hepatitis C
- Hepatitis D
South America Hepatitis Test Solution Diagnosis Market By Sample Type (USD Million, 2022-2035)
- Blood Samples
- Serum Samples
- Plasma Samples
- Saliva Samples