Sodium Chloride Market

ID: MRFR/CnM/6661-HCR
140 Pages
Chitranshi Jaiswal
Last Updated: June 05, 2026
Sodium Chloride Market Research Report Information By Type (Rock Salt, Solar Salt and Others), By Manufacturing Process (Artificial Evaporation and Solar Evaporation), By Grade (Food Grade, Pharmaceutical Grade and Technical Grade), By Application (Chemical Production, Deicing, Water Conditioning, Agriculture, Food Processing, Pharmaceutical and Others), And By Region (Europe, Asia-Pacific, North America, And Rest Of The World) –Market Forecast Till 2035
Download PDF ×

We do not share your information with anyone. However, we may send you emails based on your report interest from time to time. You may contact us at any time to opt-out.

  1. 1 Market Overview |
    1. 1.1 Study Assumptions & Market Definition |
    2. 1.2 Scope of the Study |
    3. 1.3 Research Methodology
  2. 2 Market Summary & Key Takeaways
  3. 3 Market Dynamics |
    1. 3.1 Market Drivers Analysis | |
      1. 3.1.1 Chlor-Alkali Capacity Expansion | |
      2. 3.1.2 Sodium-Ion Battery Cathode Scaling | |
      3. 3.1.3 Pharmaceutical-Grade Supply Constraints | |
      4. 3.1.4 Molten-Salt Thermal Energy Storage | |
      5. 3.1.5 Municipal Water Softening Salt Mandates | |
      6. 3.1.6 Packaged Food Processing Salt Demand | |
      7. 3.1.7 Highway Deicing Salt Budget Increases |
    2. 3.2 Market Restraints Analysis | |
      1. 3.2.1 Sodium-Reduction Health Regulations | |
      2. 3.2.2 Environmental Limits on Brine Discharge | |
      3. 3.2.3 Substitute Deicers Gaining Traction | |
      4. 3.2.4 Logistics and Freight-Cost Volatility | |
      5. 3.2.5 Price Compression from Oversupply Cycles |
    3. 3.3 Market Opportunity Analysis | |
      1. 3.3.1 Sodium-Ion Battery Supply Chains | |
      2. 3.3.2 Pharma-Grade Capacity in Emerging Markets | |
      3. 3.3.3 Smart Water-Softening Services | |
      4. 3.3.4 Integrated Brine-to-Chemicals Platforms | |
      5. 3.3.5 African Market White Space |
    4. 3.4 Industry Value Chain Analysis |
    5. 3.5 Porter's Five Forces Analysis
  4. 4 Global Sodium Chloride Market Size & Forecast (2021–2035) |
    1. 4.1 Historical Market Size (2021–2025) |
    2. 4.2 Current & Forecast Market Size (2026–2035) |
    3. 4.3 Market Size by Revenue (USD Million) |
    4. 4.4 Year-over-Year Growth Analysis
  5. 5 Segmentation Analysis |
    1. 5.1 By Grade | |
      1. 5.1.1 Rock Salt | |
      2. 5.1.2 Solar Salt | |
      3. 5.1.3 Vacuum Salt |
    2. 5.2 By Application | |
      1. 5.2.1 Chemical Production | |
      2. 5.2.2 De-Icing | |
      3. 5.2.3 Water Treatment | |
      4. 5.2.4 Food Processing | |
      5. 5.2.5 Agriculture | |
      6. 5.2.6 Pharmaceuticals | |
      7. 5.2.7 Other Applications
  6. 6 Regional Analysis |
    1. 6.1 North America | |
      1. 6.1.1 United States | |
      2. 6.1.2 Canada | |
      3. 6.1.3 Mexico |
    2. 6.2 Europe | |
      1. 6.2.1 Germany | |
      2. 6.2.2 United Kingdom | |
      3. 6.2.3 France | |
      4. 6.2.4 Italy | |
      5. 6.2.5 Spain | |
      6. 6.2.6 Nordic Countries | |
      7. 6.2.7 Russia | |
      8. 6.2.8 Rest of Europe |
    3. 6.3 Asia-Pacific | |
      1. 6.3.1 China | |
      2. 6.3.2 India | |
      3. 6.3.3 Japan | |
      4. 6.3.4 South Korea | |
      5. 6.3.5 ASEAN | |
      6. 6.3.6 Rest of Asia-Pacific |
    4. 6.4 South America | |
      1. 6.4.1 Brazil | |
      2. 6.4.2 Argentina | |
      3. 6.4.3 Rest of South America |
    5. 6.5 Middle East & Africa | |
      1. 6.5.1 Saudi Arabia | |
      2. 6.5.2 UAE | |
      3. 6.5.3 South Africa | |
      4. 6.5.4 Egypt | |
      5. 6.5.5 Rest of MEA
  7. 7 Competitive Landscape |
    1. 7.1 Market Share Analysis (2025) |
    2. 7.2 Competitive Benchmarking Matrix |
    3. 7.3 Company Profiles | |
      1. 7.3.1 Cargill, Inc. | |
      2. 7.3.2 Compass Minerals International | |
      3. 7.3.3 K+S AG | |
      4. 7.3.4 Tata Chemicals Ltd. | |
      5. 7.3.5 China National Salt Industry Group | |
      6. 7.3.6 Archean Chemical Industries | |
      7. 7.3.7 Dampier Salt (Rio Tinto) | |
      8. 7.3.8 INEOS Enterprises | |
      9. 7.3.9 Salins Group | |
      10. 7.3.10 Mitsui & Co.
  8. 8 Future Outlook & Strategic Recommendations (2026–2035) |
    1. 8.1 Electrification and Energy-Storage Integration |
    2. 8.2 Digital Salt-Production Platforms |
    3. 8.3 ESG and Sustainable Production Standards |
    4. 8.4 Trade-Route Realignment and Regionalization
  9. 9 Recent Developments & News
  10. 10 Frequently Asked Questions (FAQs)
  11. 11 Report Scope & Methodology |
    1. 11.1 Study Period & Base Year |
    2. 11.2 Data Sources & Citations |
    3. 11.3 Abbreviations
  12. 12 LIST OF TABLES |
  13. TABLE 1 Global Sodium Chloride Market Size & Forecast, by Revenue (USD Million), 2021–2035 |
  14. TABLE 2 Global Sodium Chloride Market — Year-over-Year Growth Analysis, 2021–2035 |
  15. TABLE 3 Global Sodium Chloride Market — Driver Impact Analysis, 2026–2035 |
  16. TABLE 4 Global Sodium Chloride Market — Restraint Impact Analysis, 2026–2035 |
  17. TABLE 5 Global Sodium Chloride Market Size, by Grade, 2021–2035 (USD Million) |
  18. TABLE 6 Global Sodium Chloride Market Size, by Application, 2021–2035 (USD Million) |
  19. TABLE 7 Global Sodium Chloride Market Size, by Region, 2021–2035 (USD Million) |
  20. TABLE 8 North America Sodium Chloride Market Size, by Country, 2021–2035 (USD Million) |
  21. TABLE 9 Europe Sodium Chloride Market Size, by Country, 2021–2035 (USD Million) |
  22. TABLE 10 Asia-Pacific Sodium Chloride Market Size, by Country, 2021–2035 (USD Million) |
  23. TABLE 11 South America Sodium Chloride Market Size, by Country, 2021–2035 (USD Million) |
  24. TABLE 12 Middle East & Africa Sodium Chloride Market Size, by Country, 2021–2035 (USD Million) |
  25. TABLE 13 Competitive Benchmarking Matrix — Global Sodium Chloride Market, 2025 |
  26. TABLE 14 Company Profiles — Key Players, Global Sodium Chloride Market |
  27. TABLE 15 Recent Developments & Strategic Announcements, 2023–2025 |
  28. TABLE 16 Report Scope & Methodology Parameters |
  29. TABLE 17 Detailed Sources and Citations |
  30. TABLE 18 North America Sodium Chloride Market Size, by Grade, 2021–2035 (USD Million) |
  31. TABLE 19 North America Sodium Chloride Market Size, by Application, 2021–2035 (USD Million) |
  32. TABLE 20 Europe Sodium Chloride Market Size, by Grade, 2021–2035 (USD Million) |
  33. TABLE 21 Europe Sodium Chloride Market Size, by Application, 2021–2035 (USD Million) |
  34. TABLE 22 Asia-Pacific Sodium Chloride Market Size, by Grade, 2021–2035 (USD Million) |
  35. TABLE 23 Asia-Pacific Sodium Chloride Market Size, by Application, 2021–2035 (USD Million) |
  36. TABLE 24 South America Sodium Chloride Market Size, by Grade, 2021–2035 (USD Million) |
  37. TABLE 25 South America Sodium Chloride Market Size, by Application, 2021–2035 (USD Million) |
  38. TABLE 26 Middle East & Africa Sodium Chloride Market Size, by Grade, 2021–2035 (USD Million) |
  39. TABLE 27 Middle East & Africa Sodium Chloride Market Size, by Application, 2021–2035 (USD Million) |
  40. TABLE 28 United States Sodium Chloride Market Size, by Grade, 2021–2035 (USD Million) |
  41. TABLE 29 United States Sodium Chloride Market Size, by Application, 2021–2035 (USD Million) |
  42. TABLE 30 Canada Sodium Chloride Market Size, by Grade, 2021–2035 (USD Million) |
  43. TABLE 31 Canada Sodium Chloride Market Size, by Application, 2021–2035 (USD Million) |
  44. TABLE 32 Mexico Sodium Chloride Market Size, by Grade, 2021–2035 (USD Million) |
  45. TABLE 33 Mexico Sodium Chloride Market Size, by Application, 2021–2035 (USD Million) |
  46. TABLE 34 Germany Sodium Chloride Market Size, by Grade, 2021–2035 (USD Million) |
  47. TABLE 35 Germany Sodium Chloride Market Size, by Application, 2021–2035 (USD Million) |
  48. TABLE 36 United Kingdom Sodium Chloride Market Size, by Grade, 2021–2035 (USD Million) |
  49. TABLE 37 United Kingdom Sodium Chloride Market Size, by Application, 2021–2035 (USD Million) |
  50. TABLE 38 France Sodium Chloride Market Size, by Grade, 2021–2035 (USD Million) |
  51. TABLE 39 France Sodium Chloride Market Size, by Application, 2021–2035 (USD Million) |
  52. TABLE 40 Italy Sodium Chloride Market Size, by Grade, 2021–2035 (USD Million) |
  53. TABLE 41 Italy Sodium Chloride Market Size, by Application, 2021–2035 (USD Million) |
  54. TABLE 42 Spain Sodium Chloride Market Size, by Grade, 2021–2035 (USD Million) |
  55. TABLE 43 Spain Sodium Chloride Market Size, by Application, 2021–2035 (USD Million) |
  56. TABLE 44 Nordic Countries Sodium Chloride Market Size, by Grade, 2021–2035 (USD Million) |
  57. TABLE 45 Nordic Countries Sodium Chloride Market Size, by Application, 2021–2035 (USD Million) |
  58. TABLE 46 Russia Sodium Chloride Market Size, by Grade, 2021–2035 (USD Million) |
  59. TABLE 47 Russia Sodium Chloride Market Size, by Application, 2021–2035 (USD Million) |
  60. TABLE 48 China Sodium Chloride Market Size, by Grade, 2021–2035 (USD Million) |
  61. TABLE 49 China Sodium Chloride Market Size, by Application, 2021–2035 (USD Million) |
  62. TABLE 50 India Sodium Chloride Market Size, by Grade, 2021–2035 (USD Million) |
  63. TABLE 51 India Sodium Chloride Market Size, by Application, 2021–2035 (USD Million) |
  64. TABLE 52 Japan Sodium Chloride Market Size, by Grade, 2021–2035 (USD Million) |
  65. TABLE 53 Japan Sodium Chloride Market Size, by Application, 2021–2035 (USD Million) |
  66. TABLE 54 South Korea Sodium Chloride Market Size, by Grade, 2021–2035 (USD Million) |
  67. TABLE 55 South Korea Sodium Chloride Market Size, by Application, 2021–2035 (USD Million) |
  68. TABLE 56 ASEAN Sodium Chloride Market Size, by Grade, 2021–2035 (USD Million) |
  69. TABLE 57 ASEAN Sodium Chloride Market Size, by Application, 2021–2035 (USD Million) |
  70. TABLE 58 Brazil Sodium Chloride Market Size, by Grade, 2021–2035 (USD Million) |
  71. TABLE 59 Brazil Sodium Chloride Market Size, by Application, 2021–2035 (USD Million) |
  72. TABLE 60 Argentina Sodium Chloride Market Size, by Grade, 2021–2035 (USD Million) |
  73. TABLE 61 Argentina Sodium Chloride Market Size, by Application, 2021–2035 (USD Million) |
  74. TABLE 62 Saudi Arabia Sodium Chloride Market Size, by Grade, 2021–2035 (USD Million) |
  75. TABLE 63 Saudi Arabia Sodium Chloride Market Size, by Application, 2021–2035 (USD Million) |
  76. TABLE 64 UAE Sodium Chloride Market Size, by Grade, 2021–2035 (USD Million) |
  77. TABLE 65 UAE Sodium Chloride Market Size, by Application, 2021–2035 (USD Million) |
  78. TABLE 66 South Africa Sodium Chloride Market Size, by Grade, 2021–2035 (USD Million) |
  79. TABLE 67 South Africa Sodium Chloride Market Size, by Application, 2021–2035 (USD Million) |
  80. TABLE 68 Egypt Sodium Chloride Market Size, by Grade, 2021–2035 (USD Million) |
  81. TABLE 69 Egypt Sodium Chloride Market Size, by Application, 2021–2035 (USD Million)
  82. 13 LIST OF FIGURES |
  83. FIGURE 1 Global Sodium Chloride Market Dynamics — Drivers, Restraints, and Opportunities |
  84. FIGURE 2 Industry Value Chain Analysis — Sodium Chloride Market |
  85. FIGURE 3 Porter's Five Forces Analysis — Sodium Chloride Market |
  86. FIGURE 4 Global Sodium Chloride Market Size Trend & Forecast (USD Million), 2021–2035 |
  87. FIGURE 5 Global Sodium Chloride Market Share, by Grade, 2025 (%) |
  88. FIGURE 6 Global Sodium Chloride Market Share, by Application, 2025 (%) |
  89. FIGURE 7 Global Sodium Chloride Market Share, by Region, 2025 (%) |
  90. FIGURE 8 North America Sodium Chloride Market Size Trend (USD Million), 2021–2035 |
  91. FIGURE 9 Europe Sodium Chloride Market Size Trend (USD Million), 2021–2035 |
  92. FIGURE 10 Asia-Pacific Sodium Chloride Market Size Trend (USD Million), 2021–2035 |
  93. FIGURE 11 South America Sodium Chloride Market Size Trend (USD Million), 2021–2035 |
  94. FIGURE 12 Middle East & Africa Sodium Chloride Market Size Trend (USD Million), 2021–2035 |
  95. FIGURE 13 Competitive Landscape — Market Share Analysis, 2025 (%) |
  96. FIGURE 14 Competitive Positioning Matrix — Key Players, 2025

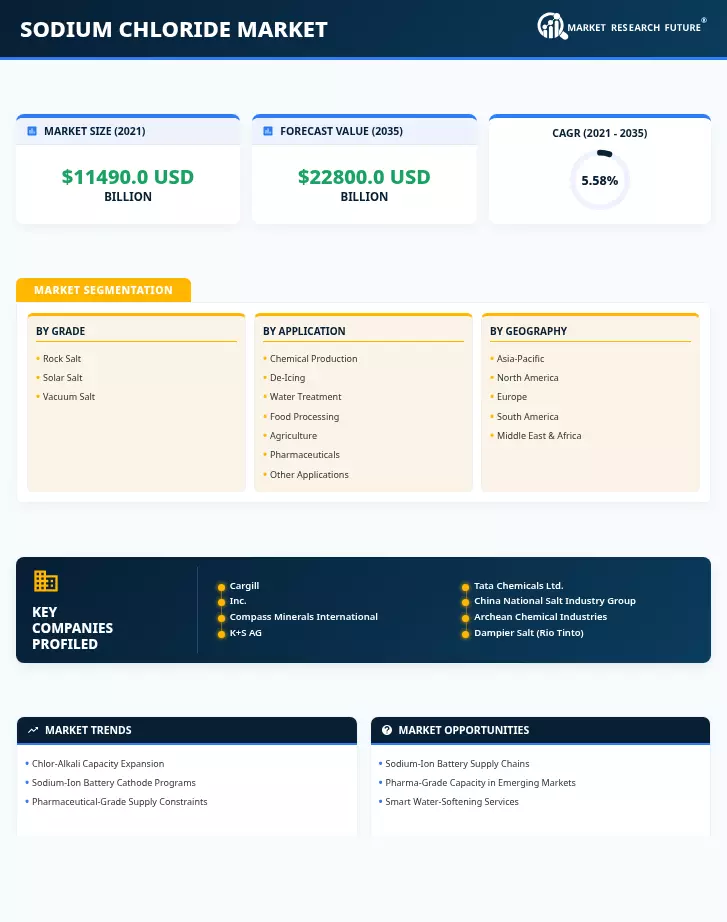
Segmentation Quick Reference

Dimension Sub-Segments Dominant Segment Fastest Growing Segment
By Grade Rock Salt, Solar Salt, Vacuum Salt Rock Salt (38.8% share, 2025) Vacuum Salt (7.56% CAGR)
By Application Chemical Production, De-Icing, Water Treatment, Food Processing, Agriculture, Pharmaceuticals, Other Applications Chemical Production (35.4% share, 2025) Pharmaceuticals (8.44% CAGR)
By Geography Asia-Pacific, North America, Europe, South America, Middle East & Africa Asia-Pacific (49.8% share, 2025) Asia-Pacific (6.92% CAGR)


Market Segmentation Overview

By Grade

Sub-Segment Key Trend
Rock Salt Sustained demand from highway deicing programs and bulk chlor-alkali feedstock contracts; mature extraction economics
Solar Salt Cost-competitive production expansion in India, Australia, and Latin America driven by tropical solar irradiance
Vacuum Salt Rapid adoption for pharmaceutical-grade, battery-grade, and premium food-processing applications requiring ultra-high purity


Rock salt continues to anchor global volume through low-cost underground mining, while vacuum salt captures the highest growth rates as downstream industries demand tighter purity specifications. Solar salt offers a cost-effective middle tier, particularly attractive for integrated brine-to-chemicals operations in coastal geographies.

By Application

Sub-Segment Key Trend
Chemical Production Chlor-alkali membrane-cell upgrades raising salt-purity specifications; soda-ash co-production driving volume
De-Icing State and municipal DOT budgets expanding in North America and Northern Europe; environmental pressure from substitute deicers
Water Treatment Municipal water softening mandates spreading across hard-water regions in the US Midwest and Southwest
Food Processing Packaged-food output scaling rapidly in India, Southeast Asia, and Latin America; sodium-reduction labeling partially offsetting volume
Agriculture Livestock mineral-supplement formulations and soil-conditioning applications growing steadily in developing agricultural economies
Pharmaceuticals FDA/EMA supply-security initiatives catalyzing new pharmaceutical-grade production capacity; highest per-ton margins in the market
Other Applications Niche uses in textile dyeing, leather processing, oil-well drilling fluids, and rubber manufacturing


Chemical production dominates the application landscape by consuming the largest share of global sodium chloride output, while pharmaceuticals command the steepest growth trajectory and the highest unit-value pricing in the market.