Sodium Bicarbonate Market (2026 - 2035)

ID: MRFR/CnM/1963-CR 111 Pages Priya Nagrale Last Updated: November 12, 2026
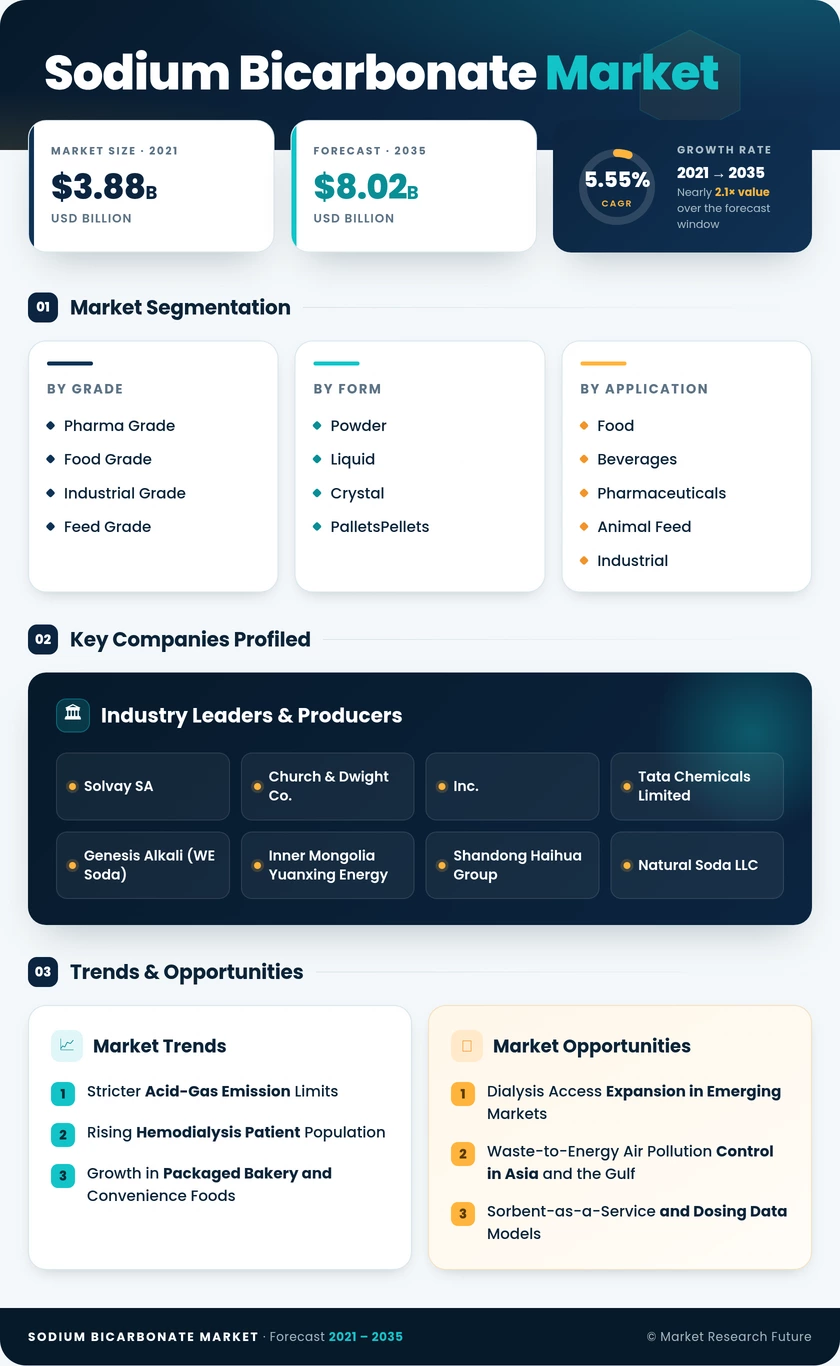
Sodium Bicarbonate Market Research Report Information By Grade (Pharma Grade, Food Grade, Industrial Grade, and Feed Grade), By Form (Powder, Liquid, Crystal, and Pallets), By Application (Food and Beverages, Pharmaceuticals, Animal Feed, Industrial, Water Treatment, and Others), And By Region (North America, Europe, Asia-Pacific, and Rest of the World) – Market Forecast Till 2035.
Sodium Bicarbonate Market
Market Size
Forecast Period2026-2035
CAGR (2026-2035)5.55%
2025 Market SizeUSD 4.67 Billion
2035 Market SizeUSD 8.02 Billion
Key Players
Solvay SA
Church & Dwight Co., Inc.
Tata Chemicals Limited
Genesis Alkali
Inner Mongolia Yuanxing Energy
Shandong Haihua Group
Opportunities
  • Dialysis Access Expansion in Emerging Markets
  • Waste-to-Energy Air Pollution Control in Asia and the Gulf
  • Sorbent-as-a-Service and Dosing Data Models
  1. 1 Market Summary | |
  2. 2 Key Report Takeaways | |
    1. 2.1 By Grade | |
    2. 2.2 By Form | |
    3. 2.3 By Application | |
    4. 2.4 By Region | |
  3. 3 Market Size and Forecast (2021–2035) | |
  4. 4 Driver Impact Analysis | |
    1. 4.1 Stricter Acid-Gas Emission Limits | |
    2. 4.2 Rising Hemodialysis Patient Population | |
    3. 4.3 Growth in Packaged Bakery and Convenience Foods | |
    4. 4.4 Livestock Intensification and Rumen-Buffer Adoption | |
    5. 4.5 Pharma-Grade Capacity Investment | |
    6. 4.6 Water Treatment and Aquaculture Alkalinity Control | |
  5. 5 Restraints Impact Analysis | |
    1. 5.1 Energy and Feedstock Cost Volatility | |
    2. 5.2 Competition from Alternative Sorbents | |
    3. 5.3 Dietary Sodium Reduction Policies | |
    4. 5.4 High Freight Cost Relative to Product Value | |
    5. 5.5 Chinese Overcapacity and Export Price Pressure | |
  6. 6 Opportunities | |
    1. 6.1 Dialysis Access Expansion in Emerging Markets | |
    2. 6.2 Waste-to-Energy Air Pollution Control in Asia and the Gulf | |
    3. 6.3 Sorbent-as-a-Service and Dosing Data Models | |
    4. 6.4 CO2-Derived Bicarbonate and Low-Carbon Premiums | |
  7. 7 Regional Market Share and Country-Level Analysis | |
    1. 7.1 North America | | |
      1. 7.1.1 United States | | |
      2. 7.1.2 Canada | | |
      3. 7.1.3 Mexico | |
    2. 7.2 Europe | | |
      1. 7.2.1 Germany | | |
      2. 7.2.2 UK | | |
      3. 7.2.3 France | | |
      4. 7.2.4 Italy | | |
      5. 7.2.5 Spain | | |
      6. 7.2.6 Nordic Countries | | |
      7. 7.2.7 Russia | | |
      8. 7.2.8 Rest of Europe | |
    3. 7.3 Asia-Pacific | | |
      1. 7.3.1 China | | |
      2. 7.3.2 India | | |
      3. 7.3.3 Japan | | |
      4. 7.3.4 South Korea | | |
      5. 7.3.5 ASEAN | | |
      6. 7.3.6 Rest of Asia-Pacific | |
    4. 7.4 South America | | |
      1. 7.4.1 Brazil | | |
      2. 7.4.2 Argentina | | |
      3. 7.4.3 Rest of South America | |
    5. 7.5 Middle East & Africa | | |
      1. 7.5.1 Saudi Arabia | | |
      2. 7.5.2 UAE | | |
      3. 7.5.3 South Africa | | |
      4. 7.5.4 Egypt | | |
      5. 7.5.5 Rest of MEA | |
  8. 8 Future Outlook (2026–2035) | |
    1. 8.1 Decarbonized Production and CO2 Utilization | |
    2. 8.2 Air Pollution Control as a Utility-Scale Business | |
    3. 8.3 Renal Care Demographics | |
    4. 8.4 Supply-Chain Regionalization and Digital Dosing | |
  9. 9 Segmentation Analysis | |
    1. 9.1 By Grade | | |
      1. 9.1.1 Pharma Grade | | |
      2. 9.1.2 Food Grade | | |
      3. 9.1.3 Industrial Grade | | |
      4. 9.1.4 Feed Grade | |
    2. 9.2 By Form | | |
      1. 9.2.1 Powder | | |
      2. 9.2.2 Liquid | | |
      3. 9.2.3 Crystal | | |
      4. 9.2.4 Pallets | |
    3. 9.3 By Application | | |
      1. 9.3.1 Food and Beverages | | |
      2. 9.3.2 Pharmaceuticals | | |
      3. 9.3.3 Animal Feed | | |
      4. 9.3.4 Industrial | | |
      5. 9.3.5 Water Treatment | | |
      6. 9.3.6 Others | |
  10. 10 Competitive Landscape | |
    1. 10.1 Market Concentration Analysis | |
    2. 10.2 Competitive Benchmarking Matrix | |
    3. 10.3 Company Profiles | | |
      1. 10.3.1 Solvay SA | | |
      2. 10.3.2 Church & Dwight Co., Inc. | | |
      3. 10.3.3 Tata Chemicals Limited | | |
      4. 10.3.4 Genesis Alkali (WE Soda) | | |
      5. 10.3.5 Inner Mongolia Yuanxing Energy | | |
      6. 10.3.6 Shandong Haihua Group | | |
      7. 10.3.7 Natural Soda LLC | | |
      8. 10.3.8 CIECH Group | | |
      9. 10.3.9 Novacarb (Seqens) | | |
      10. 10.3.10 AGC Inc. | |
  11. 11 Recent News & Developments | |
  12. 12 Report Scope and Methodology | |
  13. 13 Detailed Sources and Citations | |
  14. 14 Frequently Asked Questions (FAQs) | | LIST OF TABLES | |
  15. TABLE 1 Market Snapshot – Key Metrics, 2025–2035 | |
  16. TABLE 2 Global Market Size & Forecast, by Revenue (USD Billion), 2021–2035 | |
  17. TABLE 3 Driver Impact Analysis, 2026–2035 | |
  18. TABLE 4 Restraints Impact Analysis, 2026–2035 | |
  19. TABLE 5 Regional Summary, 2025 | |
  20. TABLE 6 North America Market, by Country, 2025 | |
  21. TABLE 7 Europe Market, by Country, 2025 | |
  22. TABLE 8 Asia-Pacific Market, by Country, 2025 | |
  23. TABLE 9 South America Market, by Country, 2025 | |
  24. TABLE 10 Middle East & Africa Market, by Country, 2025 | |
  25. TABLE 11 Global Market, by Grade, 2025–2035 | |
  26. TABLE 12 Global Market, by Form, 2025–2035 | |
  27. TABLE 13 Global Market, by Application, 2025–2035 | |
  28. TABLE 14 Competitive Benchmarking Matrix, 2025 | |
  29. TABLE 15 Report Scope and Methodology | |
  30. TABLE 16 Detailed Sources and Citations | |
  31. TABLE 17 Segmentation Quick Reference | | LIST OF FIGURES | |
  32. FIGURE 1 Market Dynamics Overview – Drivers, Restraints and Opportunities | |
  33. FIGURE 2 Industry Value Chain – Soda Ash Feedstock to End Use | |
  34. FIGURE 3 Porter's Five Forces Analysis | |
  35. FIGURE 4 Global Market Size Trend, 2021–2035 (USD Billion) | |
  36. FIGURE 5 Market Share by Grade, 2025 | |
  37. FIGURE 6 Market Share by Form, 2025 | |
  38. FIGURE 7 Market Share by Application, 2025 | |
  39. FIGURE 8 Regional Market Share, 2025 | |
  40. FIGURE 9 Regional Growth Comparison, 2026–2035 | |
  41. FIGURE 10 Competitive Landscape – Estimated Revenue Share Ranges, 2025

Segmentation Quick Reference

DimensionSub-SegmentsDominant SegmentFastest Growing Segment
By GradePharma Grade, Food Grade, Industrial Grade, Feed GradeFood Grade (33.2% share)Pharma Grade (7.0% CAGR)
By FormPowder, Liquid, Crystal, PelletsPowder (58.4% share)Liquid (6.6% CAGR)
By ApplicationFood and Beverages, Pharmaceuticals, Animal Feed, Industrial, Water Treatment, OthersFood and Beverages (30.4% share)Industrial (6.9% CAGR)
By RegionNorth America, Europe, Asia-Pacific, South America, Middle East & AfricaAsia-Pacific (42.6% share)North America (6.1% CAGR)

Market Segmentation Overview

By Grade

Sub-SegmentKey Trend
Pharma GradeNew compendial capacity to serve dialysis and antacid producers
Food GradeSteady leavening demand from industrial bakeries in emerging economies
Industrial GradeRetrofit demand from coal, steel and incineration emission rules
Feed GradeWider rumen-buffer use in intensive dairy and feedlot systems

Food Grade leads at 33.2% because bakery, dairy and beverage producers buy it in large, steady volumes under E500(ii) authorization. Pharma Grade grows fastest at 7.0% CAGR as dialysis expansion and USP and Ph. Eur. requirements push buyers toward certified suppliers such as Tata Chemicals Europe and Solvay. Industrial Grade and Feed Grade remain volume anchors tied to emission rules and livestock intensity.

By Form

Sub-SegmentKey Trend
PowderDefault format for silo-fed sorbent injection, baking and feed premixes
LiquidInline dosing adoption in pharma plants and dialysis centers
CrystalControlled dissolution for water treatment dosing
PalletsSlow-release use in agricultural and specialty dosing applications

Powder holds 58.4% because large users already run dry storage, feeders and mixers built around it. Liquid grows fastest at 6.6% CAGR since dialysis providers and drug manufacturers want dust-free, ready-to-dose solutions that cut preparation steps. Crystal and Pallets stay specialized, chosen where controlled dissolution rate outweighs purchase price.

By Application

Sub-SegmentKey Trend
Food and BeveragesPackaged bakery growth in Asia, Africa and South America
PharmaceuticalsDialysis, antacid and injectable bicarbonate demand
Animal FeedBuffering in high-concentrate dairy and feedlot diets
IndustrialDry sorbent injection under MATS, IED and Chinese ultra-low emission rules
Water TreatmentAlkalinity and corrosion control under tighter lead limits
OthersPersonal care, household cleaning, cosmetics and textile processing

Food and Beverages leads at 30.4%, reflecting the compound's established role in leavening and acidity control across packaged foods. Industrial grows fastest at 6.9% CAGR because power plants, incinerators and steel mills are adopting dry sorbent injection to meet tightened acid-gas limits. Pharmaceuticals and Animal Feed add stable, mid-sized demand that is less exposed to industrial cycles.


Download PDF ×

We do not share your information with anyone. However, we may send you emails based on your report interest from time to time. You may contact us at any time to opt-out.