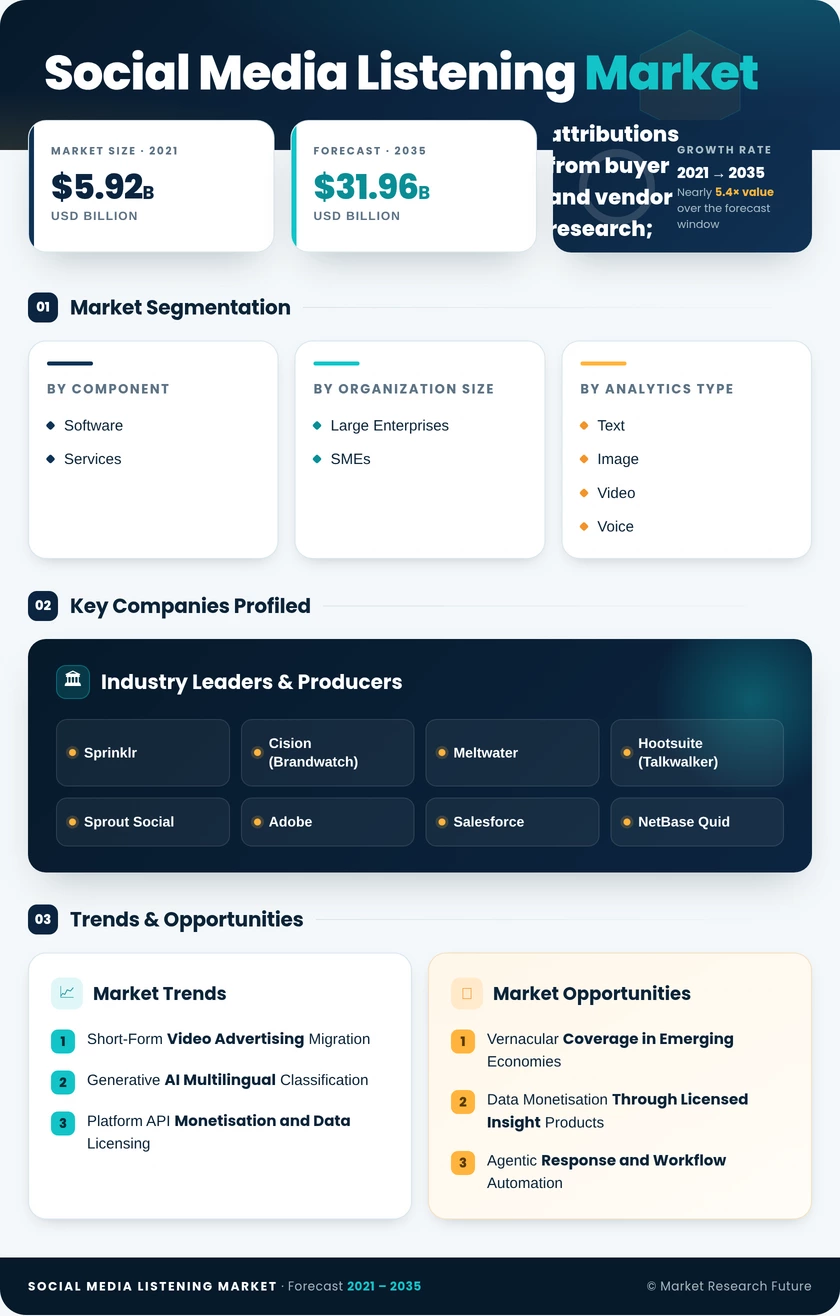
Social Media Listening Market (2026 – 2035)

ID: MRFR/ICT/10149-HCR 200 Pages Aarti Dhapte Last Updated: September 15, 2026
Social Media Listening Market Size, Share and Research Report By Component (Software, Services), By Organization Size (Large Enterprises, SMEs), By Analytics Type (Text, Image, Video, Voice), By Application (Brand Tracking, CX Management, Benchmarking, Lead Generation, Others), By Industry Vertical (Retail, BFSI, IT and Telecom, Media, Travel and Hospitality, Healthcare, Others) And By Region (North America, Europe, Asia-Pacific, And Rest Of The World) – Industry Forecast Till 2035
Social Media Listening Market
Market Size
Forecast Period2026-2035
CAGR (2026-2035)11.9%
2025 Market SizeUSD 9.97 Billion
2035 Market SizeUSD 31.96 Billion
Key Players
Sprinklr
Cision
Meltwater
Hootsuite
Sprout Social
Adobe
Opportunities
  • Vernacular Coverage in Emerging Economies
  • Data Monetisation Through Licensed Insight Products
  • Agentic Response and Workflow Automation
  1. 1 Market Summary | |
    1. 1.1 Study Assumptions & Market Definition | |
    2. 1.2 Scope of the Study | |
    3. 1.3 Research Methodology | |
  2. 2 Key Report Takeaways | |
    1. 2.1 By Component | |
    2. 2.2 By Organization Size | |
    3. 2.3 By Analytics Type | |
    4. 2.4 By Application | |
    5. 2.5 By Industry Vertical | |
    6. 2.6 By Region | |
  3. 3 Market Size and Forecast (2021–2035) | |
    1. 3.1 Historical Market Size (2021–2025) | |
    2. 3.2 Current & Forecast Market Size (2026–2035) | |
    3. 3.3 Market Size by Revenue (USD Billion) | |
    4. 3.4 Year-over-Year Growth Analysis | |
  4. 4 Driver Impact Analysis | |
    1. 4.1 Short-Form Video Advertising Migration | |
    2. 4.2 Generative AI Multilingual Classification | |
    3. 4.3 Platform API Monetisation and Data Licensing | |
    4. 4.4 Crisis Detection and Enterprise Risk Mandates | |
    5. 4.5 SME Adoption via Usage-Based Pricing | |
    6. 4.6 Commerce and Retail Media Integration | |
    7. 4.7 Compliance-Driven Audit Trail Requirements | |
  5. 5 Restraints Impact Analysis | |
    1. 5.1 Rising Platform Data Access Costs | |
    2. 5.2 Privacy Regulation and Consent Constraints | |
    3. 5.3 Accuracy Gaps in Low-Resource Languages | |
    4. 5.4 Shortage of Analytics Operations Talent | |
    5. 5.5 ROI Substantiation Burden | |
  6. 6 Opportunities | |
    1. 6.1 Vernacular Coverage in Emerging Economies | |
    2. 6.2 Data Monetisation Through Licensed Insight Products | |
    3. 6.3 Agentic Response and Workflow Automation | |
    4. 6.4 Regulated-Vertical Compliance Packages | |
    5. 6.5 Commerce Signal Integration for Mid-Market Retailers | |
  7. 7 Regional Market Share and Country-Level Analysis | |
    1. 7.1 North America | | |
      1. 7.1.1 US | | |
      2. 7.1.2 Canada | | |
      3. 7.1.3 Mexico | |
    2. 7.2 Europe | | |
      1. 7.2.1 Germany | | |
      2. 7.2.2 UK | | |
      3. 7.2.3 France | | |
      4. 7.2.4 Italy | | |
      5. 7.2.5 Spain | | |
      6. 7.2.6 Nordic Countries | | |
      7. 7.2.7 Russia | | |
      8. 7.2.8 Rest of Europe | |
    3. 7.3 Asia-Pacific | | |
      1. 7.3.1 China | | |
      2. 7.3.2 India | | |
      3. 7.3.3 Japan | | |
      4. 7.3.4 South Korea | | |
      5. 7.3.5 ASEAN | | |
      6. 7.3.6 Rest of Asia-Pacific | |
    4. 7.4 South America | | |
      1. 7.4.1 Brazil | | |
      2. 7.4.2 Argentina | | |
      3. 7.4.3 Rest of South America | |
    5. 7.5 Middle East & Africa | | |
      1. 7.5.1 Saudi Arabia | | |
      2. 7.5.2 UAE | | |
      3. 7.5.3 South Africa | | |
      4. 7.5.4 Egypt | | |
      5. 7.5.5 Rest of MEA | |
  8. 8 Future Outlook (2026–2035) | |
    1. 8.1 Agentic Operations Replace Dashboard Consumption | |
    2. 8.2 Platform Economics and Data Access Consolidation | |
    3. 8.3 Multimodal Parity and the End of Text Primacy | |
    4. 8.4 Sustainability and Conduct Claims Verification | |
  9. 9 Segmentation Analysis | |
    1. 9.1 By Component | | |
      1. 9.1.1 Software | | |
      2. 9.1.2 Services | |
    2. 9.2 By Organization Size | | |
      1. 9.2.1 Large Enterprises | | |
      2. 9.2.2 SMEs | |
    3. 9.3 By Analytics Type | | |
      1. 9.3.1 Text | | |
      2. 9.3.2 Image | | |
      3. 9.3.3 Video | | |
      4. 9.3.4 Voice | |
    4. 9.4 By Application | | |
      1. 9.4.1 Brand Tracking | | |
      2. 9.4.2 CX Management | | |
      3. 9.4.3 Benchmarking | | |
      4. 9.4.4 Lead Generation | | |
      5. 9.4.5 Others | |
    5. 9.5 By Industry Vertical | | |
      1. 9.5.1 Retail | | |
      2. 9.5.2 BFSI | | |
      3. 9.5.3 IT and Telecom | | |
      4. 9.5.4 Media | | |
      5. 9.5.5 Travel and Hospitality | | |
      6. 9.5.6 Healthcare | | |
      7. 9.5.7 Others | |
  10. 10 Competitive Landscape | |
    1. 10.1 Market Concentration Analysis (2026) | |
    2. 10.2 Competitive Benchmarking Matrix | |
    3. 10.3 Company Profiles | |
  11. 11 Recent News & Developments | |
  12. 12 Report Scope and Methodology | |
  13. 13 Detailed Sources and Citations | |
  14. 14 Frequently Asked Questions | | LIST OF TABLES | |
  15. TABLE 1 Global Social Media Listening Market Size & Forecast, by Revenue (USD Billion), 2021–2035 | |
  16. TABLE 2 Global Social Media Listening Market – Year-over-Year Growth Analysis, 2021–2035 | |
  17. TABLE 3 Driver Impact Analysis Matrix, 2026–2035 | |
  18. TABLE 4 Restraint Impact Analysis Matrix, 2026–2035 | |
  19. TABLE 5 Global Social Media Listening Market Size, by Region, 2021–2035 (USD Billion) | |
  20. TABLE 6 North America Social Media Listening Market Size, by Country, 2021–2035 (USD Billion) | |
  21. TABLE 7 Europe Social Media Listening Market Size, by Country, 2021–2035 (USD Billion) | |
  22. TABLE 8 Asia-Pacific Social Media Listening Market Size, by Country, 2021–2035 (USD Billion) | |
  23. TABLE 9 South America Social Media Listening Market Size, by Country, 2021–2035 (USD Billion) | |
  24. TABLE 10 Middle East & Africa Social Media Listening Market Size, by Country, 2021–2035 (USD Billion) | |
  25. TABLE 11 Global Social Media Listening Market Size, by Component, 2021–2035 (USD Billion) | |
  26. TABLE 12 Global Social Media Listening Market Size, by Organization Size, 2021–2035 (USD Billion) | |
  27. TABLE 13 Global Social Media Listening Market Size, by Analytics Type, 2021–2035 (USD Billion) | |
  28. TABLE 14 Global Social Media Listening Market Size, by Application, 2021–2035 (USD Billion) | |
  29. TABLE 15 Global Social Media Listening Market Size, by Industry Vertical, 2021–2035 (USD Billion) | |
  30. TABLE 16 Competitive Benchmarking Matrix – Global Social Media Listening Market, 2026 | |
  31. TABLE 17 Company Profiles – Key Players, Global Social Media Listening Market | |
  32. TABLE 18 Recent Developments & Strategic Announcements, 2023–2025 | |
  33. TABLE 19 Report Scope & Methodology Summary | |
  34. TABLE 20 Detailed Sources and Citations Index | | LIST OF FIGURES | |
  35. FIGURE 1 Market Dynamics – Drivers, Restraints, and Opportunities | |
  36. FIGURE 2 Industry Value Chain Analysis | |
  37. FIGURE 3 Porter's Five Forces Analysis | |
  38. FIGURE 4 Global Market Size Trend, 2021–2035 (USD Billion) | |
  39. FIGURE 5 Year-over-Year Growth Trend, 2022–2035 (%) | |
  40. FIGURE 6 Market Share by Component, 2025 (%) | |
  41. FIGURE 7 Market Share by Organization Size, 2025 (%) | |
  42. FIGURE 8 Market Share by Analytics Type, 2025 (%) | |
  43. FIGURE 9 Market Share by Application, 2025 (%) | |
  44. FIGURE 10 Market Share by Industry Vertical, 2025 (%) | |
  45. FIGURE 11 Regional Revenue Share, 2025 (%) | |
  46. FIGURE 12 Regional CAGR Comparison, 2026–2035 (%) | |
  47. FIGURE 13 Competitive Landscape – Estimated Revenue Share Bands, 2026 | |
  48. FIGURE 14 Vendor Positioning Matrix – Capability vs Data Access Breadth

Segmentation Quick Reference

DimensionSub-SegmentsDominant SegmentFastest Growing Segment
By ComponentSoftware; ServicesSoftware (54.4% share, 2025)Services (13.6% CAGR, 2026–2035)
By Organization SizeLarge Enterprises; SMEsLarge Enterprises (USD 6.54 Billion, 2025)SMEs (12.0% CAGR, 2026–2035)
By Analytics TypeText; Image; Video; VoiceText (43.4% share, 2025)Video (14.2% CAGR, 2026–2035)
By ApplicationBrand Tracking; CX Management; Benchmarking; Lead Generation; OthersBrand Tracking (30.4% share, 2025)Lead Generation (14.7% CAGR, 2026–2035)
By Industry VerticalRetail; BFSI; IT and Telecom; Media; Travel and Hospitality; Healthcare; OthersRetail (27.0% share, 2025)Travel and Hospitality (15.0% CAGR, 2026–2035)


Market Segmentation Overview

By Component

Sub-SegmentKey Trend
SoftwareEmbedded generative classifiers reduce reliance on manual review pods
ServicesManaged multilingual review and audit documentation attached to licences


Software holds the larger share because licence renewals are predictable and vendors keep absorbing capability that once demanded consulting hours. Services nonetheless expand faster, since automated classification increases rather than reduces the need for specialists who design taxonomies and defend methodology to auditors. Regulated buyers in banking and healthcare will not accept an insight they cannot evidence, which sustains long-duration services contracts alongside increasingly automated software.

By Organization Size

Sub-SegmentKey Trend
Large EnterprisesMulti-region deployments integrated with CRM and care platforms
SMEsFreemium and metered entry tiers with pre-configured vertical dashboards


Large Enterprises dominate revenue through multi-brand rollouts that carry heavy governance and integration requirements, and their contracts typically span three years. SMEs grow faster because pricing floors collapsed and onboarding compressed to hours, letting a single marketer run coverage that once needed a dedicated team. Lighter internal governance also makes smaller firms earlier adopters of generative features, which vendors use as low-risk proving grounds ahead of enterprise release.

By Analytics Type

Sub-SegmentKey Trend
TextMature classifiers deliver the lowest processing cost per mention
ImageLogo and packaging detection captures signal text cannot carry
VideoExpression, tone, and on-screen text analysis moves from sampling to full coverage
VoicePodcast and live-audio mention capture improves with transcription accuracy


Text remains the anchor modality on volume and cost efficiency, and it will still lead in 2035. Video grows fastest as short-form formats absorb consumer attention and per-minute inference costs decline, pushing vendors from sampled to exhaustive processing. Image sits between the two, valuable for surveillance of packaging and logo misuse where no text exists, while Voice stays smallest because live-audio transcription accuracy still constrains reliable sentiment scoring.

By Application

Sub-SegmentKey Trend
Brand TrackingContinuous perception measurement and share-of-voice reporting
CX ManagementSentiment-triggered routing into care queues
BenchmarkingCategory and competitor positioning analysis
Lead GenerationIntent signal extraction ahead of form submission
OthersCrisis management, influencer vetting, and product research workloads


Brand Tracking leads on installed base because it is usually the first workload deployed and the last one cancelled. Lead Generation grows fastest, since it attaches to revenue budgets and converts social intent into pipeline before prospects reach a web form. CX Management retains strong value through care-platform integration, and crisis workloads inside Others carry the highest per-seat pricing because sub-hour detection carries direct litigation and equity exposure.

By Industry Vertical

Sub-SegmentKey Trend
RetailSentiment feeds pricing, promotion, and merchandising decisions
BFSIConduct monitoring and trust perception tracking under regulator scrutiny
IT and TelecomOutage detection and support deflection at scale
MediaAudience response measurement shaping content programming
Travel and HospitalityProactive service recovery to rebuild loyalty
HealthcarePatient experience tracking and adverse-event signal detection
OthersEducation, public sector, and industrial brand protection


Retail leads spending because perception shifts convert into merchandising and pricing actions within days, giving the clearest payback story. Travel and Hospitality grows fastest as airlines and hotel groups catch booking and app complaints before review scores move, a workflow that directly protects loyalty revenue. BFSI generates outsized value per account given conduct-monitoring obligations, while Healthcare accelerates on pharmacovigilance signal detection that can surface adverse events ahead of formal reporting channels.




Download PDF ×

We do not share your information with anyone. However, we may send you emails based on your report interest from time to time. You may contact us at any time to opt-out.