ID: MRFR/CR/9319-HCR | March 2022 | Region: Global | 100 Pages
Table of Contents
1. EXECUTIVE SUMMARY
1.1. Market Attractiveness Analysis
1.1.1. Global Smart Oven Market, by Type
1.1.2. Global Smart Oven Market, by Structure
1.1.3. Global Smart Oven Market, by Capacity
1.1.4. Global Smart Oven Market, by End User
1.1.5. Global Smart Oven Market, by Region
2. MARKET INTRODUCTION
2.1. Definition
2.2. Scope of the Study
2.3. Market Structure
3. RESEARCH METHODOLOGY
3.1. Research Process
3.2. Primary Research
3.3. Secondary Research
3.4. Market Size Estimation
3.5. Forecast Model
3.6. List of Assumptions & Assumptions
4. MARKET DYNAMICS
4.1. Introduction
4.2. Drivers
4.3. Restraints
4.4. Opportunities
5. MARKET FACTOR ANALYSIS
5.1. Supply Chain Analysis
5.1.1. Raw Material Suppliers
5.1.2. Smart Oven Manufacturers
5.1.3. Distribution & Sales Channel
5.1.4. End Users
5.2. Porter’s Five Forces Model
5.2.1. Bargaining Power of Suppliers
5.2.2. Bargaining Power of Buyers
5.2.3. Threat of New Entrants
5.2.4. Threat of Substitutes
5.2.5. Intensity of Rivalry
5.3. Impact of COVID-19 on the Global Smart Oven Market
6. GLOBAL SMART OVEN MARKET, BY APPLICATION (USD MILLION)
6.1. Introduction
6.2. Single Function
6.2.1. Market Estimates & Forecast, by Region/Country, 2020–2030
6.3. Multiple Function
6.3.1. Market Estimates & Forecast, by Region/Country, 2020–2030
7. GLOBAL SMART OVEN MARKET, BY STRUCTURE (USD MILLION)
7.1. Introduction
7.2. Built-in Smart Ovens
7.2.1. Market Estimates & Forecast, by Region/Country, 2020–2030
7.3. Counter-Top
7.3.1. Market Estimates & Forecast, by Region/Country, 2020–2030
8. GLOBAL SMART OVEN MARKET, BY CAPACITY (USD MILLION)
8.1. Introduction
8.2. 20-25 Litres
8.2.1. Market Estimates & Forecast, by Region/Country, 2020–2030
8.3. 26-30 Litres
8.3.1. Market Estimates & Forecast, by Region/Country, 2020–2030
8.4. Above 30 Litres
8.4.1. Market Estimates & Forecast, by Region/Country, 2020–2030
9. GLOBAL SMART OVEN MARKET, BY END USER (USD MILLION)
9.1. Introduction
9.2. Restaurants
9.2.1. Market Estimates & Forecast, by Region/Country, 2020–2030
9.3. Gourmet Cafes
9.3.1. Market Estimates & Forecast, by Region/Country, 2020–2030
9.4. Confectionary Stores
9.4.1. Market Estimates & Forecast, by Region/Country, 2020–2030
9.5. Bakeries
9.5.1. Market Estimates & Forecast, by Region/Country, 2020–2030
9.6. Residential
9.6.1. Market Estimates & Forecast, by Region/Country, 2020–2030
9.7. Others
9.7.1. Market Estimates & Forecast, by Region/Country, 2020–2030
10. GLOBAL SMART OVEN MARKET, BY DISTRIBUTION CHANNEL (USD MILLION)
10.1. Introduction
10.2. Online
10.2.1. Market Estimates & Forecast, by Region/Country, 2020–2030
10.3. Offline
10.3.1. Market Estimates & Forecast, by Region/Country, 2020–2030
11. GLOBAL SMART OVEN MARKET, BY REGION (USD MILLION)
11.1. Overview
11.2. North America
11.2.1. US
11.2.2. Canada
11.2.3. Mexico
11.3. Europe
11.3.1. Germany
11.3.2. UK
11.3.3. France
11.3.4. Spain
11.3.5. Italy
11.3.6. Rest of Europe
11.4. Asia-Pacific
11.4.1. China
11.4.2. Japan
11.4.3. India
11.4.4. Australia & New Zealand
11.4.5. Rest of Asia-Pacific
11.5. Rest of the World
11.5.1. South America
11.5.2. Middle East
11.5.3. Africa
12. COMPETITIVE LANDSCAPE
12.1. Market Introduction
12.2. Recent Developments
12.2.1. Mergers/Acquisitions, Expansion, Investment, Partnership, Collaboration, Product Launch
12.3. Global Market Share Analysis
12.4. Competitive Benchmarking
13. COMPANY PROFILES
13.1. Bsh Home Appliances Corporation (Robert Bosch GmbH)
13.1.1. Company Overview
13.1.2. Financial Overview
13.1.3. Products Offered
13.1.4. Key Developments
13.1.5. SWOT Analysis
13.1.6. Key Strategies
13.2. Breville Group Limited
13.2.1. Company Overview
13.2.2. Financial Overview
13.2.3. Products Offered
13.2.4. Key Developments
13.2.5. SWOT Analysis
13.2.6. Key Strategies
13.3. Haier Group
13.3.1. Company Overview
13.3.2. Financial Overview
13.3.3. Products Offered
13.3.4. Key Developments
13.3.5. SWOT Analysis
13.3.6. Key Strategies
13.4. Electrolux AB
13.4.1. Company Overview
13.4.2. Financial Overview
13.4.3. Products Offered
13.4.4. Key Developments
13.4.5. SWOT Analysis
13.4.6. Key Strategies
13.5. Panasonic Corporation
13.5.1. Company Overview
13.5.2. Financial Overview
13.5.3. Products Offered
13.5.4. Key Developments
13.5.5. SWOT Analysis
13.5.6. Key Strategies
13.6. LG Electronics Inc.
13.6.1. Company Overview
13.6.2. Financial Overview
13.6.3. Products Offered
13.6.4. Key Developments
13.6.5. SWOT Analysis
13.6.6. Key Strategies
13.7. Sharp Corporation
13.7.1. Company Overview
13.7.2. Financial Overview
13.7.3. Products Offered
13.7.4. Key Developments
13.7.5. SWOT Analysis
13.7.6. Key Strategies
13.8. Samsung Electronics Co. Ltd.
13.8.1. Company Overview
13.8.2. Financial Overview
13.8.3. Products Offered
13.8.4. Key Developments
13.8.5. SWOT Analysis
13.8.6. Key Strategies
13.9. Sub-Zero Group Inc.
13.9.1. Company Overview
13.9.2. Financial Overview
13.9.3. Products Offered
13.9.4. Key Developments
13.9.5. SWOT Analysis
13.9.6. Key Strategies
13.10. Whirlpool Corporation
13.10.1. Company Overview
13.10.2. Financial Overview
13.10.3. Products Offered
13.10.4. Key Developments
13.10.5. SWOT Analysis
13.10.6. Key Strategies
14. APPENDIX
14.1.1. Discussion Blueprint
 
LIST OF TABLES
TABLE 1 Global Smart Oven Market, by Region, 2019-2030 (USD Million)
TABLE 2 Global Smart Oven Market, by Application, 2019-2030 (USD Million)
TABLE 3 Global Smart Oven Market, by Structure, 2019-2030 (USD Million)
TABLE 4 Global Smart Oven Market, by Capacity, 2019-2030 (USD Million)
TABLE 5 Global Smart Oven Market, by End User, 2019-2030 (USD Million)
TABLE 6 Global Smart Oven Market, by Distribution Channel, 2019-2030 (USD Million)
TABLE 7 North America: Smart Oven Market, by Country, 2019-2030 (USD Million)
TABLE 8 North America: Smart Oven Market, by Application, 2019-2030 (USD Million)
TABLE 9 North America: Smart Oven Market, by Structure, 2019-2030 (USD Million)
TABLE 10 North America: Smart Oven Market, by Capacity, 2019-2030 (USD Million)
TABLE 11 North America: Smart Oven Market, by End User, 2019-2030 (USD Million)
TABLE 12 North America: Smart Oven Market, by Distribution Channel, 2019-2030 (USD Million)
TABLE 13 US: Smart Oven Market, by Application, 2019-2030 (USD Million)
TABLE 14 US: Smart Oven Market, by Structure, 2019-2030 (USD Million)
TABLE 15 US: Smart Oven Market, by Capacity, 2019-2030 (USD Million)
TABLE 16 US: Smart Oven Market, by End User, 2019-2030 (USD Million)
TABLE 17 US: Smart Oven Market, by Distribution Channel, 2019-2030 (USD Million)
TABLE 18 Canada: Smart Oven Market, by Application, 2019-2030 (USD Million)
TABLE 19 Canada: Smart Oven Market, by Structure, 2019-2030 (USD Million)
TABLE 20 Canada: Smart Oven Market, by Capacity, 2019-2030 (USD Million)
TABLE 21 Canada: Smart Oven Market, by End User, 2019-2030 (USD Million)
TABLE 22 Canada: Smart Oven Market, by Distribution Channel, 2019-2030 (USD Million)
TABLE 23 Mexico: Smart Oven Market, by Application, 2019-2030 (USD Million)
TABLE 24 Mexico: Smart Oven Market, by Structure, 2019-2030 (USD Million)
TABLE 25 Mexico: Smart Oven Market, by Capacity, 2019-2030 (USD Million)
TABLE 26 Mexico: Smart Oven Market, by End User, 2019-2030 (USD Million)
TABLE 27 Mexico: Smart Oven Market, by Distribution Channel, 2019-2030 (USD Million)
TABLE 28 Europe: Smart Oven Market, by Country, 2019-2030 (USD Million)
TABLE 29 Europe: Smart Oven Market, by Application, 2019-2030 (USD Million)
TABLE 30 Europe: Smart Oven Market, by Structure, 2019-2030 (USD Million)
TABLE 31 Europe: Smart Oven Market, by Capacity, 2019-2030 (USD Million)
TABLE 32 Europe: Smart Oven Market, by End User, 2019-2030 (USD Million)
TABLE 33 Europe: Smart Oven Market, by Distribution Channel, 2019-2030 (USD Million)
TABLE 34 Germany: Smart Oven Market, by Application, 2019-2030 (USD Million)
TABLE 35 Germany: Smart Oven Market, by Structure, 2019-2030 (USD Million)
TABLE 36 Germany: Smart Oven Market, by Capacity, 2019-2030 (USD Million)
TABLE 37 Germany: Smart Oven Market, by End User, 2019-2030 (USD Million)
TABLE 38 Germany: Smart Oven Market, by Distribution Channel, 2019-2030 (USD Million)
TABLE 39 France: Smart Oven Market, by Application, 2019-2030 (USD Million)
TABLE 40 France: Smart Oven Market, by Structure, 2019-2030 (USD Million)
TABLE 41 France: Smart Oven Market, by Capacity, 2019-2030 (USD Million)
TABLE 42 France: Smart Oven Market, by End User, 2019-2030 (USD Million)
TABLE 43 France: Smart Oven Market, by Distribution Channel, 2019-2030 (USD Million)
TABLE 44 Italy: Smart Oven Market, by Application, 2019-2030 (USD Million)
TABLE 45 Italy: Smart Oven Market, by Structure, 2019-2030 (USD Million)\
TABLE 46 Italy: Smart Oven Market, by Capacity, 2019-2030 (USD Million)
TABLE 47 Italy: Smart Oven Market, by End User, 2019-2030 (USD Million)
TABLE 48 Italy: Smart Oven Market, by Distribution Channel, 2019-2030 (USD Million)
TABLE 49 Spain: Smart Oven Market, by Application, 2019-2030 (USD Million)
TABLE 50 Spain: Smart Oven Market, by Structure, 2019-2030 (USD Million)
TABLE 51 Spain: Smart Oven Market, by Capacity, 2019-2030 (USD Million)
TABLE 52 Spain: Smart Oven Market, by End User, 2019-2030 (USD Million)
TABLE 53 Spain: Smart Oven Market, by Distribution Channel, 2019-2030 (USD Million)
TABLE 54 UK: Smart Oven Market, by Application, 2019-2030 (USD Million)
TABLE 55 UK: Smart Oven Market, by Structure, 2019-2030 (USD Million)
TABLE 56 UK: Smart Oven Market, by Capacity, 2019-2030 (USD Million)
TABLE 57 UK: Smart Oven Market, by End User, 2019-2030 (USD Million)
TABLE 58 UK: Smart Oven Market, by Distribution Channel, 2019-2030 (USD Million)
TABLE 59 Rest of Europe: Smart Oven Market, by Application, 2019-2030 (USD Million)
TABLE 60 Rest of Europe: Smart Oven Market, by Structure, 2019-2030 (USD Million)
TABLE 61 Rest of Europe: Smart Oven Market, by Capacity, 2019-2030 (USD Million)
TABLE 62 Rest of Europe: Smart Oven Market, by End User, 2019-2030 (USD Million)
TABLE 63 Rest of Europe: Smart Oven Market, by Distribution Channel, 2019-2030 (USD Million)
TABLE 64 Asia-Pacific: Smart Oven Market, by Country, 2019-2030 (USD Million)
TABLE 65 Asia-Pacific: Smart Oven Market, by Application, 2019-2030 (USD Million)
TABLE 66 Asia-Pacific: Smart Oven Market, by Structure, 2019-2030 (USD Million)
TABLE 67 Asia-Pacific: Smart Oven Market, by Capacity, 2019-2030 (USD Million)
TABLE 68 Asia-Pacific: Smart Oven Market, by End User, 2019-2030 (USD Million)
TABLE 69 Asia-Pacific: Smart Oven Market, by Distribution Channel, 2019-2030 (USD Million)
TABLE 70 China: Smart Oven Market, by Application, 2019-2030 (USD Million)
TABLE 71 China: Smart Oven Market, by Structure, 2019-2030 (USD Million)
TABLE 72 China: Smart Oven Market, by Capacity, 2019-2030 (USD Million)
TABLE 73 China: Smart Oven Market, by End User, 2019-2030 (USD Million)
TABLE 74 China: Smart Oven Market, by Distribution Channel, 2019-2030 (USD Million)
TABLE 75 India: Smart Oven Market, by Application, 2019-2030 (USD Million)
TABLE 76 India: Smart Oven Market, by Structure, 2019-2030 (USD Million)
TABLE 77 India: Smart Oven Market, by Capacity, 2019-2030 (USD Million)
TABLE 78 India: Smart Oven Market, by End User, 2019-2030 (USD Million)
TABLE 79 India: Smart Oven Market, by Distribution Channel, 2019-2030 (USD Million)
TABLE 80 Japan: Smart Oven Market, by Application, 2019-2030 (USD Million)
TABLE 81 Japan: Smart Oven Market, by Structure, 2019-2030 (USD Million)
TABLE 82 Japan: Smart Oven Market, by Capacity, 2019-2030 (USD Million)
TABLE 83 Japan: Smart Oven Market, by End User, 2019-2030 (USD Million)
TABLE 84 Japan: Smart Oven Market, by Distribution Channel, 2019-2030 (USD Million)
TABLE 85 Australia & New Zealand: Smart Oven Market, by Application, 2019-2030 (USD Million)
TABLE 86 Australia & New Zealand: Smart Oven Market, by Structure, 2019-2030 (USD Million)
TABLE 87 Australia & New Zealand: Smart Oven Market, by Capacity, 2019-2030 (USD Million)
TABLE 88 Australia & New Zealand: Smart Oven Market, by End User, 2019-2030 (USD Million)
TABLE 89 Australia & New Zealand: Smart Oven Market, by Distribution Channel, 2019-2030 (USD Million)
TABLE 90 Rest of Asia-Pacific: Smart Oven Market, by Application, 2019-2030 (USD Million)
TABLE 91 Rest of Asia-Pacific: Smart Oven Market, by Structure, 2019-2030 (USD Million)
TABLE 92 Rest of Asia-Pacific: Smart Oven Market, by Capacity, 2019-2030 (USD Million)
TABLE 93 Rest of Asia-Pacific: Smart Oven Market, by End User, 2019-2030 (USD Million)
TABLE 94 Rest of Asia-Pacific: Smart Oven Market, by Distribution Channel, 2019-2030 (USD Million)
TABLE 95 Rest of the World (RoW): Smart Oven Market, by Region, 2019-2030 (USD Million)
TABLE 96 Rest of the World (RoW): Smart Oven Market, by Application, 2019-2030 (USD Million)
TABLE 97 Rest of the World (RoW): Smart Oven Market, by Structure, 2019-2030 (USD Million)
TABLE 98 Rest of the World (RoW): Smart Oven Market, by Capacity, 2019-2030 (USD Million)
TABLE 99 Rest of the World (RoW): Smart Oven Market, by End User, 2019-2030 (USD Million)
TABLE 100 Rest of the World (RoW): Smart Oven Market, by Distribution Channel, 2019-2030 (USD Million)
TABLE 101 South America: Smart Oven Market, by Application, 2019-2030 (USD Million)
TABLE 102 South America: Smart Oven Market, by Structure, 2019-2030 (USD Million)
TABLE 103 South America: Smart Oven Market, by Capacity, 2019-2030 (USD Million)
TABLE 104 South America: Smart Oven Market, by End User, 2019-2030 (USD Million)
TABLE 105 South America: Smart Oven Market, by Distribution Channel, 2019-2030 (USD Million)
TABLE 106 Middle East: Smart Oven Market, by Application, 2019-2030 (USD Million)
TABLE 107 Middle East: Smart Oven Market, by Structure, 2019-2030 (USD Million)
TABLE 108 Middle East: Smart Oven Market, by Capacity, 2019-2030 (USD Million)
TABLE 109 Middle East: Smart Oven Market, by End User, 2019-2030 (USD Million)
TABLE 110 Middle East: Smart Oven Market, by Distribution Channel, 2019-2030 (USD Million)
TABLE 111 Africa: Smart Oven Market, by Application, 2019-2030 (USD Million)
TABLE 112 Africa: Smart Oven Market, by Structure, 2019-2030 (USD Million)
TABLE 113 Africa: Smart Oven Market, by Capacity, 2019-2030 (USD Million)
TABLE 114 Africa: Smart Oven Market, by End User, 2019-2030 (USD Million)
TABLE 115 Africa: Smart Oven Market, by Distribution Channel, 2019-2030 (USD Million)
LIST OF FIGURES
FIGURE 1 Global Smart Oven Market Segmentation
FIGURE 2 Forecast Research Methodology
FIGURE 3 Five Forces Analysis of the Global Smart Oven Market
FIGURE 4 Value Chain of the Global Smart Oven Market
FIGURE 5 Share of the Global Smart Oven Market in 2021, by Country (%)
FIGURE 6 Global Smart Oven Market, by Region, 2019-2030
FIGURE 7 Global Smart Oven Market Share, by Application, 2021 (%)
FIGURE 8 Global Smart Oven Market, by Application, 2019–2030
FIGURE 9 Global Smart Oven Market Share, by Structure, 2021 (%)
FIGURE 10 Global Smart Oven Market, by Structure, 2019–2030
FIGURE 11 Global Smart Oven Market Share, by Capacity, 2021 (%)
FIGURE 12 Global Smart Oven Market, by Capacity, 2019–2030
FIGURE 13 Global Smart Oven Market Share, by End User, 2021 (%)
FIGURE 14 Global Smart Oven Market, by End User, 2019–2030
FIGURE 15 Global Smart Oven Market Share, by Distribution Channel, 2021 (%)
FIGURE 16 Global Smart Oven Market, by Distribution Channel, 2019–2030
$600 million
18%
North America
2022-2030
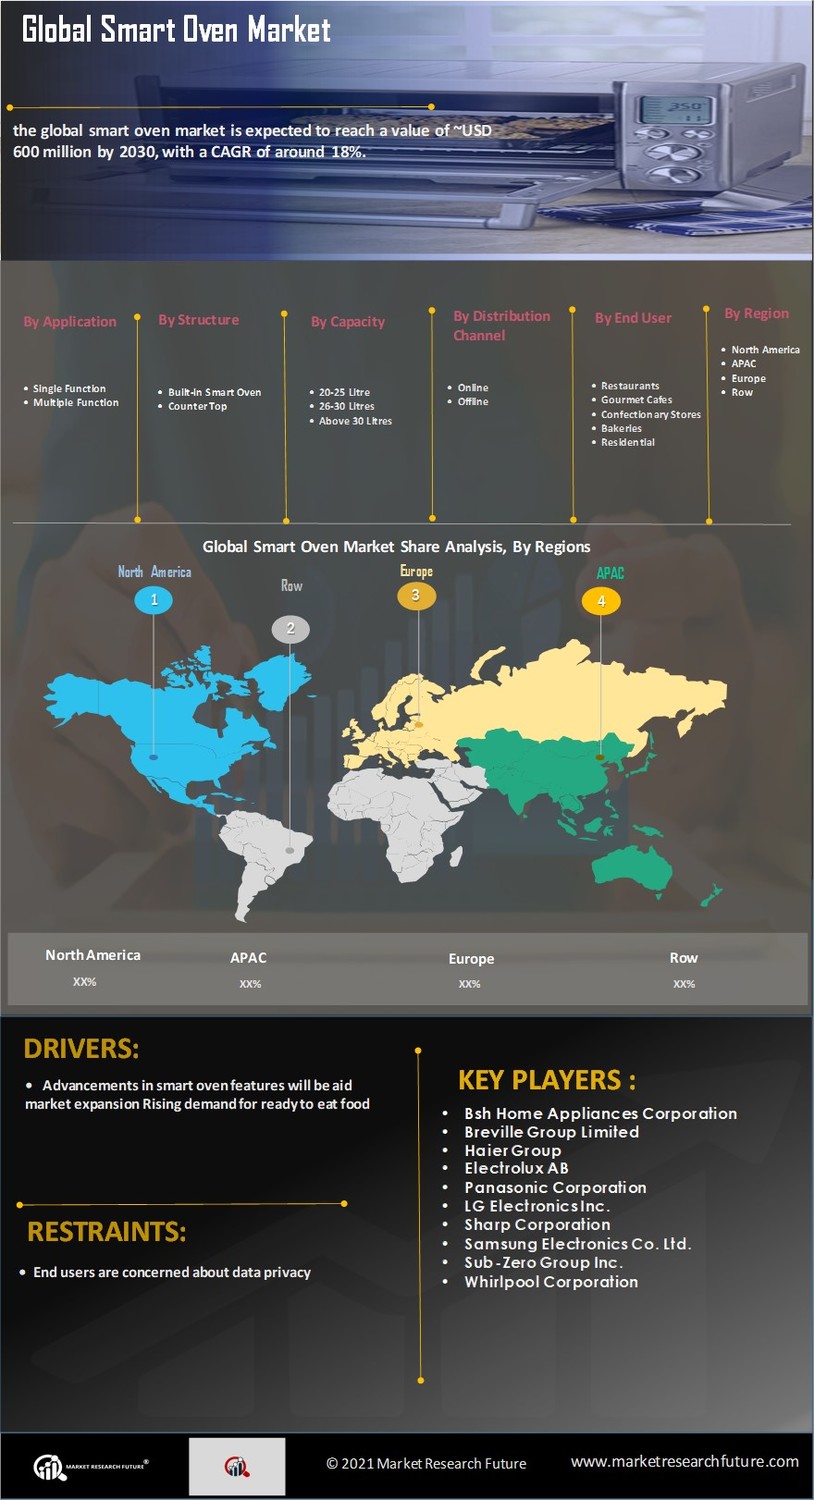
According to MRFR analysis, the global smart oven market is expected to reach a value of ~USD 600 million by 2030, with a CAGR of around 18%.
Smart ovens are the next generation of kitchen appliances, with advanced features that allow them to receive, process, and transmit data via smartphones. Smart ovens are electric microwaves that operate through Bluetooth or Wi-Fi capabilities. These ovens can be connected to other devices or accessed via an app. Consumers can control and regulate smart ovens remotely using the companion app. It's also possible to use it to program automatic functions.
In recent years, smart ovens with voice controls and smart home devices have been introduced. Voice control of connected smart ovens is possible with Amazon Echo or Google Home. These ovens have all of the features of standard ovens, plus additional settings and configurations.
COVID-19 Impact on Smart Oven Market
The distribution channel segment is further divided into two categories: online and offline. End users prefer buying kitchen appliances offline, so the offline distribution channel is expected to hold majority of the market share. However, due to the recent outbreak of the COVID-19 pandemic, the online distribution channel has seen a surge in demand. Due to the restrictions imposed during lockdown, the online channel is gaining traction. As a result, online sales have boosted the growth of the smart oven market in the current scenario. The introduction of an omnichannel strategy is expected to boost the wholesale market's growth. This channel promotes the idea of a single brand experience across multiple channels. These factors are favourable to the smart oven market's expansion.
Market Dynamics
Drivers:
Consumer appliances are always making progress and offering new features to meet the needs of modern-day consumers. Recently, a new smart oven concept was introduced at the International Home and Housewares Show. This oven is designed to allow users to easily manage their food, even when they are not home. The smart oven is equipped with a range of convenient features, such as voice control technology and alerts. The appliance also features a touchscreen panel with an intuitive interface that helps users easily access the features and set the oven without any trouble. These features are sure to help drive sales of the new oven and propel industry growth.
The demand for ready-to-eat food is increasing at a very rapid pace in the market across the globe. This trend is expected to continue in the long run, boosting the growth of the smart oven market. The market is mainly driven by rising demand for convenience food and the growing popularity of smart ovens in the industrial sector. The convenience aspect is further fueled by the increasing availability of ovens, freezers, and many other food facilities that help make the process of cooking and food preparation easier.
Restraints:
Smartphone and internet users are concerned about the potential misuse of their personal information, such as name, home address, email address, and credit card credentials, if shared and viewed. Furthermore, smart ovens are primarily controlled via smartphone applications developed by the company; consumer data is collected through these applications, raising consumer concerns about data privacy. As a result, privacy concerns could hinder the growth of the smart oven market.
Opportunities:
With the development of technology, there can be a new feature added in ovens that are voice-controlled. This feature will allow users to control their oven with a simple voice command. This is good for people with limited mobility because they can still use their oven, and it creates a lot of opportunities for smart oven demand to rise in the future.
Regulatory Framework
The Center for Devices and Radiological Health (CDRH) of the Food and Drug Administration (FDA) establishes and enforces performance standards for electronic products that emit radiation. Smart ovens must be built to meet the FDA's safety standards.
Microwave ovens must meet certain performance standards set by the FDA. Every microwave oven must have a label stating that it meets these performance requirements. All ovens must have a label that explains how to use them safely, according to the FDA.
Supply Chain Analysis:
The supply chain analysis is the process of evaluating every stage and step taken by stakeholders involved throughout the production and distribution of Smart Oven. The supply chain includes raw materials and suppliers, Smart Oven producers, distribution channels, and end-use industries. The distribution channel in this market comprises distributors and e-commerce merchants.
Segment Overview:
By Application
Based on application, the market is categorized into single and multiple functions. The multiple function segment held the largest market share in the global smart oven market for the year 2021 owing to several features such as the ability to select the perfect cooking functions for meals. This segment is expected to grow considerably during the forecast period.
By Structure
On the basis of structure, the global smart ovens market is segmented into built-in smart ovens and countertops. As of 2021, the countertop segment held the largest share in the global smart oven market. The countertop smart oven can be easily moved from one place to another and the ease of utilization makes it more efficient than a built-in smart oven.
By Capacity
Based on capacity, the global market is categorized into 20-25 litre, 26-30 litres, and above 30 litres. The 26-30 litres segment is estimated to hold majority of the shares in the global smart oven market in the year 2022.
By Distribution Channel
By distribution channel, the market is segmented into offline and online. The offline channel is expected to dominate the global smart oven market for the year 2022 while the online channel is projected to grow at the highest CAGR during the forecast period. Consumers tend to check the look and feel of the product before purchasing a regular kitchen appliance owing to which consumers prefer offline channels rather than online sources.
By End-User
Based on end-user, the global smart oven market has been segmented based on restaurants, gourmet cafes, confectionery stores, bakeries, and others. The restaurant segment accounted for the largest market in 2021 due to increased need for reducing the time of cooking. The cooking process is monitored by the chef in every step for its consistency and quality. However, these ovens with the latest technology help chefs in restaurants to cook food faster and consistently.
Regional Analysis:
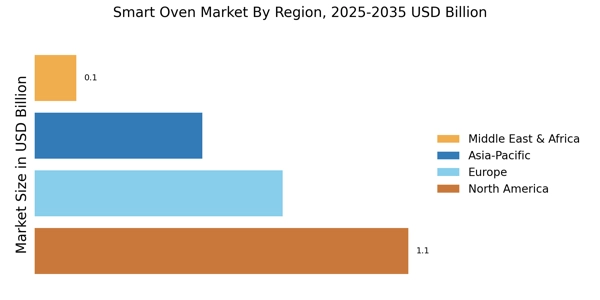
North America, Europe, Asia-Pacific, and the Rest of the World are the key regions analyzed in the study. As of 2021, North America was estimated to dominate the smart oven market due to rising disposable income and growing demand from the construction industry. In terms of new technology and infrastructure, North America and Europe are at the forefront. The demand for smart ovens has grown in response to the construction industry's continued growth and consumer preferences for trendy kitchen appliances. As a result, manufacturers are eager to take advantage of lucrative opportunities in these regional markets. Furthermore, in comparison to other regions, these regions are bringing in faster and new advancements in smart oven technologies. Asia Pacific region is expected to grow at the highest CAGR during the forecast period due to the adoption of Internet of things (IoT) enabled devices by consumers. Furthermore, rising population and urbanization are expected to drive the market in future in the Asia Pacific region.
Competitive Landscape:
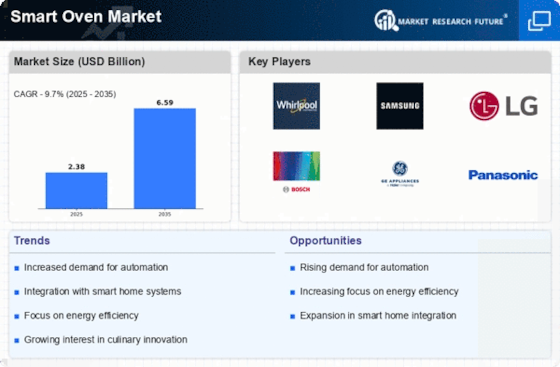
Some of the key companies profiled in the global smart oven market include Bsh Home Appliances Corporation (Robert Bosch GmbH), Breville Group Limited, Haier Group, Electrolux AB, Panasonic Corporation, LG Electronics Inc., Sharp Corporation, Samsung Electronics Co. Ltd., Sub-Zero Group Inc., and Whirlpool Corporation among others.
Scope of the Report:
Global Smart Oven Market, by Application
Global Smart Oven Market, by Structure
Global Smart Oven Market, by Capacity
Global Smart Oven Market, by End User
Global Smart Oven Market, by Distribution Channel
Global Smart Oven Market, by Region
Objectives of the Study
The objectives of the study are summarized in 5 stages. They are as mentioned below:
Market Size and Forecast:
To identify and estimate the market size for the global Smart Oven market segmented by structure, application, capacity, End-User and distribution channel by value (in US dollars). Also, to understand the consumption/ demand created by consumers of Smart Oven during the period of 2019-2030
Market Landscape and Trends:
To identify and infer, the drivers, restraints, opportunities and challenges for the global Smart Oven market
Market Influencing Factors:
To find out the factors which are affecting the sales of Smart Oven among consumers
Impact of COVID-19:
To identify and understand the various factors involved in the global Smart Oven market affected by the pandemic
Company Profiling:
To provide a detailed insight into the major companies operating in the market. The profiling will include the financial health of the company past 2-3 years with segmental and regional revenue breakup, product offering, recent developments, SWOT analysis, and key strategies.
Intended Audience
Report Attribute/Metric | Details |
---|---|
Market Size | 2030: ~ USD 600 Million |
CAGR | ~ 18% |
Base Year | 2021 |
Forecast Period | 2022-2030 |
Historical Data | 2020, 2019 |
Forecast Units | Value (USD Million) |
Report Coverage | Revenue Forecast, Competitive Landscape, Growth Factors, and Trends |
Segments Covered | Type, Structure, Capacity, End-users |
Geographies Covered | North America, Europe, Asia-Pacific, Rest of the World |
Key Vendors | Bsh Home Appliances Corporation (Robert Bosch GmbH), Breville Group Limited, Haier Group, Electrolux AB, Panasonic Corporation, LG Electronics Inc., Sharp Corporation, Samsung Electronics Co. Ltd., Sub-Zero Group Inc., Whirlpool Corporation |
Key Market Opportunities | End users are concerned about data privacy |
Key Market Drivers | • Advancements in smart oven features will be aid market expansion Rising demand for ready to eat food |
Frequently Asked Questions (FAQ) :
The global Smart Oven market would register a growth of around 18%.
The use of Smart Oven in Household, Food and Beverage industries will play a prominent role in taking the market forward.
End users are concerned about data privacy could hamper market growth.