Smart Electricity Meter Market (2026 - 2035)

ID: MRFR/EnP/31144-CR 158 Pages Chitranshi Jaiswal Last Updated: October 24, 2026
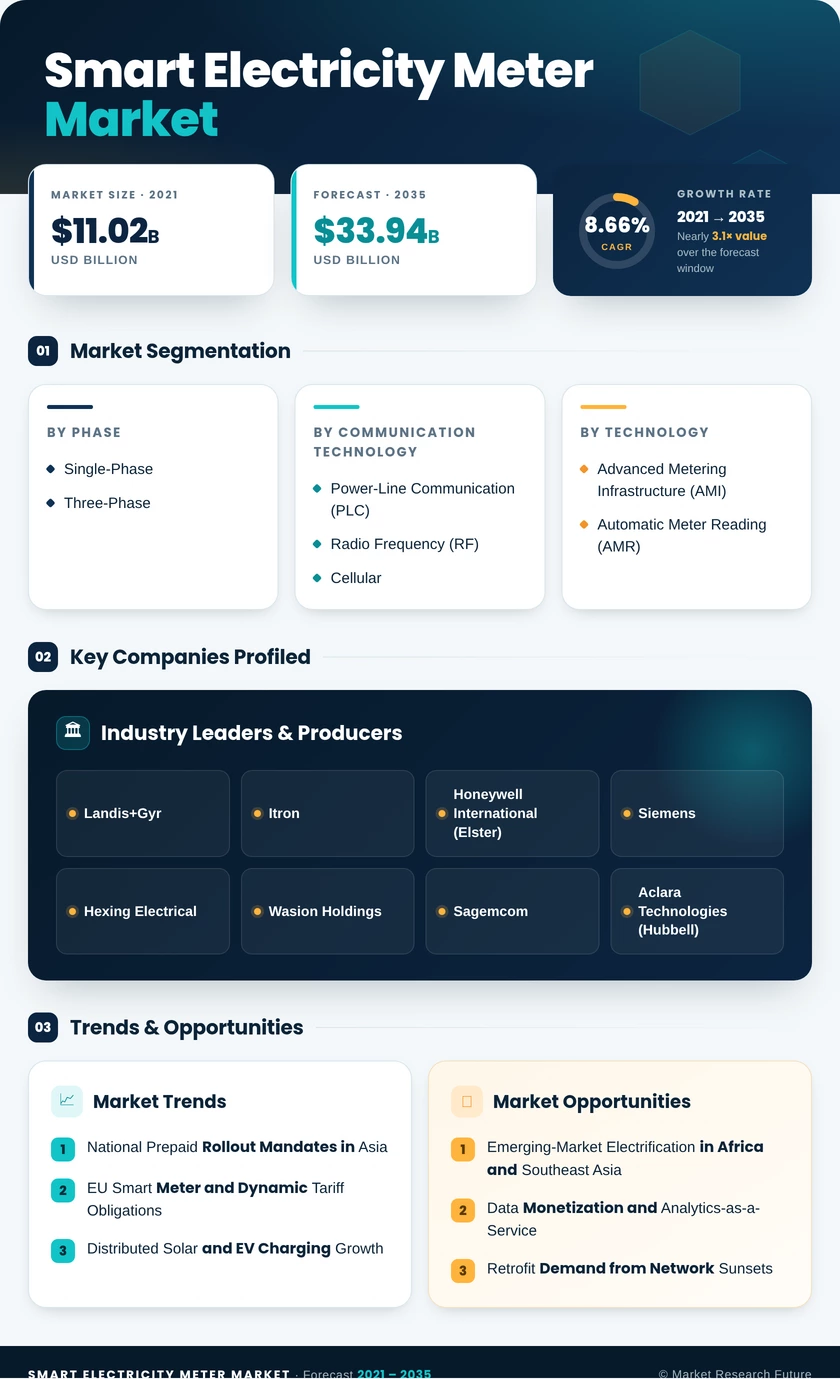
Smart Electricity Meter Market Research Report By Phase (Single-Phase, Three-Phase), By Communication Technology (Power-Line Communication (PLC), Radio Frequency (RF), Cellular), By Technology (Advanced Metering Infrastructure (AMI), Automatic Meter Reading (AMR)), By End-User (Residential, Commercial, Industrial), By Installation Mode (New Installations, Retrofits / Replacements) - Forecast to 2035
Smart Electricity Meter Market
Market Size
Forecast Period2026-2035
CAGR (2026-2035)8.66%
2025 Market SizeUSD 14.75 Billion
2035 Market SizeUSD 33.94 Billion
Key Players
Landis+Gyr
Itron
Honeywell International
Siemens
Hexing Electrical
Wasion Holdings
Opportunities
  • Emerging-Market Electrification in Africa and Southeast Asia
  • Data Monetization and Analytics-as-a-Service
  • Retrofit Demand from Network Sunsets
  1. 1 Market Summary | |
  2. 2 Key Report Takeaways | |
    1. 2.1 By Phase | |
    2. 2.2 By Communication Technology | |
    3. 2.3 By Technology | |
    4. 2.4 By End-User | |
    5. 2.5 By Installation Mode | |
    6. 2.6 By Region | |
  3. 3 Market Size and Forecast (2021–2035) | |
  4. 4 Driver Impact Analysis | |
    1. 4.1 National Prepaid Rollout Mandates in Asia | |
    2. 4.2 EU Smart Meter and Dynamic Tariff Obligations | |
    3. 4.3 Distributed Solar and EV Charging Growth | |
    4. 4.4 US Federal Grid Modernization Funding | |
    5. 4.5 Non-Technical Loss Reduction Targets | |
    6. 4.6 Falling Cellular IoT Module Costs | |
    7. 4.7 Revenue-Assurance Programs in the Gulf | |
  5. 5 Restraints Impact Analysis | |
    1. 5.1 High Upfront Capex and Service-Provider Financing Strain | |
    2. 5.2 Cybersecurity and Data Privacy Obligations | |
    3. 5.3 Interoperability Gaps with Legacy Fleets | |
    4. 5.4 Semiconductor and Component Supply Volatility | |
    5. 5.5 Consumer Resistance and Billing Disputes | |
  6. 6 Opportunities | |
    1. 6.1 Emerging-Market Electrification in Africa and Southeast Asia | |
    2. 6.2 Data Monetization and Analytics-as-a-Service | |
    3. 6.3 Retrofit Demand from Network Sunsets | |
    4. 6.4 Grid-Edge Flexibility for EVs and Distributed Energy | |
    5. 6.5 Carbon and ESG Metering for Commercial and Industrial Users | |
  7. 7 Regional Market Share and Country-Level Analysis | |
    1. 7.1 North America | | |
      1. 7.1.1 US | | |
      2. 7.1.2 Canada | | |
      3. 7.1.3 Mexico | |
    2. 7.2 Europe | | |
      1. 7.2.1 Germany | | |
      2. 7.2.2 UK | | |
      3. 7.2.3 France | | |
      4. 7.2.4 Italy | | |
      5. 7.2.5 Spain | | |
      6. 7.2.6 Nordic Countries | | |
      7. 7.2.7 Russia | | |
      8. 7.2.8 Rest of Europe | |
    3. 7.3 Asia-Pacific | | |
      1. 7.3.1 China | | |
      2. 7.3.2 India | | |
      3. 7.3.3 Japan | | |
      4. 7.3.4 South Korea | | |
      5. 7.3.5 ASEAN | | |
      6. 7.3.6 Rest of Asia-Pacific | |
    4. 7.4 South America | | |
      1. 7.4.1 Brazil | | |
      2. 7.4.2 Argentina | | |
      3. 7.4.3 Rest of South America | |
    5. 7.5 Middle East & Africa | | |
      1. 7.5.1 Saudi Arabia | | |
      2. 7.5.2 UAE | | |
      3. 7.5.3 South Africa | | |
      4. 7.5.4 Egypt | | |
      5. 7.5.5 Rest of MEA | |
  8. 8 Future Outlook (2026–2035) | |
    1. 8.1 Edge Intelligence Moves into the Meter | |
    2. 8.2 Service-Based Procurement Models | |
    3. 8.3 Electrification Raises the Value of Metering Data | |
    4. 8.4 A Second Replacement Wave Begins | |
  9. 9 Segmentation Analysis | |
    1. 9.1 By Phase | | |
      1. 9.1.1 Single-Phase | | |
      2. 9.1.2 Three-Phase | |
    2. 9.2 By Communication Technology | | |
      1. 9.2.1 Power-Line Communication (PLC) | | |
      2. 9.2.2 Radio Frequency (RF) | | |
      3. 9.2.3 Cellular | |
    3. 9.3 By Technology | | |
      1. 9.3.1 Advanced Metering Infrastructure (AMI) | | |
      2. 9.3.2 Automatic Meter Reading (AMR) | |
    4. 9.4 By End-User | | |
      1. 9.4.1 Residential | | |
      2. 9.4.2 Commercial | | |
      3. 9.4.3 Industrial | |
    5. 9.5 By Installation Mode | | |
      1. 9.5.1 New Installations | | |
      2. 9.5.2 Retrofits / Replacements | |
  10. 10 Competitive Landscape | |
    1. 10.1 Market Concentration Analysis | |
    2. 10.2 Competitive Benchmarking Matrix | |
  11. 11 Recent News & Developments | |
  12. 12 Report Scope and Methodology | |
  13. 13 Detailed Sources and Citations | |
  14. 14 Frequently Asked Questions (FAQs) | | LIST OF TABLES | |
  15. TABLE 1 Global Smart Electricity Meter Market Summary, 2025–2035 | |
  16. TABLE 2 Global Smart Electricity Meter Market Size & Forecast, by Revenue (USD Billion), 2021–2035 | |
  17. TABLE 3 Driver Impact Analysis, 2026–2035 | |
  18. TABLE 4 Restraints Impact Analysis, 2026–2035 | |
  19. TABLE 5 Global Smart Electricity Meter Market, Regional Summary, 2025 | |
  20. TABLE 6 North America Smart Electricity Meter Market, by Country, 2025 | |
  21. TABLE 7 Europe Smart Electricity Meter Market, by Country, 2025 | |
  22. TABLE 8 Asia-Pacific Smart Electricity Meter Market, by Country, 2025 | |
  23. TABLE 9 South America Smart Electricity Meter Market, by Country, 2025 | |
  24. TABLE 10 Middle East & Africa Smart Electricity Meter Market, by Country, 2025 | |
  25. TABLE 11 Global Smart Electricity Meter Market, by Phase, 2025 | |
  26. TABLE 12 Global Smart Electricity Meter Market, by Communication Technology, 2025 | |
  27. TABLE 13 Global Smart Electricity Meter Market, by Technology, 2025 | |
  28. TABLE 14 Global Smart Electricity Meter Market, by End-User, 2025 | |
  29. TABLE 15 Global Smart Electricity Meter Market, by Installation Mode, 2025 | |
  30. TABLE 16 Competitive Benchmarking Matrix, Global Smart Electricity Meter Market | |
  31. TABLE 17 Report Scope and Methodology | |
  32. TABLE 18 Detailed Sources and Citations | |
  33. TABLE 19 Segmentation Quick Reference | | LIST OF FIGURES | |
  34. FIGURE 1 Market Dynamics Overview — Drivers, Restraints, and Opportunities | |
  35. FIGURE 2 Smart Electricity Meter Value Chain Analysis | |
  36. FIGURE 3 Porter's Five Forces Analysis | |
  37. FIGURE 4 Global Smart Electricity Meter Market Size Trend, 2021–2035 (USD Billion) | |
  38. FIGURE 5 Market Share by Phase, 2025 | |
  39. FIGURE 6 Market Share by Communication Technology, 2025 | |
  40. FIGURE 7 Market Share by Technology, 2025 | |
  41. FIGURE 8 Market Share by End-User, 2025 | |
  42. FIGURE 9 Market Share by Installation Mode, 2025 | |
  43. FIGURE 10 Regional Market Share, 2025 | |
  44. FIGURE 11 Regional Growth Comparison, 2026–2035 | |
  45. FIGURE 12 Competitive Landscape — Vendor Revenue Share Ranges

Segmentation Quick Reference

DimensionSub-SegmentsDominant SegmentFastest Growing Segment
By PhaseSingle-Phase, Three-PhaseSingle-Phase (58.9% share)Three-Phase (9.72% CAGR)
By Communication TechnologyPower-Line Communication (PLC), Radio Frequency (RF), CellularPower-Line Communication (PLC) (41.2% share)Cellular (12.48% CAGR)
By TechnologyAdvanced Metering Infrastructure (AMI), Automatic Meter Reading (AMR)AMI (12.1% CAGR)AMI (12.1% CAGR)
By End-UserResidential, Commercial, IndustrialResidential (65.6% share)Industrial (10.61% CAGR)
By Installation ModeNew Installations, Retrofits / ReplacementsNew Installations (57.3% share)Retrofits / Replacements (10.2% CAGR)
By RegionNorth America, Europe, Asia-Pacific, South America, Middle East & AfricaAsia-Pacific (45.8% share)Middle East & Africa (11.2% CAGR)

Market Segmentation Overview

By Phase

Sub-SegmentKey Trend
Single-PhaseShift from first-time rollouts to firmware- and security-driven replacement
Three-PhaseHigher-value demand from EV chargers, solar inverters, and industrial feeders

Single-Phase meters lead because household connections make up most rollout volume in China, India, and the EU. Three-Phase meters grow faster since EV fast-chargers and rooftop solar require harmonic analysis and integrated disconnect relays that only three-phase designs provide. Their higher unit prices also make them disproportionately important to vendor margins.

By Communication Technology

Sub-SegmentKey Trend
Power-Line Communication (PLC)Continued use on European low-voltage networks
Radio Frequency (RF)Mesh networks remain standard for North American utilities
CellularNB-IoT and LTE-M gain share as module prices fall

Power-Line Communication (PLC) leads because European utilities can reuse existing low-voltage cables without building radio networks. Cellular grows fastest as eSIM provisioning and NB-IoT basement penetration remove the cost and coverage objections that once favored Radio Frequency (RF) mesh. Many utilities now combine RF in suburbs with cellular in dense urban blocks.

By Technology

Sub-SegmentKey Trend
Advanced Metering Infrastructure (AMI)Bidirectional control and edge analytics become standard
Automatic Meter Reading (AMR)Retrofit kits extend the life of legacy registers

AMI both leads and grows fastest because regulators funding grid digitization specify two-way communication for remote disconnection, tariff switching, and loss detection. Automatic Meter Reading (AMR) retains a role where budgets are limited, but its one-way design cannot support dynamic tariffs, so its share will keep shrinking.

By End-User

Sub-SegmentKey Trend
ResidentialNational prepaid and mandated household programs
CommercialSub-metering for cost allocation in retail and data centers
IndustrialPower-quality monitoring and emissions documentation

Residential users lead through mandated household rollouts across Asia and Europe. Industrial demand grows fastest because manufacturers use interval data to manage time-of-use costs, monitor power quality, and document Scope 2 emissions. Commercial buyers sit between the two, adding sub-meters to allocate energy costs across tenants and business units.

By Installation Mode

Sub-SegmentKey Trend
New InstallationsFirst-time rollouts in India, Southeast Asia, and Africa
Retrofits / ReplacementsEnd-of-life first-generation fleets and 2G/3G sunsets

New Installations lead because large first-time programs in India, Southeast Asia, and Africa still dominate unit volume. Retrofits / Replacements grow faster as US and Southern European fleets installed in the early 2010s reach end of life and network shutdowns strand legacy communication modules. Replacement buyers typically choose higher-specification meters, lifting revenue per unit.


Download PDF ×

We do not share your information with anyone. However, we may send you emails based on your report interest from time to time. You may contact us at any time to opt-out.