Energy & Power Market Segmentation
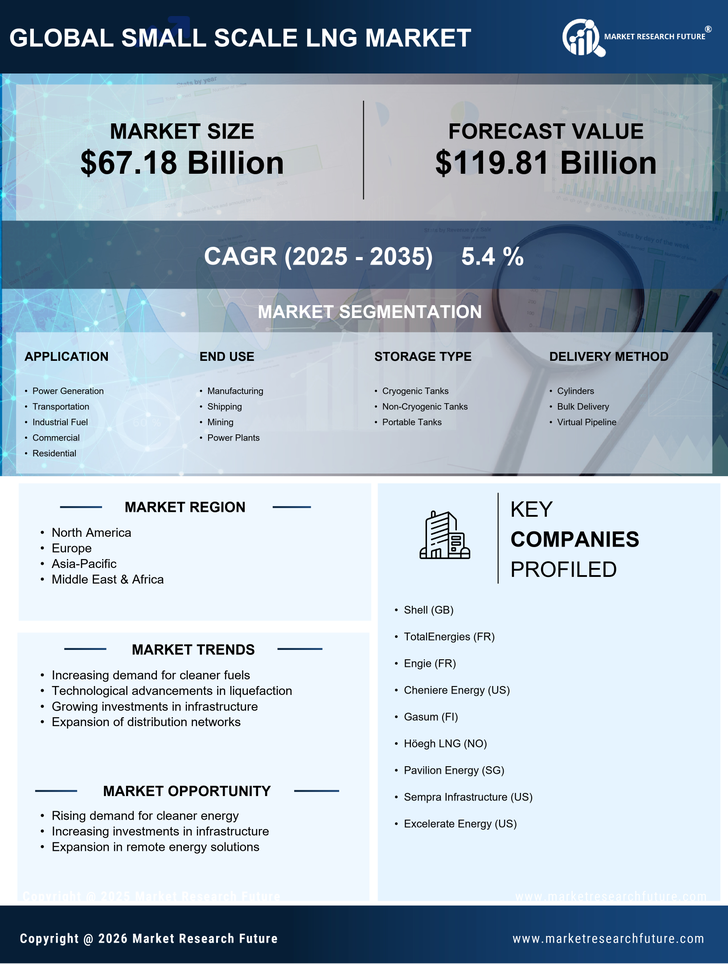
Energy & Power By Application (USD Billion, 2025-2035)
- Power Generation
- Transportation
- Industrial Fuel
- Commercial
- Residential
Energy & Power By End Use (USD Billion, 2025-2035)
- Manufacturing
- Shipping
- Mining
- Power Plants
Energy & Power By Storage Type (USD Billion, 2025-2035)
- Cryogenic Tanks
- Non-Cryogenic Tanks
- Portable Tanks
Energy & Power By Delivery Method (USD Billion, 2025-2035)
- Cylinders
- Bulk Delivery
- Virtual Pipeline