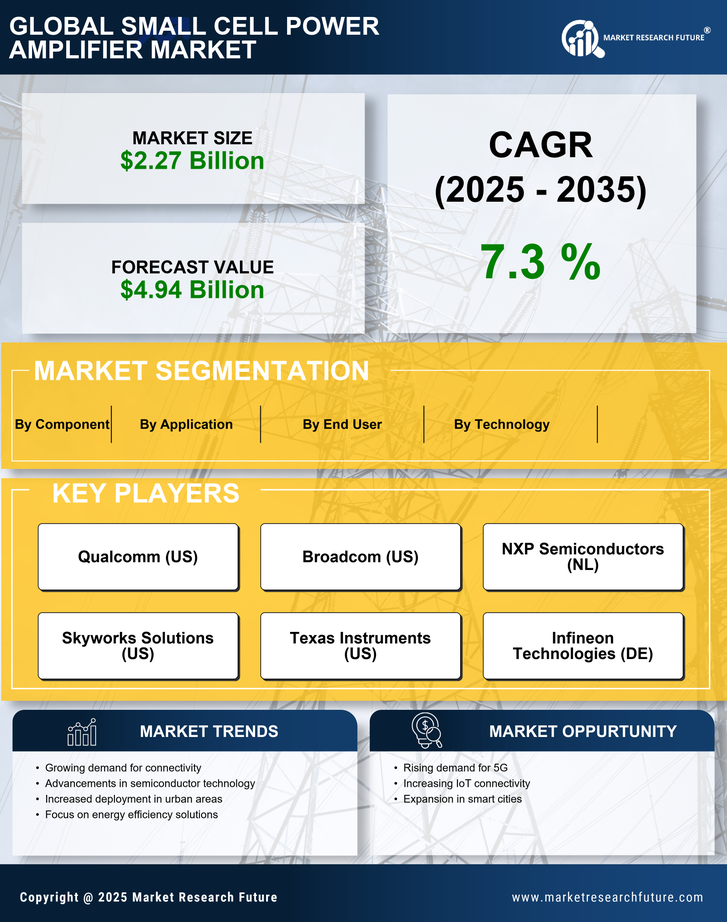
Certified Global Research Member
Isomar fd.webp Wcrc 57.webp
Key Questions Answered
  • Global Market Outlook
  • In-depth analysis of global and regional trends
  • Analyze and identify the major players in the market, their market share, key developments, etc.
  • To understand the capability of the major players based on products offered, financials, and strategies.
  • Identify disrupting products, companies, and trends.
  • To identify opportunities in the market.
  • Analyze the key challenges in the market.
  • Analyze the regional penetration of players, products, and services in the market.
  • Comparison of major players’ financial performance.
  • Evaluate strategies adopted by major players.
  • Recommendations
Why Choose Market Research Future?
  • Vigorous research methodologies for specific market.
  • Knowledge partners across the globe
  • Large network of partner consultants.
  • Ever-increasing/ Escalating data base with quarterly monitoring of various markets
  • Trusted by fortune 500 companies/startups/ universities/organizations
  • Large database of 5000+ markets reports.
  • Effective and prompt pre- and post-sales support.

Small Cell Power Amplifier Market Research Report Information By Gain In Amplifier (27.5 dB, 32 dB, 33 dB, 34 dB, 36 dB, 38 dB, 38.5 dB, 41.5 dB), By End-User (Customer Premises Equipment, Power Amplifier Driver, Wideband Instrumentation, Small Cell Base Stations, Data Cards With Terminals)- Industry Size, Share and Forecast 2027


ID: MRFR/SEM/1912-HCR | 100 Pages | Author: Aarti Dhapte| April 2024

Research Methodology on Small Cell Power Amplifier Market


The research methodology for the Market Research Future's Small Cell Power Amplifier Market report covers primary and secondary sources, market trends, drivers, and challenges. Analysis of the market has been conducted using various technical and fundamental analysis techniques including Porter's Five Forces analysis, SWOT analysis, and various data triangulation techniques. Below is an overview of the research methodology adopted:


Primary Research


A wide range of methodologies and approaches were included in the primary research phase of the study. Primary research involved interviews, surveys, and market-estimated applications. Interviews were conducted with industry experts, financial analysts, advisors, and other key industry stakeholders. Survey questionnaires were formatted to map and capture information related to usage patterns, competitive scenarios, and other industry trends. For secondary research, extensive databases, such as EBSCO, First Search, Emerald, ProQuest, OECD, etc., were used and relevant details were deduced from the various documents and materials. The primary research was further elaborated and compared based on the available data from various sources of information.


Secondary Research


Secondary research involved the description of processes, as well as gathering facts and details from market documents, such as relevant papers, articles, press releases, laws, and industry reports. The information was further analyzed, aggregated, and validated using various sources. Further, certain assumptions were made accordingly to ensure accurate data capture.


Market Size Estimation


The size of the market for Small Cell Power Amplifier was established based on top-down and bottom-up approaches, as well as data triangulation. In order to estimate the market size, information was collected from different manufacturers, suppliers, trade associations, and independent observers. The estimates were calculated by prevalent market trends and historical data.


Data Triangulation


The collected data obtained from different sources was structured and examined by confirming and validating qualitative and quantitative information. It was further validated to ensure its accuracy. After the confirmation and validation process, the data was further structured through the integration and correlation of both primary and secondary sources of data.


Market Forecast


In order to arrive at the historical growth rate, a compound annual growth rate (CAGR) for the historic year was used for the market forecast for 2023 to 2030. This was based on numerous factors, such as market conditions, patents issued, R&D, competitor analysis, and internal secondary research. The collected data were further screened and authenticated using authentic sources. This further helped in providing a precise assessment of the market situation.


Key Sources


- Industry experts


- Market research reports


- Primary research


- Press releases


- Company websites


- Secondary research


- Industry reports


- Industry associations


- Government publication

Leading companies partner with us for data-driven Insights
client_1 client_2 client_3 client_4 client_5 client_6 client_7 client_8 client_9 client_10
Please fill in Business Email for Quick Response

1 MARKET INTRODUCTION

1.1 INTRODUCTION

1.2 SCOPE OF STUDY

1.2.1 RESEARCH OBJECTIVE

1.2.2 ASSUMPTIONS

1.2.3 LIMITATIONS

1.3 MARKET STRUCTURE

2 RESEARCH METHODOLOGY

2.1 RESEARCH NETWORK GAIN IN AMPLIFIER

2.2 PRIMARY RESEARCH

2.3 SECONDARY RESEARCH

2.4 FORECAST MODEL

2.4.1 MARKET DATA COLLECTION, ANALYSIS & FORECAST

2.4.2 MARKET SIZE ESTIMATION

3 MARKET DYNAMICS

3.1 INTRODUCTION

3.2 MARKET DRIVERS

3.3 MARKET CHALLENGES

3.4 MARKET OPPORTUNITIES

3.5 MARKET RESTRAINTS

4 EXECUTIVE SUMMARY

5. MARKET FACTOR ANALYSIS

5.1 PORTER’S FIVE FORCES ANALYSIS

5.2 SUPPLY CHAIN ANALYSIS

6 SMALL CELL POWER AMPLIFIER MARKET, BY SEGMENTS

6.1 INTRODUCTION

6.2 MARKET STATISTICS

6.2.1 BY GAIN IN AMPLIFIER

6.2.1.1 27.5 dB

6.2.1.2 33 dB

6.2.1.3 34 dB

6.2.1.5 36 dB

6.2.1.6 41.5 dB

6.2.1.7 Others

6.2.2 BY END-USER

6.2.2.1 Customer Premises Equipment

6.2.2.2 Power Amplifier Driver

6.2.2.3 Wideband Instrumentation

6.2.2.4 Small Cell Base Stations

6.2.2.5 Data cards with Terminals

6.2.3 BY GEOGRAPHY

6.2.3.1 NORTH AMERICA

6.2.3.2 EUROPE

6.2.3.3 ASIA-PACIFIC

6.2.3.4 REST OF THE WORLD

7 COMPETITIVE ANALYSIS

7.1 MARKET SHARE ANALYSIS

7.2 COMPANY PROFILES

7.2.1 Texas Instrument (U.S.)

7.2.2 NXP Semiconductor (Netherlands)

7.2.3 Qorvo Inc. (U.S.)

7.2.4 Anadigics Inc. (U.S.)

7.2.5 RFHIC Corporation (U.S.)

7.2.6 Broadcom Corporation (U.S.)

7.2.7 TekTelic Communications Inc. (U.S.)

7.2.8 OTHERS
LIST OF TABLES
TABLE 1 SMALL CELL POWER AMPLIFIER MARKET, BY GAIN IN AMPLIFIER

TABLE 2 SMALL CELL POWER AMPLIFIER MARKET, BY END-USER

TABLE 3 SMALL CELL POWER AMPLIFIER MARKET, BY REGIONS

TABLE 4 NORTH AMERICA SMALL CELL POWER AMPLIFIER MARKET, BY GAIN IN AMPLIFIER

TABLE 5 NORTH AMERICA SMALL CELL POWER AMPLIFIER MARKET, BY END-USER

TABLE 6 U.S. SMALL CELL POWER AMPLIFIER MARKET, BY GAIN IN AMPLIFIER

TABLE 7 U.S. SMALL CELL POWER AMPLIFIER MARKET, BY END-USER

TABLE 8 CANADA SMALL CELL POWER AMPLIFIER MARKET, BY GAIN IN AMPLIFIER

TABLE 9 CANADA SMALL CELL POWER AMPLIFIER MARKET, BY END-USER

TABLE 10 EUROPE SMALL CELL POWER AMPLIFIER MARKET, BY GAIN IN AMPLIFIER

TABLE 11 EUROPE SMALL CELL POWER AMPLIFIER MARKET, BY END-USER

TABLE 12 GERMANY SMALL CELL POWER AMPLIFIER MARKET, BY GAIN IN AMPLIFIER

TABLE 13 GERMANY SMALL CELL POWER AMPLIFIER MARKET, BY END-USER

TABLE 14 FRANCE SMALL CELL POWER AMPLIFIER MARKET, BY GAIN IN AMPLIFIER

TABLE 15 FRANCE SMALL CELL POWER AMPLIFIER MARKET, BY END-USER

TABLE 16 U.K. SMALL CELL POWER AMPLIFIER MARKET, BY GAIN IN AMPLIFIER

TABLE 17 U.K. SMALL CELL POWER AMPLIFIER MARKET, BY END-USER

TABLE 18 REST OF EUROPE SMALL CELL POWER AMPLIFIER MARKET, BY GAIN IN AMPLIFIER

TABLE 19 REST OF EUROPE SMALL CELL POWER AMPLIFIER MARKET, BY END-USER

TABLE 20 ASIA-PACIFIC SMALL CELL POWER AMPLIFIER MARKET, BY GAIN IN AMPLIFIER

TABLE 21 ASIA-PACIFIC SMALL CELL POWER AMPLIFIER MARKET, BY END-USER

TABLE 22 MIDDLE EAST & AFRICA SMALL CELL POWER AMPLIFIER MARKET, BY GAIN IN AMPLIFIER

TABLE 23 MIDDLE EAST & AFRICA SMALL CELL POWER AMPLIFIER MARKET, BY END-USER


LIST OF FIGURES
FIGURE 1 RESEARCH NETWORK GAIN IN AMPLIFIER

FIGURE 2 SMALL CELL POWER AMPLIFIER MARKET: BY GAIN IN AMPLIFIER (%)

FIGURE 3 SMALL CELL POWER AMPLIFIER MARKET: BY END-USER (%)

FIGURE 4 SMALL CELL POWER AMPLIFIER MARKET: BY REGION

FIGURE 5 NORTH AMERICA SMALL CELL POWER AMPLIFIER MARKET, BY GAIN IN AMPLIFIER (%)

FIGURE 6 NORTH AMERICA SMALL CELL POWER AMPLIFIER MARKET, BY END-USER (%)

FIGURE 7 EUROPE SMALL CELL POWER AMPLIFIER MARKET, BY GAIN IN AMPLIFIER (%)

FIGURE 8 EUROPE SMALL CELL POWER AMPLIFIER MARKET, BY END-USER (%)

FIGURE 9 ASIA-PACIFIC SMALL CELL POWER AMPLIFIER MARKET, BY GAIN IN AMPLIFIER (%)

FIGURE 10 ASIA-PACIFIC SMALL CELL POWER AMPLIFIER MARKET, BY END-USER (%)

FIGURE 11 ROW SMALL CELL POWER AMPLIFIER MARKET, BY GAIN IN AMPLIFIER (%)

FIGURE 12 ROW SMALL CELL POWER AMPLIFIER MARKET, BY END-USER (%)

Purchase Option
Single User $ 4,950
Multiuser License $ 5,950
Enterprise User $ 7,250
Compare Licenses
Tailored for You
  • Dedicated Research on any specifics segment or region.
  • Focused Research on specific players in the market.
  • Custom Report based only on your requirements.
  • Flexibility to add or subtract any chapter in the study.
  • Historic data from 2014 and forecasts outlook till 2040.
  • Flexibility of providing data/insights in formats (PDF, PPT, Excel).
  • Provide cross segmentation in applicable scenario/markets.