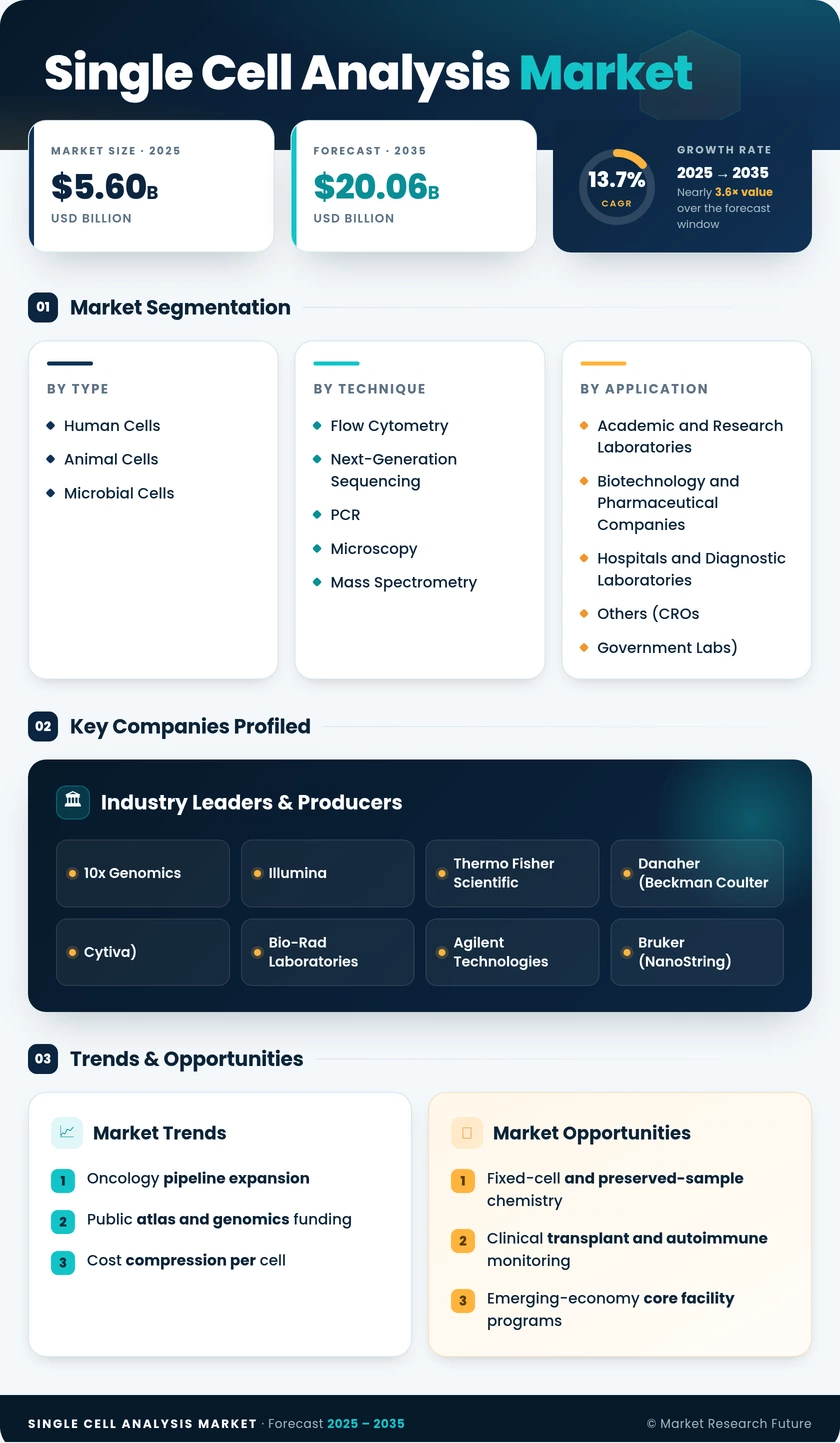
Single Cell Analysis Market (2025 - 2035)

ID: MRFR/LS/20119-HCR 200 Pages Nidhi Mandole Last Updated: September 10, 2026
Single Cell Analysis Market Research Report By Technology (Next Generation Sequencing, Polymerase Chain Reaction, Microscopy, Mass Spectrometry), By Application (Cancer Research, Genomics, Stem Cell Research, Immunology), By Product (Reagents, Instruments, Software, Consumables), By End Use (Academic Institutions, Research Laboratories, Pharmaceutical Companies, Clinical Laboratories) and By Regional (North America, Europe, South America, Asia Pacific, Middle East and Africa) - Growth & Industry Forecast 2025 To 2035
Single Cell Analysis Market
Market Size
Forecast Period2025-2035
CAGR (2025-2035)13.7%
2025 Market SizeUSD 5.60 Billion
2026 Market SizeUSD 6.32 Billion
2035 Market SizeUSD 20.06 Billion
Key Players
10x Genomics
Illumina
Thermo Fisher Scientific
Danaher (Beckman Coulter
Cytiva)
Bio-Rad Laboratories
Opportunities
  • Fixed-cell and preserved-sample chemistry
  • Clinical transplant and autoimmune monitoring
  • Emerging-economy core facility programs
  1. 1 Market Overview |
    1. 1.1 Study Assumptions & Market Definition |
    2. 1.2 Scope of the Study |
    3. 1.3 Research Methodology
  2. 2 Market Summary & Key Takeaways |
    1. 2.1 Key Takeaways by Technology |
    2. 2.2 Key Takeaways by Sector |
    3. 2.3 Key Takeaways by Geography
  3. 3 Market Size & Forecast (2021–2035) |
    1. 3.1 Historical Market Size (2021–2024) |
    2. 3.2 Base Year Estimate (2025) |
    3. 3.3 Forecast Market Size (2026–2035) |
    4. 3.4 Year-over-Year Growth Analysis
  4. 4 Market Drivers Analysis |
    1. 4.1 Oncology and Immuno-Oncology Pipeline Expansion |
    2. 4.2 Public Cell Atlas and Genomics Funding Programs |
    3. 4.3 Cost Compression per Cell |
    4. 4.4 Automation and Workflow Integration |
    5. 4.5 Driver Impact Weighting Matrix
  5. 5 Market Restraints Analysis |
    1. 5.1 Capital Cost Concentration |
    2. 5.2 Analytical Talent Scarcity |
    3. 5.3 Reimbursement Uncertainty |
    4. 5.4 Sample Quality and Data Overhead Constraints
  6. 6 Market Opportunity Analysis |
    1. 6.1 Fixed-Cell and Preserved-Sample Chemistry |
    2. 6.2 Clinical Transplant and Autoimmune Monitoring |
    3. 6.3 Emerging-Economy Core Facility Programs |
    4. 6.4 Reference Dataset and Software Monetisation |
    5. 6.5 Contract Research and Service-Model Growth |
    6. 6.6 Industry Value Chain Analysis |
    7. 6.7 Porter's Five Forces Analysis
  7. 7 Regional Analysis |
    1. 7.1 North America | |
      1. 7.1.1 US | |
      2. 7.1.2 Canada | |
      3. 7.1.3 Mexico |
    2. 7.2 Europe | |
      1. 7.2.1 Germany | |
      2. 7.2.2 UK | |
      3. 7.2.3 France | |
      4. 7.2.4 Italy | |
      5. 7.2.5 Spain | |
      6. 7.2.6 Nordic Countries | |
      7. 7.2.7 Russia | |
      8. 7.2.8 Rest of Europe |
    3. 7.3 Asia-Pacific | |
      1. 7.3.1 China | |
      2. 7.3.2 India | |
      3. 7.3.3 Japan | |
      4. 7.3.4 South Korea | |
      5. 7.3.5 ASEAN | |
      6. 7.3.6 Rest of Asia-Pacific |
    4. 7.4 South America | |
      1. 7.4.1 Brazil | |
      2. 7.4.2 Argentina | |
      3. 7.4.3 Rest of South America |
    5. 7.5 Middle East & Africa | |
      1. 7.5.1 Saudi Arabia | |
      2. 7.5.2 UAE | |
      3. 7.5.3 South Africa | |
      4. 7.5.4 Egypt | |
      5. 7.5.5 Rest of Middle East & Africa
  8. 8 Future Outlook (2026–2035) |
    1. 8.1 Machine Learning in Annotation and Experiment Design |
    2. 8.2 Platform Economics and Revenue Mix Shift |
    3. 8.3 Clinical Validation as the Growth Gate |
    4. 8.4 Sustainability and Consumable Waste Scrutiny
  9. 9 Segmentation Analysis |
    1. 9.1 By Product | |
      1. 9.1.1 Consumables | |
      2. 9.1.2 Instruments |
    2. 9.2 By Technique | |
      1. 9.2.1 Flow Cytometry | |
      2. 9.2.2 Next-Generation Sequencing | |
      3. 9.2.3 PCR | |
      4. 9.2.4 Microscopy | |
      5. 9.2.5 Mass Spectrometry | |
      6. 9.2.6 Microfluidics | |
      7. 9.2.7 RNA-FISH | |
      8. 9.2.8 Others |
    3. 9.3 By Cell Type | |
      1. 9.3.1 Human Cells | |
      2. 9.3.2 Animal Cells | |
      3. 9.3.3 Microbial Cells | |
      4. 9.3.4 Plant Cells |
    4. 9.4 By Workflow Step | |
      1. 9.4.1 Sample Preparation | |
      2. 9.4.2 Single-Cell Analysis | |
      3. 9.4.3 Data Analysis and Management |
    5. 9.5 By Application | |
      1. 9.5.1 Research Applications | |
      2. 9.5.2 Medical and Clinical Applications |
    6. 9.6 By End User | |
      1. 9.6.1 Academic and Research Laboratories | |
      2. 9.6.2 Biotechnology and Pharmaceutical Companies | |
      3. 9.6.3 Hospitals and Diagnostic Laboratories | |
      4. 9.6.4 Others (CROs, Government Laboratories)
  10. 10 Competitive Landscape |
    1. 10.1 Market Concentration Analysis |
    2. 10.2 Competitive Benchmarking Matrix |
    3. 10.3 Company Profiles | |
      1. 10.3.1 10x Genomics | |
      2. 10.3.2 Becton, Dickinson and Company | |
      3. 10.3.3 Illumina | |
      4. 10.3.4 Thermo Fisher Scientific | |
      5. 10.3.5 Danaher (Beckman Coulter, Cytiva) | |
      6. 10.3.6 Bio-Rad Laboratories | |
      7. 10.3.7 Agilent Technologies | |
      8. 10.3.8 Bruker (NanoString) | |
      9. 10.3.9 Standard BioTools | |
      10. 10.3.10 Qiagen | |
      11. 10.3.11 Merck KGaA | |
      12. 10.3.12 Miltenyi Biotec
  11. 11 Recent Developments & News
  12. 12 Report Scope & Methodology |
    1. 12.1 Study Period & Base Year |
    2. 12.2 Data Sources & Citations |
    3. 12.3 Abbreviations
  13. 13 Detailed Sources and Citations
  14. 14 Frequently Asked Questions
  15. 15 LIST OF TABLES |
  16. TABLE 1 Global Single Cell Analysis Market Size & Forecast, by Revenue (USD Billion), 2021–2035 |
  17. TABLE 2 Global Single Cell Analysis Market — Year-over-Year Growth Analysis, 2021–2035 |
  18. TABLE 3 Driver Impact Weighting Matrix, 2026–2035 |
  19. TABLE 4 Restraint Impact Weighting Matrix, 2026–2035 |
  20. TABLE 5 Global Market Size, by Region, 2021–2035 (USD Billion) |
  21. TABLE 6 North America Market Size, by Country, 2021–2035 (USD Billion) |
  22. TABLE 7 Europe Market Size, by Country, 2021–2035 (USD Billion) |
  23. TABLE 8 Asia-Pacific Market Size, by Country, 2021–2035 (USD Billion) |
  24. TABLE 9 South America Market Size, by Country, 2021–2035 (USD Billion) |
  25. TABLE 10 Middle East & Africa Market Size, by Country, 2021–2035 (USD Billion) |
  26. TABLE 11 Global Market Size, by Product, 2021–2035 (USD Billion) |
  27. TABLE 12 Global Market Size, by Technique, 2021–2035 (USD Billion) |
  28. TABLE 13 Global Market Size, by Cell Type, 2021–2035 (USD Billion) |
  29. TABLE 14 Global Market Size, by Workflow Step, 2021–2035 (USD Billion) |
  30. TABLE 15 Global Market Size, by Application, 2021–2035 (USD Billion) |
  31. TABLE 16 Global Market Size, by End User, 2021–2035 (USD Billion) |
  32. TABLE 17 North America Market Size, by Product and Technique, 2021–2035 (USD Billion) |
  33. TABLE 18 Europe Market Size, by Product and Technique, 2021–2035 (USD Billion) |
  34. TABLE 19 Asia-Pacific Market Size, by Product and Technique, 2021–2035 (USD Billion) |
  35. TABLE 20 South America Market Size, by Application and End User, 2021–2035 (USD Billion) |
  36. TABLE 21 Middle East & Africa Market Size, by Application and End User, 2021–2035 (USD Billion) |
  37. TABLE 22 Competitive Benchmarking Matrix, 2026 |
  38. TABLE 23 Company Profiles — Key Players |
  39. TABLE 24 Recent Developments & Strategic Announcements, 2023–2025 |
  40. TABLE 25 Report Scope & Methodology Summary |
  41. TABLE 26 Detailed Sources and Citations Index
  42. 16 LIST OF FIGURES |
  43. FIGURE 1 Market Dynamics — Drivers, Restraints and Opportunities Overview |
  44. FIGURE 2 Industry Value Chain Analysis |
  45. FIGURE 3 Porter's Five Forces Assessment |
  46. FIGURE 4 Global Market Size Trend and Forecast, 2021–2035 (USD Billion) |
  47. FIGURE 5 Year-over-Year Growth Trajectory, 2022–2035 |
  48. FIGURE 6 Revenue Share by Product, 2025 vs 2035 |
  49. FIGURE 7 Revenue Share by Technique, 2025 |
  50. FIGURE 8 Revenue Share by Cell Type, 2025 |
  51. FIGURE 9 Revenue Share by Workflow Step, 2025 |
  52. FIGURE 10 Revenue Share by Application, 2025 vs 2035 |
  53. FIGURE 11 Revenue Share by End User, 2025 |
  54. FIGURE 12 Regional Revenue Share Distribution, 2025 |
  55. FIGURE 13 Regional CAGR Comparison, 2026–2035 |
  56. FIGURE 14 North America Country-Level Share Breakdown, 2025 |
  57. FIGURE 15 Asia-Pacific Country-Level Share Breakdown, 2025 |
  58. FIGURE 16 Competitive Landscape — Estimated Revenue Share Positioning, 2026 |
  59. FIGURE 17 Strategic Positioning Matrix — Capability vs Scale |
  60. FIGURE 18 Merger and Acquisition Activity Timeline, 2023–2025

Segmentation Quick Reference

DimensionSub-SegmentsDominant SegmentFastest Growing Segment
By ProductConsumables; InstrumentsConsumablesInstruments
By TechniqueFlow Cytometry; Next-Generation Sequencing; PCR; Microscopy; Mass Spectrometry; OthersFlow CytometryNext-Generation Sequencing
By Cell TypeHuman Cells; Animal Cells; Microbial CellsHuman CellsMicrobial Cells
By Workflow StepSample Preparation; Single-Cell Analysis; Data Analysis and ManagementSingle-Cell AnalysisData Analysis and Management
By ApplicationResearch Applications; Medical and Clinical ApplicationsResearch ApplicationsMedical and Clinical Applications
By End UserAcademic and Research Laboratories; Biotechnology and Pharmaceutical Companies; Hospitals and Diagnostic Laboratories; OthersAcademic and Research LaboratoriesBiotechnology and Pharmaceutical Companies
By RegionNorth America; Europe; Asia-Pacific; South America; Middle East & AfricaNorth AmericaAsia-Pacific


Market Segmentation Overview

By Product

Sub-SegmentKey Trend
ConsumablesRecurring cartridge and reagent orders anchor supplier cash flow; competitive pricing pressure is rising as alternative chemistries enter
InstrumentsA 2018–2021 placement cohort reaches replacement age, pulling forward spectral and imaging upgrade decisions


Product economics remain the clearest structural feature here. Suppliers price instruments to place them and earn on what follows, which is why cartridge compatibility policy attracts more procurement scrutiny than specification sheets.

By Technique

Sub-SegmentKey Trend
Flow CytometrySpectral detection expands parameter counts without proportional cost increase; clinical validation already established
Next-Generation SequencingFalling per-cell cost enables million-cell experiments; multi-modal assays add protein and chromatin readouts
PCRRetains role in targeted validation and low-budget screening workflows
MicroscopyImaging-based methods add spatial context that dissociation-based approaches lose
Mass SpectrometryHigh-parameter proteomic and metabolic characterisation at cell resolution
OthersElectrophysiology, Raman and emerging label-free methods in early adoption


Technique selection has become a portfolio decision rather than a platform choice. Laboratories combine enrichment, sequencing, and imaging in sequence, which raises total consumable consumption per biological question.

By Cell Type

Sub-SegmentKey Trend
Human CellsClinical translation and disease atlas programs sustain the largest revenue base
Animal CellsPreclinical model characterisation and developmental biology drive steady demand
Microbial CellsAntimicrobial resistance and microbiome heterogeneity research expand rapidly as lysis chemistry improves


Human samples will continue to dominate spending, but microbial applications are producing the sharpest percentage growth as technical barriers around low RNA content ease.

By Workflow Step

Sub-SegmentKey Trend
Sample PreparationAutomation and fixation chemistry reduce batch effects and decouple collection from processing
Single-Cell AnalysisCore detection and library generation remain the highest-value workflow stage
Data Analysis and ManagementCompute, storage, and interpretation increasingly purchased as managed subscription services


Value is migrating downstream. Interpretation costs now rival reagent costs on large studies, which is reshaping where suppliers invest.

By Application

Sub-SegmentKey Trend
Research ApplicationsGrant-funded discovery and translational programs sustain majority revenue through 2035
Medical and Clinical ApplicationsOncology, transplant monitoring, and autoimmune assays advance toward validated diagnostic use


Research demand is approaching saturation among well-funded institutions, making clinical adoption the decisive variable for growth beyond 2030.

By End User

Sub-SegmentKey Trend
Academic and Research LaboratoriesShared core facility models sustain utilisation and reagent throughput
Biotechnology and Pharmaceutical CompaniesTrial-embedded biomarker programs create recurring, protocol-locked reagent demand
Hospitals and Diagnostic LaboratoriesEarly clinical adoption constrained by reimbursement rather than technical capability
Others (CROs, Government Laboratories)Outsourced discovery converts capital decisions into per-project expense


Purchasing authority is shifting from individual investigators toward centralised laboratory operations and procurement teams, which favours suppliers with strong service networks and predictable contract terms.

By Region

Sub-SegmentKey Trend
North AmericaFederal grant density and biopharma clustering sustain the largest installed base
EuropeConsortium coordination standardises protocols; IVDR compliance slows clinical translation
Asia-PacificNational biotech plans, domestic instrumentation and service outsourcing drive fastest growth
South AmericaShared core facility models offset currency-driven procurement volatility
Middle East & AfricaSovereign genomics programs anchor demand around a small number of national hubs


Regional performance tracks research funding density more closely than population or healthcare expenditure, which is why concentration persists despite falling technology costs.




Download PDF ×

We do not share your information with anyone. However, we may send you emails based on your report interest from time to time. You may contact us at any time to opt-out.