ID: MRFR/LS/0202-HCR | February 2021 | Region: Global | 85 pages
Market Scenario
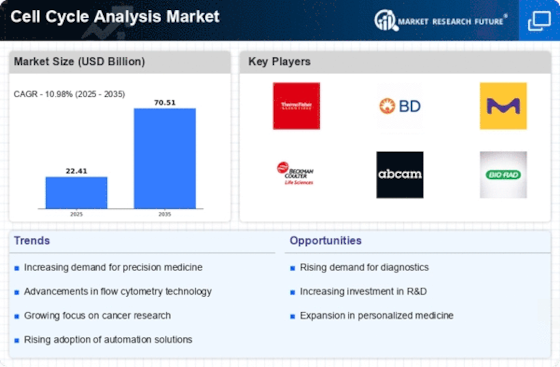
The cell cycle analysis market is expected to show a prominent growth during the forecast period (2018–2023).
Cell cycle analysis products are used in numerous life science research activities as well as in biomedical research and clinical research laboratories. Cell cycle analysis is carried out to check the effects of various internal and external factors on cells. Increasing expenditure on cell level research by the corporate sector, government initiatives for cell research, increasing chronic genetic diseases, rising occurrence of cell-specific diseases, and cancer and aggressive strategies by market players are expected to drive the growth of the market. For instance, In March 2018, Agilent technologies which is one of the major players in the cell cycle analysis market acquired advanced analytical technologies for USD 250 million.
The high costs of cell analysis instruments and expensive maintenance might be a problem for small research groups and it can hamper the growth of the market during the assessment period.
Cell Cycle Analysis Market Segmentation
The cell cycle analysis market has been segmented on the basis of product, application, and end-user.
On the basis of product, the market has been classified as consumables and instruments. The consumables segment has been further divided into reagents, assay kits, microplates, and other consumables. The assay kits segment has been further divided into immunoassay and cell-based assay. The instruments segment has been classified into microscopes, flow cytometry, spectrophotometer, qPCR, cell counter, high content screening systems, and cell microarrays. The microscopes segment has been divided into electron microscopes, inverted microscopes, stereomicroscopes, fluorescence and confocal microscopes, phase contrast microscopes, Near-Field Scanning Optical Microscopes (NSOM), and other microscopes. The flow cytometers sub-segment has been segmented into flow cytometry instruments and flow cytometry software. The spectrophotometers segment has been divided into fluorescence microplate readers, microplate spectrophotometers, and colorimeters. Furthermore, cell counters have been sub-segmented into automated cell counters and hemocytometers and manual cell counters. The synthetic High-Content Screening (HCS) systems segment includes cell imaging and analysis HCS systems and HCS software.
The market, by application, has been segmented into cell identification, cell viability, cell signaling pathway/signal transduction, cell proliferation, cell counting and quality control, cell interaction, cell structure study, target identification, and validation and single-cell analysis.
Based on end-user, the market has been divided into, academics and research institutions, hospitals and diagnostic laboratories, pharmaceuticals (CROs and biotechnology companies), and other end-users.
The market has been segmented, by region, into the Americas, Europe, Asia-Pacific, and the Middle East and Africa. The cell cycle analysis market in the Americas has further been segmented into North America and South America, with the North American market is divided into the US and Canada.
The European cell cycle analysis market has been segmented into Western Europe and Eastern Europe. Western Europe has further been classified as Germany, France, the UK, Italy, Spain, and the rest of Western Europe.
The cell cycle analysis market in Asia-Pacific has been segmented into Japan, China, India, South Korea, Australia, and the rest of Asia-Pacific. The cell cycle analysis market in the Middle East & Africa has been segmented into the Middle East and Africa.
Regional Market Summary
Cell Cycle Analysis Market Share, by Region, 2017 (%)
Source: MRFR Analysis
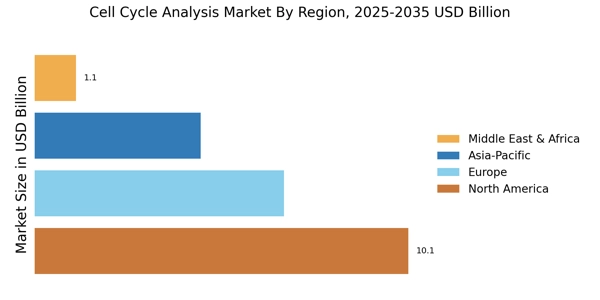
The Americas are likely to dominate the cell cycle analysis market owing to the presence of well-established research and development facilities, government funding to encourage cell level research and development, and rising prevalence of cancer. According to the National Cancer Institute, in 2016, 15.5 million cancer cases were found in the US. The expenditure on cancer care in 2017 was USD 147.3 billion.
The European market is expected to be the second-largest cell cycle analysis market. The market growth in this region can be attributed to the adoption of highly advanced technology. Moreover, a growing number of life sciences and medical research institutes in Europe is contributing to the growth of the market in this region.
Asia-Pacific is expected to be the fastest-growing cell cycle analysis market during the forecast period owing to the rising investments in life science and healthcare research and government support and favorable policies for the research sector.
The market in the Middle East and Africa is expected to account for the smallest share of the cell cycle analysis market due to an underdeveloped research sector, lack of technical knowledge, and poor research and development facilities.
Company Profiles
Cell Cycle Analysis Market, by Product
Cell Cycle Analysis Market, by Application
Cell Cycle Analysis Market, by End-User
Cell Cycle Analysis Market, by Region
Intended Audience
Frequently Asked Questions (FAQ) :
Need for anticancer treatment, increased expenditure on cell research, and rising incidence of chronic diseases are major drivers of the global cell cycle analysis market.
The Americas have registered the largest share in the global cell cycle analysis market due to presence of research and development facilities.
Europe is the second largest in the global cell cycle analysis market due to establishment of research institutes and life science companies.
Miltenyi Biotech, Promega Corporation, Danaher Corporation, Nexcelom Bioscience LLC., Becton, Dickinson and Company, Agilent Technologies, Inc., GE Healthcare, Olympus Corporation, Merck & Co., Inc., PerkinElmer, Inc., Bio-Rad Laboratories, Inc., and Thermo Fisher Scientific, Inc. are major players of the global cell cycle analysis market.
Acquisitions are the major strategy being incorporated by players in the global cell cycle analysis market.
Table of Contents
Chapter 1. Report Prologue
Chapter 2. Market Introduction
2.1 Definition
2.2 Scope of the Study
2.2.1 Research Objective
2.2.2 Assumptions
2.2.3 Limitations
Chapter 3. Research Methodology
3.1 Introduction
3.2 Primary Research
3.3 Secondary Research
3.4 Market Size Estimation
Chapter 4. Market Dynamics
4.1 Drivers
4.2 Restraints
4.3 Opportunities
4.4 Challenges
4.5 Macroeconomic Indicators
4.6 Technology Trends & Assessment
Chapter 5. Market Factor Analysis
5.1 Porter’s Five Forces Analysis
5.1.1 Bargaining Power of Suppliers
5.1.2 Bargaining Power of Buyers
5.1.3 Threat of New Entrants
5.1.4 Threat of Substitutes
5.1.5 Intensity of Rivalry
5.2 Value Chain Analysis
5.3 Investment Feasibility Analysis
5.4 Pricing Analysis
Chapter 6. Cell Cycle Analysis Market, by Product
6.1 Introduction
6.2 Consumables
6.2.1 Reagents
Market Estimates & Forecast, by Region, 2020-2027
Market Estimates & Forecast, by Country, 2020-2027
6.2.2 Assay Kits
6.2.2.1 Immunoassays
Market Estimates & Forecast, by Region, 2020-2027
Market Estimates & Forecast, by Country, 2020-2027
6.2.2.2 Cell-Based Assays
Market Estimates & Forecast, by Region, 2020-2027
Market Estimates & Forecast, by Country, 2020-2027
6.2.3 Microplates
Market Estimates & Forecast, by Region, 2020-2027
Market Estimates & Forecast, by Country, 2020-2027
6.2.4 Other Consumables
Market Estimates & Forecast, by Region, 2020-2027
Market Estimates & Forecast, by Country, 2020-2027
6.3 Instruments
6.3.1 Microscopes
6.3.1.1 Electron Microscopes
Market Estimates & Forecast, by Region, 2020-2027
Market Estimates & Forecast, by Country, 2020-2027
6.3.1.2 Inverted Microscopes
Market Estimates & Forecast, by Region, 2020-2027
Market Estimates & Forecast, by Country, 2020-2027
6.3.1.3 Stereomicroscopes
Market Estimates & Forecast, by Region, 2020-2027
Market Estimates & Forecast, by Country, 2020-2027
6.3.1.4 Fluorescence and Confocal Microscopes
Market Estimates & Forecast, by Region, 2020-2027
Market Estimates & Forecast, by Country, 2020-2027
6.3.1.5 Phase Contrast Microscopes
Market Estimates & Forecast, by Region, 2020-2027
Market Estimates & Forecast, by Country, 2020-2027
6.3.1.6 Near-field Scanning Optical Microscopes (NSOM)
Market Estimates & Forecast, by Region, 2020-2027
Market Estimates & Forecast, by Country, 2020-2027
6.3.1.7 Other Microscopes
Market Estimates & Forecast, by Region, 2020-2027
Market Estimates & Forecast, by Country, 2020-2027
6.3.2 Flow Cytometers
6.3.2.1 Flow Cytometry Instruments
Market Estimates & Forecast, by Region, 2020-2027
Market Estimates & Forecast, by Country, 2020-2027
6.3.2.1 Flow Cytometry Software
Market Estimates & Forecast, by Region, 2020-2027
Market Estimates & Forecast, by Country, 2020-2027
6.3.3 Spectrophotometers
6.3.3.1 Fluorescence Microplate Readers
Market Estimates & Forecast, by Region, 2020-2027
Market Estimates & Forecast, by Country, 2020-2027
6.3.3.2 Microplate Spectrophotometers
Market Estimates & Forecast, by Region, 2020-2027
Market Estimates & Forecast, by Country, 2020-2027
6.3.3.3 Colorimeters
Market Estimates & Forecast, by Region, 2020-2027
Market Estimates & Forecast, by Country, 2020-2027
6.3.4 qPCR
Market Estimates & Forecast, by Region, 2020-2027
Market Estimates & Forecast, by Country, 2020-2027
6.3.5 Cell Counters
6.3.5.1 Automated Cell Counters
Market Estimates & Forecast, by Region, 2020-2027
Market Estimates & Forecast, by Country, 2020-2027
6.3.5.2 Hemocytometers and Manual Cell Counters
Market Estimates & Forecast, by Region, 2020-2027
Market Estimates & Forecast, by Country, 2020-2027
6.3.6 High-content screening (HCS) Systems
6.3.6.1 Cell Imaging and Analysis HCS Systems
Market Estimates & Forecast, by Region, 2020-2027
Market Estimates & Forecast, by Country, 2020-2027
6.3.6.2 HCS Software
Market Estimates & Forecast, by Region, 2020-2027
Market Estimates & Forecast, by Country, 2020-2027
6.3.7 Cell Microarrays
Market Estimates & Forecast, by Region, 2020-2027
Market Estimates & Forecast, by Country, 2020-2027
Chapter 7. Cell Cycle Analysis Market, by Application
7.1 Introduction
7.2 Cell Identification
Market Estimates & Forecast, by Region, 2020-2027
Market Estimates & Forecast, by Country, 2020-2027
7.3 Cell Viability
Market Estimates & Forecast, by Region, 2020-2027
Market Estimates & Forecast, by Country, 2020-2027
7.4 Cell Signaling Pathway/Signal Transduction
Market Estimates & Forecast, by Region, 2020-2027
Market Estimates & Forecast, by Country, 2020-2027
7.5 Cell Proliferation
Market Estimates & Forecast, by Region, 2020-2027
Market Estimates & Forecast, by Country, 2020-2027
7.6 Cell Counting and Quality Control
Market Estimates & Forecast, by Region, 2020-2027
Market Estimates & Forecast, by Country, 2020-2027
7.7 Cell Interaction
Market Estimates & Forecast, by Region, 2020-2027
Market Estimates & Forecast, by Country, 2020-2027
7.8 Cell Structure Study
Market Estimates & Forecast, by Region, 2020-2027
Market Estimates & Forecast, by Country, 2020-2027
7.9 Target Identification and Validation
Market Estimates & Forecast, by Region, 2020-2027
Market Estimates & Forecast, by Country, 2020-2027
7.10 Single-Cell Analysis
Market Estimates & Forecast, by Region, 2020-2027
Market Estimates & Forecast, by Country, 2020-2027
Chapter 8. Cell Cycle Analysis Market, by End-User
8.1 Introduction
8.2 Academics & Research Institutions
Market Estimates & Forecast, by Region, 2020-2027
Market Estimates & Forecast, by Country, 2020-2027
8.3 Hospitals and Diagnostic Laboratories
Market Estimates & Forecast, by Region, 2020-2027
Market Estimates & Forecast, by Country, 2020-2027
8.4 Pharmaceutical- CROs and Biotechnology Companies
Market Estimates & Forecast, by Region, 2020-2027
Market Estimates & Forecast, by Country, 2020-2027
8.5 Other End-Users
Market Estimates & Forecast, by Region, 2020-2027
Market Estimates & Forecast, by Country, 2020-2027
Chapter 9. Cell Cycle Analysis Market, by Region
9.1 Introduction
9.2 Americas
9.2.1 North America
9.2.1.1 US
9.2.1.2 Canada
9.2.2 South America
9.3 Europe
9.3.1 Western Europe
9.3.1.1 Germany
9.3.1.2 France
9.3.1.3 Italy
9.3.1.4 Spain
9.3.1.5 UK
9.3.1.6 Rest of Western Europe
9.3.2 Eastern Europe
9.4 Asia-Pacific
9.4.1 Japan
9.4.2 China
9.4.3 India
9.4.4 Australia
9.4.5 South Korea
9.4.6 Rest of Asia-Pacific
9.5 Middle East & Africa
9.5.1 Middle East
9.5.2 Africa
Chapter 10. Company Landscape
10.1 Introduction
10.2 Market Share Analysis
10.3 Key Development & Strategies
Chapter 11. Company Profiles
11.1 Becton, Dickinson and Company
11.1.1 Company Overview
11.1.2 Product Overview
11.1.3 Financials Overview
11.1.4 Key Developments
11.1.5 SWOT Analysis
11.2 Merck & Co., Inc.
11.2.1 Company Overview
11.2.2 Product Overview
11.2.3 Financial Overview
11.2.4 Key Developments
11.2.5 SWOT Analysis
11.3 Thermo Fisher Scientific, Inc.
11.3.1 Company Overview
11.3.2 Product Overview
11.3.3 Financial Overview
11.3.4 Key Development
11.3.5 SWOT Analysis
11.4 Danaher Corporation
11.4.1 Company Overview
11.4.2 Technology/Business Segment Overview
11.4.3 Financial Overview
11.4.4 Key Development
11.4.5 SWOT Analysis
11.5 GE Healthcare
11.5.1 Company Overview
11.5.2 Product Overview
11.5.3 Financial overview
11.5.4 Key Developments
11.5.5 SWOT Analysis
11.6 Agilent Technologies, Inc.
11.6.1 Company Overview
11.6.2 Product Overview
11.6.3 Financial Overview
11.6.4 Key Developments
11.6.5 SWOT Analysis
11.7 Olympus Corporation
11.7.1 Overview
11.7.2 Product Overview
11.7.3 Financial Overview
11.7.4 Key Developments
11.7.5 SWOT Analysis
11.8 PerkinElmer, Inc.
11.8.1 Overview
11.8.2 Product/ Technology Overview
11.8.3 Financials
11.8.4 Key Developments
11.8.5 SWOT Analysis
11.9 Promega Corporation
11.9.1 Overview
11.9.2 Product Overview
11.9.3 Financials
11.9.4 Key Developments
11.9.5 SWOT Analysis
11.10 Bio-Rad Laboratories, Inc.
11.10.1 Overview
11.10.2 Product Overview
11.10.3 Financials
11.10.4 Key Developments
11.10.5 SWOT Analysis
11.11 Miltenyi Biotech
11.11.1 Overview
11.11.2 Product Overview
11.11.3 Financials
11.11.4 Key Developments
11.11.5 SWOT Analysis
11.12 Nexcelom Bioscience LLC.
11.12.1 Overview
11.12.2 Product Overview
11.12.3 Financials
11.12.4 Key Developments
11.12.5 SWOT Analysis
Chapter 12 MRFR Conclusion
12.1 Key Findings
12.1.1 From CEO’s Viewpoint
12.1.2 Unmet Needs of the Market
12.2 Key Companies to Watch
12.3 Predictions for the Cell Cycle Analysis Industry
Chapter 13. Appendix
LIST OF TABLES
Table 1 Cell Cycle Analysis Market Synopsis, 2020-2027
Table 2 Cell Cycle Analysis Market Estimates and Forecast, 2020-2027 (USD Million)
Table 3 Cell Cycle Analysis Market, by Region, 2020-2027 (USD Million)
Table 4 Cell Cycle Analysis Market, by Product, 2020-2027 (USD Million)
Table 5 Cell Cycle Analysis Market, by Application, 2020-2027 (USD Million)
Table 6 Cell Cycle Analysis Market, by End-User, 2020-2027 (USD Million)
Table 7 North America: Cell Cycle Analysis Market, by Product, 2020-2027 (USD
Million)
Table 8 North America: Cell Cycle Analysis Market, by Application, 2020-2027 (USD
Million)
Table 9 North America: Cell Cycle Analysis Market, by, End-User 2020-2027 (USD
Million)
Table 10 US: Cell Cycle Analysis Market, by Product, 2020-2027 (USD Million)
Table 11 US: Cell Cycle Analysis Market, by Application, 2020-2027 (USD Million)
Table 12 US: Cell Cycle Analysis Market, by, End-User 2020-2027 (USD Million)
Table 13 Canada: Cell Cycle Analysis Market, by Product, 2020-2027 (USD Million)
Table 14 Canada: Cell Cycle Analysis Market, by Application, 2020-2027 (USD Million)
Table 15 Canada: Cell Cycle Analysis Market, by, End-User 2020-2027 (USD
Million)
Table 16 South America: Cell Cycle Analysis Market, by Product, 2020-2027 (USD
Million)
Table 17 South America: Cell Cycle Analysis Market, by Application, 2020-2027 (USD
Million)
Table 18 South America: Cell Cycle Analysis Market, by, End-User 2020-2027 (USD
Million)
Table 19 Europe: Cell Cycle Analysis Market, by Product, 2020-2027 (USD Million)
Table 20 Europe: Cell Cycle Analysis Market, by Application, 2020-2027 (USD Million)
Table 21 Europe: Cell Cycle Analysis Market, by, End-User 2020-2027 (USD Million)
Table 22 Western Europe: Cell Cycle Analysis Market, by Product, 2020-2027 (USD
Million)
Table 23 Western Europe: Cell Cycle Analysis Market, by Application, 2020-2027 (USD
Million)
Table 24 Western Europe: Cell Cycle Analysis Market, by, End-User 2020-2027
(USD Million)
Table 25 Eastern Europe: Cell Cycle Analysis Market, by Product, 2020-2027 (USD
Million)
Table 26 Eastern Europe: Cell Cycle Analysis Market, by Application, 2020-2027 (USD
Million)
Table 27 Eastern Europe: Cell Cycle Analysis Market, by, End-User 2020-2027
(USD Million)
Table 28 Asia-Pacific: Cell Cycle Analysis Market, by Product, 2020-2027 (USD
Million)
Table 29 Asia-Pacific: Cell Cycle Analysis Market, by Application, 2020-2027 (USD
Million)
Table 30 Asia-Pacific: Cell Cycle Analysis Market, by, End-User 2020-2027 (USD
Million)
Table 31 Middle East & Africa: Cell Cycle Analysis Market, by Product, 2020-2027
(USD Million)
Table 32 Middle East & Africa: Cell Cycle Analysis Market, by Application, 2020-2027
(USD Million)
Table 33 Middle East & Africa: Cell Cycle Analysis Market, by, End-User 2020-2027
(USD Million)
LIST OF FIGURES
Figure 1 Research Process
Figure 2 Segmentation for Cell Cycle Analysis Market
Figure 3 Segmentation Market Dynamics for Cell Cycle Analysis Market
Figure 4 Cell Cycle Analysis Market Share, by Product, 2020
Figure 5 Cell Cycle Analysis Market Share, by Application, 2020
Figure 6 Cell Cycle Analysis Market Share, by, End-User 2020
Figure 7 Cell Cycle Analysis Market Share, by Region, 2020
Figure 8 North America: Cell Cycle Analysis Market Share, by Country, 2020
Figure 9 Europe: Cell Cycle Analysis Market Share, by Country, 2020
Figure 10 Asia-Pacific: Cell Cycle Analysis Market Share, by Country, 2020
Figure 11 Middle East & Africa: Cell Cycle Analysis Market Share, by Country, 2020
Figure 12 Cell Cycle Analysis Market: Company Share Analysis, 2020 (%)
Figure 13 Becton, Dickinson and Company: Key Financials
Figure 14 Becton, Dickinson and Company: Segmental Revenue
Figure 15 Becton, Dickinson and Company: Geographical Revenue
Figure 16 Merck & Co., Inc.: Key Financials
Figure 17 Merck & Co., Inc.: Segmental Revenue
Figure 18 Merck & Co., Inc.: Geographical Revenue
Figure 19 Thermo Fisher Scientific, Inc.: Key Financials
Figure 20 Thermo Fisher Scientific, Inc.: Segmental Revenue
Figure 21 Thermo Fisher Scientific, Inc.: Geographical Revenue
Figure 22 Danaher Corporation: Key Financials
Figure 23 Danaher Corporation: Segmental Revenue
Figure 24 Danaher Corporation: Geographical Revenue
Figure 25 GE Healthcare: Key Financials
Figure 26 GE Healthcare: Segmental Revenue
Figure 27 GE Healthcare. Geographical Revenue
Figure 28 Agilent Technologies, Inc.: Key Financials
Figure 29 Agilent Technologies, Inc.: Segmental Revenue
Figure 30 Agilent Technologies, Inc.: Geographical Revenue
Figure 31 Olympus Corporation: Key Financials
Figure 32 Olympus Corporation: Segmental Revenue
Figure 33 Olympus Corporation: Geographical Revenue
Figure 34 PerkinElmer, Inc.: Key Financials
Figure 35 PerkinElmer, Inc.: Segmental Revenue
Figure 36 PerkinElmer, Inc.: Geographical Revenue
Figure 37 Promega Corporation: Key Financials
Figure 38 Promega Corporation: Segmental Revenue
Figure 39 Promega Corporation: Geographical Revenue
Figure 40 Bio-Rad Laboratories, Inc.: Key Financials
Figure 41 Bio-Rad Laboratories, Inc.: Segmental Revenue
Figure 42 Bio-Rad Laboratories, Inc.: Geographical Revenue
Figure 43 Miltenyi Biotech: Key Financials
Figure 44 Miltenyi Biotech: Segmental Revenue
Figure 45 Miltenyi Biotech: Geographical Revenue
Figure 46 Nexcelom Bioscience LLC.: Key Financials
Figure 47 Nexcelom Bioscience LLC.: Segmental Revenue
Figure 48 Nexcelom Bioscience LLC.: Geographical Revenue