ID: MRFR/AGR/3080-HCR | February 2021 | Region: Global | 110 pages
Market Synopsis of Silage additives Market
Market Definition
Silage is a plant material, used as cattle feed, that has undergone fermentation .The primary goal of making silage is to maximize the preservation of original nutrients in the forage crop for feeding the livestock later. Silage is also one of the sources of biofuel. Silage additives are added to the forage to increase the nutritive value and improve the hygiene of the silage. Silage being an animal feed, ensures improved quality in the meat processors and various products derived from livestock. Also, increasing consumption of meat has stimulated the market of silage additives. Moreover, it has created tremendous opportunities for innovative products in animal nutrition.
Market Scenario
Silage additives are important for animal nutrition as they are means to improve silage quality and control the preservation process, so that it can be used further for feeding livestock which is supporting the market growth. Increased focus on enhancing feed utilization and improvising animal health are driving the growth of silage additives market. Additionally, rising consumption of biofuels is driving the growth of silage additive market especially in the developed countries. Moreover, increasing demand for meat consumption due to incessant rise in population, changing lifestyle and cultural trends is boosting the market of silage additives. Industrialization of stock and animal protein industry followed by growing requirement of animal protein is a key factor in the growth of silage additives market.
Furthermore, involvement of government in promoting clean energy is a major driving force for the silage additive market. Moreover, focus on R&D is bringing innovative products in animal nutrients. However, rising new entrants in feed additive industry may constraint the growth of market.
Intended Audience
Key Findings
Segments
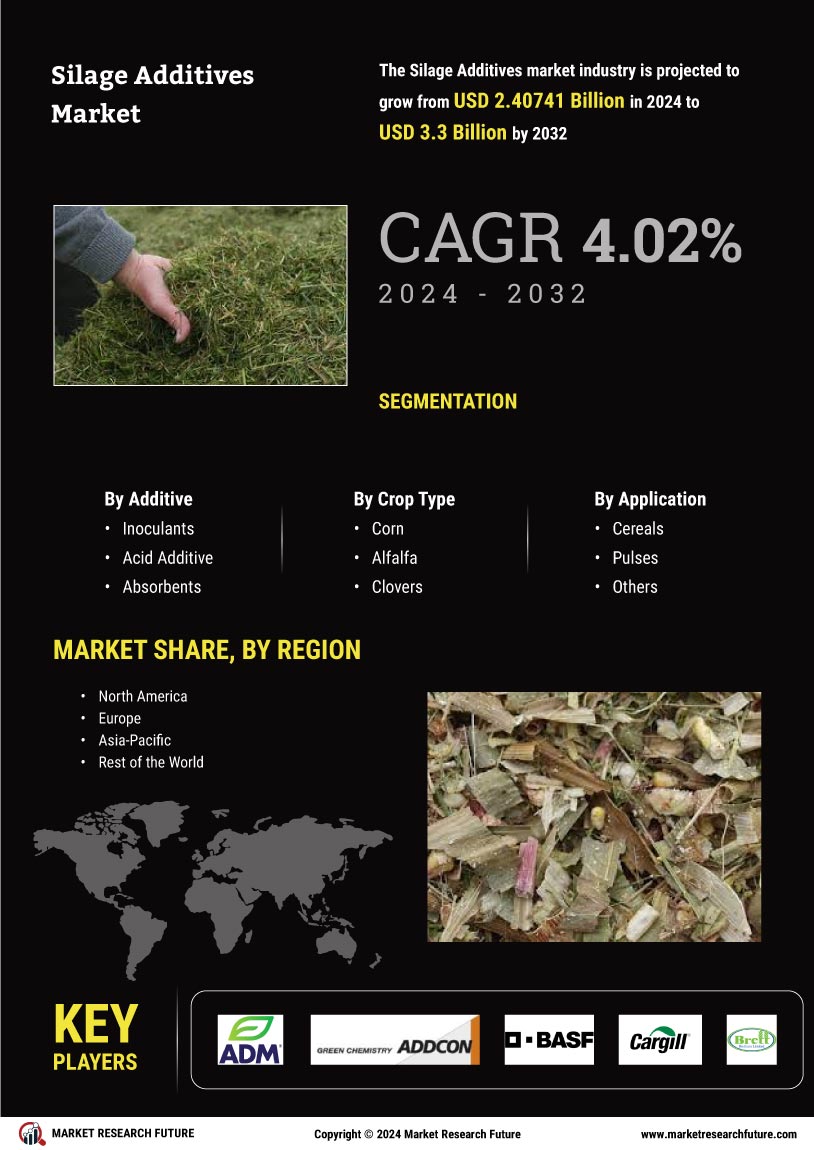
Silage additives is segmented by additives including inoculants, acid additive, absorbents, nutrients and others. Among all, inoculants are widely used additive based on its ability to improve fermentation phase and increase the nutritional value of the forage.
Regional Analysis
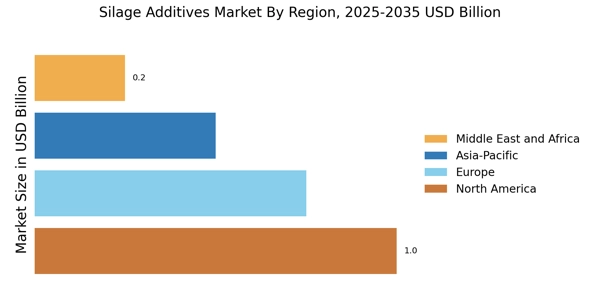
The global silage additives market is segmented into North America, Europe, Asia Pacific, and rest of the world (RoW). North America market projects the major share of silage additive market followed by Europe. Rise in demand for animal protein in the region has exerted pressure on livestock farmers. This situation has generated an opportunity for Silage additive manufacturers. Increasing focus of governments on feed cost reduction and boosting animal productivity is driving silage additive market in these regions.
However, Asia Pacific market is expected to be the fastest growing market during the forecast period. Industrialization of meat and increasing consumption of meat population is driving the market. Germany, U.S., U.K., Belgium and France are the major importers of silage additives.
Key Players
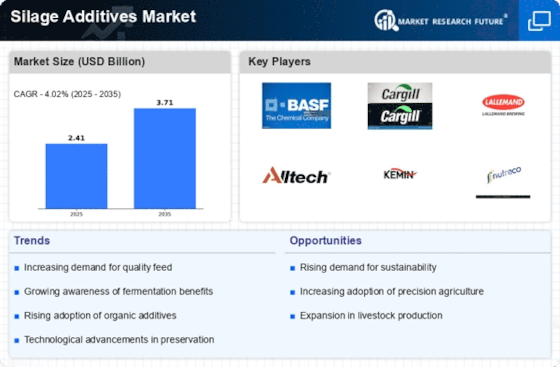
Some of the key players profiled in the global silage additives market are Archer Daniels Midland Company. (U.S.), ADDCON GROUP GmbH. (Germany), BASF SE (Germany), Cargill Inc (U.S.), Brett Brothers Ltd. (Ireland), Evonik Industries AG (Germany), LALLEMAND Inc. (Canada)
The global silage additives market is segmented under the following regions
North America
Europe
Asia Pacific
Rest of the world
The report for global silage additives market of Market Research Future comprises of extensive primary research along with the detailed analysis of qualitative as well as quantitative aspects by various industry experts, key opinion leaders to gain the deeper insight of the market and industry performance. The report gives the clear picture of current market scenario which includes historical and projected market size in terms of value and volume, technological advancement, macro economical and governing factors in the market. The report provides details information and strategies of the top key players in the industry. The report also gives a broad study of the different markets segments and regions.
Frequently Asked Questions (FAQ) :
silage additives market is projected to grow at approximately 3.2% CAGR during the assessment period (2018-2023).
Cereals and pulses is the largest application segment in the global silage additives market.
Augmenting demand for animal protein and involvement of government in R&D to bring innovative products in animal nutrients, are the major tailwinds pushing the growth of the global silage additives market.
North America holds the largest share in the global silage additives market, followed by Europe and the Asia Pacific, respectively.
Archer Daniels Midland Company. (U.S.), BASF SE (Germany), Addcon Group GmbH. (Germany), Cargill Inc. (U.S.), Evonik Industries AG (Germany), Brett Brothers Ltd. (Ireland), and LALLEMAND Inc. (Canada), are some of the top players operating in the global silage additives market.
Table of Content
Chapter 1. Methodology and Scope
1.1. Research Methodology
1.1.1 Initial Data Exploration
1.1.2 Statistical Modelling and Forecast
1.1.3 Industry Insights and Validation
1.2. Data Sources
Chapter 2. Executive Summary
2.1. Silage additive Industry Market Synopsis, 2017-2023
2.1.1 Business Trends
2.1.2 Product additive Trends
2.1.3 Product Crop type Trends
2.1.4 Product Application Trends
Chapter 3 Silage additive Industry Insights
3.1 Industry Segmentation
3.2 Industry Size and Forecast
3.3 Industry Ecosystem Analysis
3.4 Industry Impact forces
3.4.1 Growth Drivers
3.4.1.1 Rising consumption of Biofuels
3.4.1.2 Government supporting clean energy
3.4.2 Industry Pitfalls & Challenges
3.4.2.1 Challenge in handling and storage
3.4.2.2 Difficulty in controlling the moisture content of the forage.
3.5 Growth Potential Analysis
3.6 Company Market Share Analysis, 2016
3.7 Porter’s analysis
3.8 PESTEL analysis
Chapter 4 Silage additive by additives Insights
4.1 Global Silage additive Market Volume Share by Additive, 2017-2023
4.1.1 Inoculants
4.1.1.1 Market Estimates & Forecast, 2017-2023
4.1.2 Acid additive
4.1.2.1 Market Estimates & Forecast, 2017-2023
4.1.3 Absorbents
4.1.3.1 Market Estimates & Forecast, 2017-2023
4.1.4 Nutrients
4.1.4.1 Market Estimates & Forecast, 2017-2023
4.1.5 Others
4.1.5.1 Market Estimates & Forecast, 2017-2023
Chapter 5 Silage additive by Crop type Insights
5.1 Global Silage additive Market Volume Share by Crop type, 2017 & 2023
5.1.1 Corn
5.1.1.1 Market Estimates & Forecast, 2017-2023
5.1.2 Alfalfa
5.1.2.1 Market Estimates & Forecast, 2017-2023
5.1.3 Clovers
5.1.3.1 Market Estimates & Forecast, 2017-2023
5.1.4 Others
5.1.4.1 Market Estimates & Forecast, 2017-2023
Chapter 6 Silage additive Application Insights
6.1 Global Silage additive Market Volume Share by Application, 2017 & 2023
6.1.1 Cereals
6.1.1.1 Market Estimates & Forecast, 2017– 2023
6.1.1.2 Market Estimates & Forecast by Region, 2017- 2023
6.1.2 Pulses
6.1.2.1 Market Estimates & Forecast, 2017 – 2023
6.1.2.2 Market Estimates & Forecast by Region, 2017 – 2023
6.1.3 Others
6.1.3.1 Market Estimates & Forecast, 2017 – 2023
6.1.3.2 Market Estimates & Forecast by Region, 2017 – 2023
Chapter 7 Silage additive Regional Insights
7.1 Silage additive Market Volume Share by Region, 2017 & 2023.
7.2 North America
7.2. A Market Estimates & Forecast, 2017-2023
7.2. B Market Estimates & Forecast, by Type, 2017-2023
7.2. C Market Estimates & Forecast, by Functionality, 2017-2023
7.2. D Market Estimates & Forecast, by Distribution Channel, 2017-2023
7.2.1 U.S.
7.2.1.1 Market Estimates & Forecast, 2017-2023
7.2.1.2 Market Estimates & Forecast, by Functionality, 2017-2023
7.2.1.3 Market Estimates & Forecast, by Distribution Channel, 2017-2023
7.2.1.4 Market Estimates & Forecast, by Type, 2017-2023
7.2.2 Canada
7.2.2.1 Market Estimates & Forecast, 2017-2023
7.2.2.2 Market Estimates & Forecast, by Functionality, 2017-2023
7.2.2.3 Market Estimates & Forecast, by Distribution Channel, 2017-2023
7.2.2.4 Market Estimates & Forecast, by Type, 2017-2023
7.2.3 Mexico
7.2.3.1 Market Estimates & Forecast, 2017-2023
7.2.3.2 Market Estimates & Forecast, by Functionality, 2017-2023
7.2.3.3 Market Estimates & Forecast, by Distribution Channel, 2017-2023
7.2.3.4 Market Estimates & Forecast, by Type, 2017-2023
7.3 Europe
7.3. A Market Estimates & Forecast, 2017-2023
7.3. B Market Estimates & Forecast, by Type, 2017-2023
7.3. C Market Estimates & Forecast, by Functionality, 2017-2023
7.3. D Market Estimates & Forecast, by Distribution Channel, 2017-2023
7.3.1 Germany
7.3.1.1 Market Estimates & Forecast, 2017-2023
7.3.1.2 Market Estimates & Forecast, by Functionality, 2017-2023
7.3.1.3 Market Estimates & Forecast, by Distribution Channel, 2017-2023
7.3.1.4 Market Estimates & Forecast, by Type, 2017-2023
7.3.2 UK
7.3.2.1 Market Estimates & Forecast, 2017-2023
7.3.2.2 Market Estimates & Forecast, by Functionality, 2017-2023
7.3.2.3 Market Estimates & Forecast, by Distribution Channel, 2017-2023
7.3.2.4 Market Estimates & Forecast, by Type, 2017-2023
7.3.3 France
7.3.3.1 Market Estimates & Forecast, 2017-2023
7.3.3.2 Market Estimates & Forecast, by Functionality, 2017-2023
7.3.3.3 Market Estimates & Forecast, by Distribution Channel, 2017-2023
7.3.3.4 Market Estimates & Forecast, by Type, 2017-2023
7.3.4 Italy
7.3.4.1 Market Estimates & Forecast, 2017-2023
7.3.4.2 Market Estimates & Forecast, by Functionality, 2017-2023
7.3.4.3 Market Estimates & Forecast, by Distribution Channel, 2017-2023
7.3.4.4 Market Estimates & Forecast, by Type, 2017-2023
7.4 Asia Pacific
7.4. A Market Estimates & Forecast, 2017-2023
7.4. B Market Estimates & Forecast, by Functionality, 2017-2023
7.4. C Market Estimates & Forecast, by Distribution Channel, 2017-2023
7.4. D Market Estimates & Forecast, by Type, 2017-2023
7.4.1 China
7.4.1.1 Market Estimates & Forecast, 2017-2023
7.4.1.2 Market Estimates & Forecast, by Functionality, 2017-2023
7.4.1.3 Market Estimates & Forecast, by Distribution Channel, 2017-2023
7.4.1.4 Market Estimates & Forecast, by Type, 2017-2023
7.4.2 India
7.4.1.1 Market Estimates & Forecast, 2017-2023
7.4.1.2 Market Estimates & Forecast, by Functionality, 2017-2023
7.4.1.3 Market Estimates & Forecast, by Distribution Channel, 2017-2023
7.4.1.4 Market Estimates & Forecast, by Type, 2017-2023
7.4.3 Japan
7.4.3.1 Market Estimates & Forecast, 2017-2023
7.4.3.2 Market Estimates & Forecast, by Functionality, 2017-2023
7.4.3.3 Market Estimates & Forecast, by Distribution Channel, 2017-2023
7.4.3.4 Market Estimates & Forecast, by Type, 2017-2023
7.5 RoW
7.5. A Market Estimates & Forecast, 2017-2023
7.5. B Market Estimates & Forecast, by Functionality, 2017-2023
7.5. C Market Estimates & Forecast, by Distribution Channel, 2017-2023
7.5. D Market Estimates & Forecast, by Type, 2017-2023
Chapter 8 Competitor Profile
8.1 Archer Daniels Midland Company. (U.S.)
8.1.1 Business Overview
8.1.2 Financial Data
8.1.3 Product Landscape
8.1.4 Key Developments
8.1.5 Business Strategy
8.1.6 SWOT Analysis
8.2 ADDCON GROUP GmbH. (Germany)
8.2.1 Business Overview
8.2.2 Financial Data
8.2.3 Product Landscape
8.2.4 Key Developments
8.2.5 Business Strategy
8.2.6 SWOT Analysis
8.3 BASF SE (Germany)
8.3.1 Business Overview
8.3.2 Financial Data
8.3.3 Product Landscape
8.3.4 Key Developments
8.3.5 Business Strategy
8.3.6 SWOT Analysis
8.4 Cargill Inc (U.S.)
8.4.1 Business Overview
8.4.2 Financial Data
8.4.3 Product Landscape
8.4.4 Key Developments
8.4.5 Business Strategy
8.4.6 SWOT Analysis
8.5 Brett Brothers Ltd. (Ireland)
8.5.1 Business Overview
8.5.2 Financial Data
8.5.3 Product Landscape
8.5.4 Key Developments
8.5.5 Business Strategy
8.5.6 SWOT Analysis
8.6 Evonik Industries AG (Germany)
8.6.1 Business Overview
8.6.2 Financial Data
8.6.3 Product Landscape
8.6.4 Key Developments
8.6.5 Business Strategy
8.6.6 SWOT Analysis
8.7 LALLEMAND Inc. (Canada)
8.7.1 Business Overview
8.7.2 Financial Data
8.7.3 Product Landscape
8.7.4 Key Developments
8.7.5 Business Strategy
8.7.6 SWOT Analysis
Data Tables
TABLE 1 PESTLE ANALYSIS – U.S.
TABLE 2 PESTLE ANALYSIS- JAPAN
TABLE 3 PESTLE ANALYSIS- CHINA
TABLE 4 PESTLE ANALYSIS- FRANCE
TABLE 5 PESTLE ANALYSIS- GERMANY
TABLE 6 KEY SUPPLIERS OF SILAGE ADDITIVE
TABLE 7 GLOBAL MARKET FOR SILAGE ADDITIVE, BY ADDITIVE, (2017-2023), USD MILLION
TABLE 8 GLOBAL MARKET FOR SILAGE ADDITIVE, BY CROP TYPE, (2017-2023), USD MILLION
TABLE 9 GLOBAL MARKET FOR SILAGE ADDITIVE, BY APPLICATION, (2017-2023), USD MILLION
TABLE 10 GLOBAL SILAGE ADDITIVE SALES AND GROWTH RATE (2017-2023) USD MILLION
TABLE 11 GLOBAL MARKET FOR SILAGE ADDITIVE TOP 5 COUNTRIES
TABLE 12 GLOBAL MARKET FOR SILAGE ADDITIVE TOP COMPANIES-USD MILLION
TABLE 13 NORTH AMERICAN GLOBAL MARKET FOR SILAGE ADDITIVE, BY ADDITIVE, (2017-2023) USD MILLION
TABLE 14 NORTH AMERICAN MARKET FOR SILAGE ADDITIVE, BY CROP TYPE, (2017-2023), USD MILLION
TABLE 15 NORTH AMERICAN MARKET FOR SILAGE ADDITIVE, BY APPLICATION, (2017-2023), USD MILLION
TABLE 16 EUROPEAN GLOBAL MARKET FOR SILAGE ADDITIVE, BY ADDITIVE, (2017-2023) USD MILLION
TABLE 17 EUROPEAN MARKET FOR SILAGE ADDITIVE, BY CROP TYPE, (2017-2023), USD MILLION
TABLE 18 EUROPEAN MARKET FOR SILAGE ADDITIVE, BY APPLICATION, (2017-2023), USD MILLION
TABLE 19 APAC GLOBAL MARKET FOR SILAGE ADDITIVE, BY ADDITIVE, (2017-2023) USD MILLION
TABLE 20 APAC MARKET FOR SILAGE ADDITIVE, BY CROP TYPE, (2017-2023), USD MILLION
TABLE 21 APAC MARKET FOR SILAGE ADDITIVE, BY APPLICATION, (2017-2023), USD MILLION
TABLE 22 REST OF THE WORLD MARKET FOR SILAGE ADDITIVE, BY ADDITIVE, (2017-2023) USD MILLION
TABLE 23 REST OF THE WORLD MARKET FOR SILAGE ADDITIVE, BY CROP TYPE, (2017-2023), USD MILLION
TABLE 24 REST OF THE WORLD MARKET FOR SILAGE ADDITIVE, BY APPLICATION, (2017-2023), USD MILLION
TABLE 25 COMPETITIVE LANDSCAPING BASED ON FINACIALS DURING THE YEAR 2016
Charts & Figures
LIST OF FIGURES
FIGURE 1 RESEARCH METHODOLOGY
FIGURE 2 PRIMARY DATA ANALYSIS APPROACH
FIGURE 3 SECONDARY DATA ANALYSIS APPROACH
FIGURE 4 TRENDS IN SILAGE ADDITIVE IMPORTS 2011-16
FIGURE 5 GROWTH RATE IN SILAGE ADDITIVE IMPORTS 2011-16
FIGURE 6 SILAGE ADDITIVE IMPORTS MARKET SHARE BY TOP 5 IMPORTERS (2011 VS 2016)
FIGURE 7 TRENDS IN SILAGE ADDITIVE EXPORTS 2011-16
FIGURE 8 GROWTH RATE SILAGE ADDITIVE EXPORTS 2011-16
FIGURE 9 SILAGE ADDITIVE EXPORTS MARKET SHARE BY TOP 5 EXPORTERS (2011 VS 2016)
FIGURE 10 VALUE CHAIN ANALYSIS
FIGURE 11 COST ANALYSIS: SILAGE ADDITIVE
FIGURE 12 PORTER’S FIVE FORCES ANALYSIS
FIGURE 13 GLOBAL MARKET FOR SILAGE ADDITIVE TRENDS BY ADDITIVE
FIGURE 14 GLOBAL MARKET FOR SILAGE ADDITIVE TRENDS BY CROP TYPE
FIGURE 15 GLOBAL MARKET FOR SILAGE ADDITIVE TRENDS BY APPLICATION
FIGURE 16 FINANCIALS