Shopping Application Market (2026 - 2035)

ID: MRFR/ICT/31080-HCR 100 Pages Ankit Gupta Last Updated: October 24, 2026
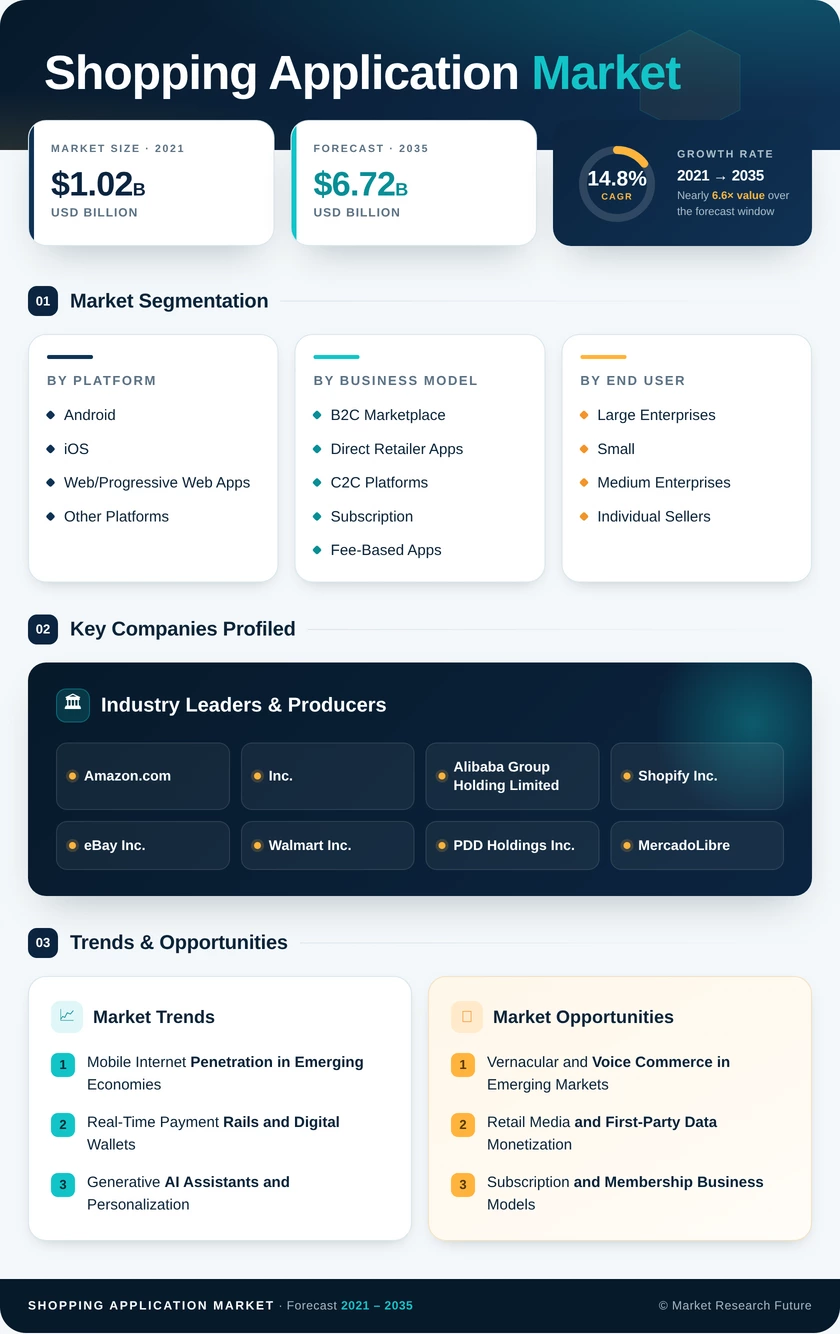
Shopping Application Market Size, Share and Research Report By Platform (Android, iOS, Web/Progressive Web Apps, Other Platforms), By Business Model (B2C Marketplace, Direct Retailer Apps, C2C Platforms, Subscription and Fee-Based Apps), By End User (Large Enterprises, Small and Medium Enterprises, Individual Sellers), By Deployment Model (Cloud-Based, On-Premise, Hybrid) and By Regional (North America, Europe, South America, Asia Pacific, Middle East and Africa) - Industry Forecast to 2035.
Shopping Application Market
Market Size
Forecast Period2026-2035
CAGR (2026-2035)14.8%
2025 Market SizeUSD 1.71 Billion
2035 Market SizeUSD 6.72 Billion
Key Players
Amazon.com, Inc.
Alibaba Group Holding Limited
Shopify Inc.
eBay Inc.
Walmart Inc.
PDD Holdings Inc.
Opportunities
  • Vernacular and Voice Commerce in Emerging Markets
  • Retail Media and First-Party Data Monetization
  • Subscription and Membership Business Models
  1. 1 Market Summary | |
  2. 2 Key Report Takeaways | |
    1. 2.1 By Platform | |
    2. 2.2 By Business Model | |
    3. 2.3 By End User | |
    4. 2.4 By Deployment Model | |
    5. 2.5 By Region | |
  3. 3 Market Size and Forecast (2021–2035) | |
  4. 4 Driver Impact Analysis | |
    1. 4.1 Mobile Internet Penetration in Emerging Economies | |
    2. 4.2 Real-Time Payment Rails and Digital Wallets | |
    3. 4.3 Generative AI Assistants and Personalization | |
    4. 4.4 Social and Live Commerce Integration | |
    5. 4.5 No-Code SaaS Storefronts for SMEs | |
    6. 4.6 App Store Fee Liberalization | |
    7. 4.7 Cloud-Native and Composable Architecture | |
  5. 5 Restraints Impact Analysis | |
    1. 5.1 Data Privacy Compliance Costs | |
    2. 5.2 Rising Customer Acquisition Costs | |
    3. 5.3 App Fatigue and Uninstall Rates | |
    4. 5.4 Cybersecurity and Payment Fraud | |
    5. 5.5 Platform Concentration and Antitrust Scrutiny | |
  6. 6 Opportunities | |
    1. 6.1 Vernacular and Voice Commerce in Emerging Markets | |
    2. 6.2 Retail Media and First-Party Data Monetization | |
    3. 6.3 Subscription and Membership Business Models | |
    4. 6.4 Augmented Reality and Visual Search | |
    5. 6.5 Alternative Distribution and Progressive Web Apps | |
  7. 7 Regional Market Share and Country-Level Analysis | |
    1. 7.1 North America | | |
      1. 7.1.1 United States | | |
      2. 7.1.2 Canada | | |
      3. 7.1.3 Mexico | |
    2. 7.2 Europe | | |
      1. 7.2.1 Germany | | |
      2. 7.2.2 United Kingdom | | |
      3. 7.2.3 France | | |
      4. 7.2.4 Italy | | |
      5. 7.2.5 Spain | | |
      6. 7.2.6 Nordic Countries | | |
      7. 7.2.7 Russia | | |
      8. 7.2.8 Rest of Europe | |
    3. 7.3 Asia-Pacific | | |
      1. 7.3.1 China | | |
      2. 7.3.2 India | | |
      3. 7.3.3 Japan | | |
      4. 7.3.4 South Korea | | |
      5. 7.3.5 ASEAN | | |
      6. 7.3.6 Rest of Asia-Pacific | |
    4. 7.4 South America | | |
      1. 7.4.1 Brazil | | |
      2. 7.4.2 Argentina | | |
      3. 7.4.3 Rest of South America | |
    5. 7.5 Middle East & Africa | | |
      1. 7.5.1 Saudi Arabia | | |
      2. 7.5.2 UAE | | |
      3. 7.5.3 South Africa | | |
      4. 7.5.4 Egypt | | |
      5. 7.5.5 Rest of Middle East & Africa | |
  8. 8 Future Outlook (2026–2035) | |
    1. 8.1 Agentic AI and Autonomous Shopping | |
    2. 8.2 Platform Economics and Fee Rebalancing | |
    3. 8.3 Super-Apps and Embedded Finance | |
    4. 8.4 Sustainability and Circular Commerce | |
  9. 9 Segmentation Analysis | |
    1. 9.1 By Platform | | |
      1. 9.1.1 Android | | |
      2. 9.1.2 iOS | | |
      3. 9.1.3 Web/Progressive Web Apps | | |
      4. 9.1.4 Other Platforms | |
    2. 9.2 By Business Model | | |
      1. 9.2.1 B2C Marketplace | | |
      2. 9.2.2 Direct Retailer Apps | | |
      3. 9.2.3 C2C Platforms | | |
      4. 9.2.4 Subscription and Fee-Based Apps | |
    3. 9.3 By End User | | |
      1. 9.3.1 Large Enterprises | | |
      2. 9.3.2 Small and Medium Enterprises | | |
      3. 9.3.3 Individual Sellers | |
    4. 9.4 By Deployment Model | | |
      1. 9.4.1 Cloud-Based | | |
      2. 9.4.2 On-Premise | | |
      3. 9.4.3 Hybrid | |
  10. 10 Competitive Landscape | |
    1. 10.1 Market Concentration Analysis | |
    2. 10.2 Competitive Benchmarking | |
  11. 11 Recent News & Developments | |
  12. 12 Report Scope and Methodology | |
  13. 13 Detailed Sources and Citations | |
  14. 14 Frequently Asked Questions (FAQs) | | LIST OF TABLES | |
  15. TABLE 1 Market Summary Snapshot, 2025–2035 | |
  16. TABLE 2 Global Market Size & Forecast, by Revenue (USD Billion), 2021–2035 | |
  17. TABLE 3 Driver Impact Analysis, 2026–2035 | |
  18. TABLE 4 Restraints Impact Analysis, 2026–2035 | |
  19. TABLE 5 Regional Summary, 2025 | |
  20. TABLE 6 North America Market, by Country, 2025 | |
  21. TABLE 7 Europe Market, by Country, 2025 | |
  22. TABLE 8 Asia-Pacific Market, by Country, 2025 | |
  23. TABLE 9 South America Market, by Country, 2025 | |
  24. TABLE 10 Middle East & Africa Market, by Country, 2025 | |
  25. TABLE 11 Market Segmentation, by Platform, 2025 | |
  26. TABLE 12 Market Segmentation, by Business Model, 2025 | |
  27. TABLE 13 Market Segmentation, by End User, 2025 | |
  28. TABLE 14 Market Segmentation, by Deployment Model, 2025 | |
  29. TABLE 15 Competitive Benchmarking Matrix, 2025 | |
  30. TABLE 16 Report Scope and Methodology | |
  31. TABLE 17 Detailed Sources and Citations | | LIST OF FIGURES | |
  32. FIGURE 1 Market Dynamics Overview (Drivers, Restraints, Opportunities) | |
  33. FIGURE 2 Industry Value Chain Analysis | |
  34. FIGURE 3 Porter's Five Forces Analysis | |
  35. FIGURE 4 Global Market Size Trend, 2021–2035 (USD Billion) | |
  36. FIGURE 5 Market Share, by Platform, 2025 | |
  37. FIGURE 6 Market Share, by Business Model, 2025 | |
  38. FIGURE 7 Market Share, by End User, 2025 | |
  39. FIGURE 8 Market Share, by Deployment Model, 2025 | |
  40. FIGURE 9 Regional Market Share, 2025 | |
  41. FIGURE 10 Asia-Pacific Growth Outlook by Country, 2026–2035 | |
  42. FIGURE 11 Competitive Landscape Positioning Map, 2025

Segmentation Quick Reference

DimensionSub-SegmentsDominant SegmentFastest Growing Segment
By PlatformAndroid, iOS, Web/Progressive Web Apps, Other PlatformsAndroid (59.9% share)Web/Progressive Web Apps (17.1% CAGR)
By Business ModelB2C Marketplace, Direct Retailer Apps, C2C Platforms, Subscription and Fee-Based AppsB2C Marketplace (50.6% share)Subscription and Fee-Based Apps (17.2% CAGR)
By End UserLarge Enterprises, Small and Medium Enterprises, Individual SellersLarge Enterprises (53.4% share)Small and Medium Enterprises (16.4% CAGR)
By Deployment ModelCloud-Based, On-Premise, HybridCloud-Based (64.5% share)Hybrid (16.3% CAGR)
By RegionNorth America, Europe, Asia-Pacific, South America, Middle East & AfricaNorth America (37.8% share)Asia-Pacific (17.3% CAGR (2026–2035))

Market Segmentation Overview

By Platform

Sub-SegmentKey Trend
AndroidVolume leadership in price-sensitive emerging markets
iOSRevenue-weighted premium audience
Web/Progressive Web AppsNear-native features without store fees
Other PlatformsEarly wearable, in-car, and smart-home commerce

Android leads platform share because affordable handsets and open publishing dominate in Asia, Africa, and South America. Web/Progressive Web Apps grow fastest as push notifications and offline caching let merchants run direct, fee-free funnels. iOS keeps a smaller but higher-spending user base that supports premium native features such as AR try-on.

By Business Model

Sub-SegmentKey Trend
B2C MarketplaceNetwork effects and expanding seller catalogs
Direct Retailer AppsFirst-party data and brand-controlled journeys
C2C PlatformsResale growth tempered by seller verification rules
Subscription and Fee-Based AppsPaid tiers for delivery, early access, and ad-free use

B2C Marketplace holds the largest share because buyer and seller networks reinforce each other at scale. Subscription and Fee-Based Apps grow fastest as lower store commissions improve recurring-revenue margins and shoppers pay for convenience. Direct Retailer Apps and C2C Platforms occupy defensible niches built on brand loyalty and circular-economy demand, respectively.

By End User

Sub-SegmentKey Trend
Large EnterprisesDeep ERP, CRM, and warehouse integrations
Small and Medium EnterprisesTemplated no-code storefronts and AI catalog tools
Individual SellersCreator storefronts and social-commerce plugins

Large Enterprises lead because they fund custom omnichannel apps and require certified, integration-heavy platforms. Small and Medium Enterprises grow fastest as no-code builders and marketplace onboarding cut launch costs to a fraction of custom builds. Individual Sellers form a growing tail that monetizes social followings through lightweight storefront tools.

By Deployment Model

Sub-SegmentKey Trend
Cloud-BasedElastic scaling for seasonal traffic peaks
On-PremiseRetained for legacy and latency-sensitive workloads
HybridData sovereignty combined with cloud burst capacity

Cloud-Based deployment dominates because elastic compute and global content delivery absorb holiday spikes without upfront capital. Hybrid grows fastest as data-localization rules in Europe and India push retailers to keep customer data in-country while using public cloud for peak loads. On-Premises persists mainly where legacy systems are too costly to migrate.


Download PDF ×

We do not share your information with anyone. However, we may send you emails based on your report interest from time to time. You may contact us at any time to opt-out.