Segmentation Quick Reference
| Dimension | Sub-Segments | Dominant Segment | Fastest Growing Segment |
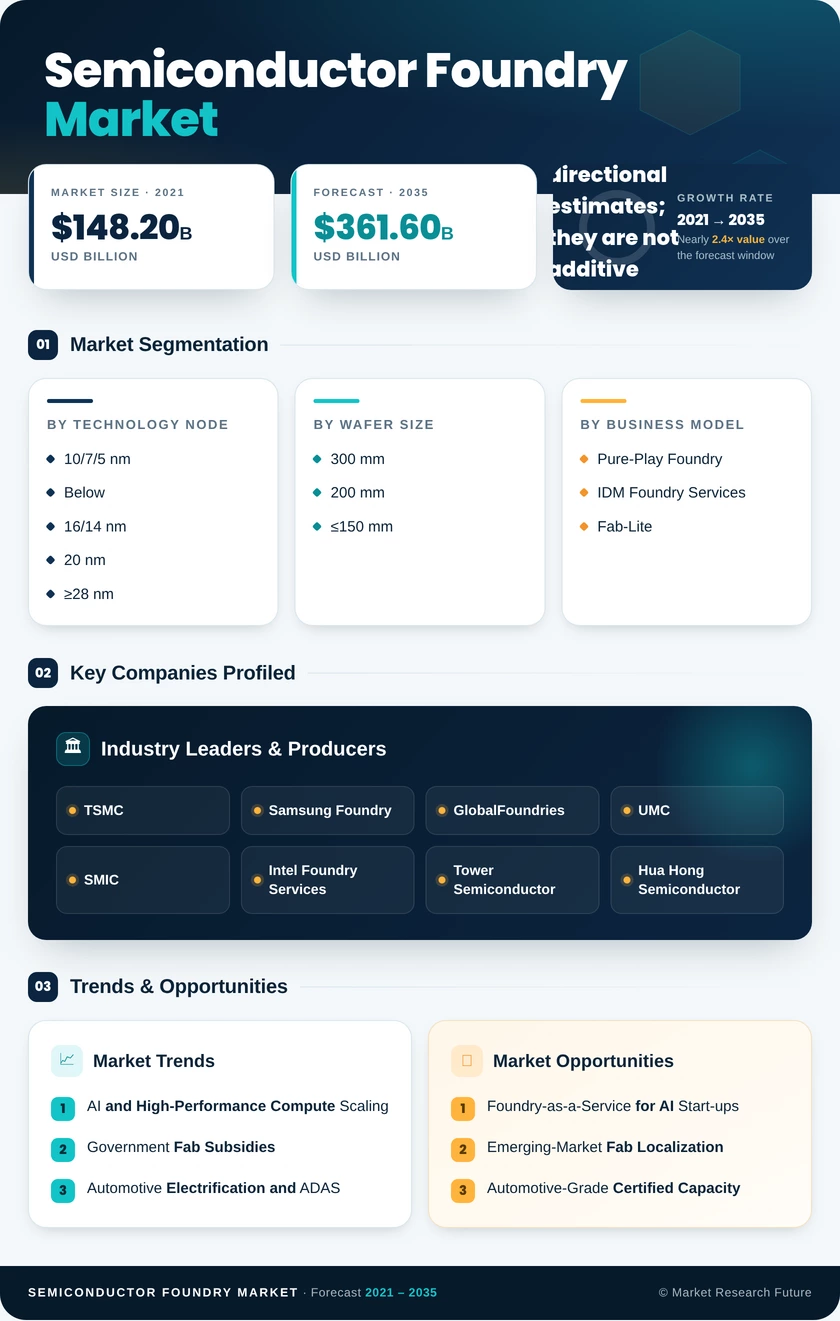
| Technology Node | 10/7/5 nm and Below; 16/14 nm; 20 nm; ≥28 nm | ≥28 nm (Mature Nodes) | 10/7/5 nm and Below |
| Wafer Size | 300 mm; 200 mm; ≤150 mm | 300 mm | 300 mm |
| Business Model | Pure-Play Foundry; IDM Foundry Services; Fab-Lite | Pure-Play Foundry | IDM Foundry Services |
| Application | Consumer Electronics & Communication; Automotive; Industrial & Others | Consumer Electronics & Communication | Automotive |
| Geography | North America; Europe; Asia-Pacific; South America; Middle East & Africa | Asia-Pacific | Asia-Pacific |
Market Segmentation Overview
By Technology Node
| Sub-Segment | Key Trend |
| 10/7/5 nm and Below | AI accelerator and HPC workloads driving rapid capacity additions at TSMC, Samsung |
| 16/14 nm | Serving mid-range mobile and networking SoCs; moderate capacity expansion |
| 20 nm | Legacy node with declining new tape-outs; sustained by long-lifecycle wireless designs |
| ≥28 nm (Mature Nodes) | Volume backbone for automotive, IoT, and industrial; strategic self-sufficiency investments in China and Europe |
Mature nodes continue to anchor the highest wafer-start volumes, while advanced nodes drive the majority of incremental revenue growth due to premium pricing.
By Wafer Size
| Sub-Segment | Key Trend |
| 300 mm | Standard for all sub-28 nm fabrication; dominant share of capital investment |
| 200 mm | Renaissance driven by automotive and power semiconductor demand; equipment refurbishment wave |
| ≤150 mm | Niche compound-semiconductor and specialty analog applications; stable but limited growth |
The 300 mm substrate remains the industry standard for cost-efficient, high-throughput wafer processing at scale.
By Business Model
| Sub-Segment | Key Trend |
| Pure-Play Foundry | TSMC leadership; customer-neutral model attracts broadest fabless design ecosystem |
| IDM Foundry Services | Intel and Samsung pursuing external customers to amortize capital; fastest-growing model |
| Fab-Lite | IDMs like NXP and Renesas outsource overflow volume while retaining strategic internal capacity |
The pure-play model dominates because it eliminates competitive conflicts between the foundry and its customers.
By Application
| Sub-Segment | Key Trend |
| Consumer Electronics & Communication | Smartphone SoCs, 5G modems, and data-center ASICs drive the largest share |
| Automotive | EV electrification and ADAS proliferation are creating sustained long-term foundry demand |
| Industrial & Others | Factory automation, medical imaging, and defense are creating diversified, stable demand base |
Automotive is closing the gap on consumer electronics as silicon content per vehicle rises with electrification.
By Geography
| Sub-Segment | Key Trend |
| North America | CHIPS Act–funded capacity expansion; hyperscaler procurement hub |
| Europe | EU Chips Act investment; automotive-grade fab localization |
| Asia-Pacific | Largest installed capacity; leading-edge node leadership (Taiwan, South Korea) |
| South America | Assembly, test, and design services; early-stage ecosystem development |
| Middle East & Africa | Vision 2030 diversification; growing data-center and defense silicon demand |
Asia-Pacific retains both the largest and fastest-growing position, though subsidy-driven construction in North America and Europe is gradually redistributing global capacity.