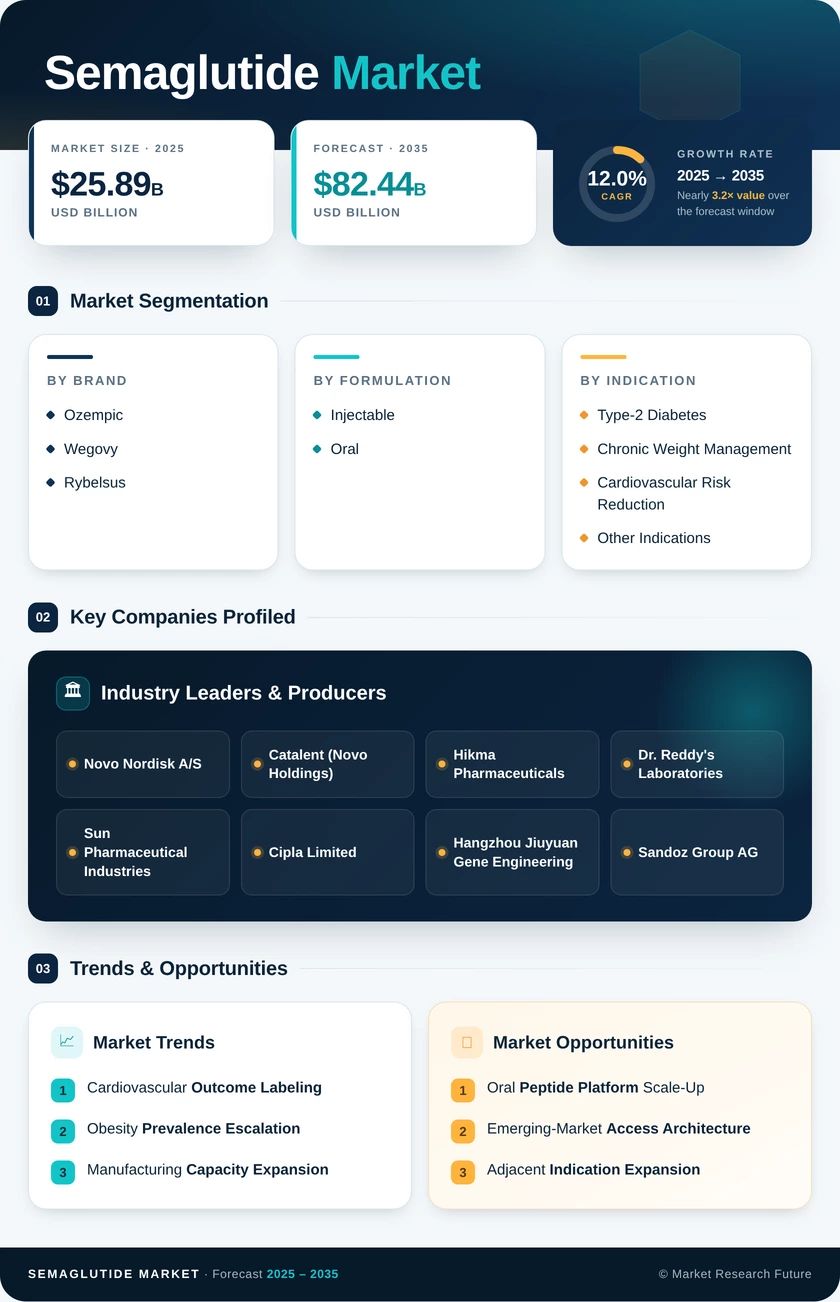
Semaglutide Market (2026 - 2035)

Semaglutide Market Research Report: Size, Share, Trend Analysis By Indication (Type 2 Diabetes, Obesity, Cardiovascular Risk Reduction), By Dosage Form (Injection, Oral), By Distribution Channel (Hospital Pharmacies, Retail Pharmacies, Online Pharmacies), By End Users (Hospitals, Homecare Settings, Clinics) andBy Regional (North America, Europe, South America, Asia Pacific, Middle East and Africa) - Growth Outlook & Industry Forecast To 2035

Forecast Period
2026-2035
CAGR
12.0%
2025 Market Size
USD 25.89 Billion
2035 Market Size
USD 82.44 Billion
Healthcare ● Updated August 2026 Report ID: MRFR/HC/41751-HCR | Pages: 200 | Author: Rahul Gotadki, Vikita Thakur
  1. 1 Market Overview |
    1. 1.1 Study Assumptions & Market Definition |
    2. 1.2 Scope of the Study |
    3. 1.3 Research Methodology |
    4. 1.4 Market Summary
  2. 2 Key Report Takeaways |
    1. 2.1 By Brand |
    2. 2.2 By Sector |
    3. 2.3 By Region
  3. 3 Market Size & Forecast (2021–2035) |
    1. 3.1 Historical Market Size (2021–2024) |
    2. 3.2 Base Year Assessment (2025) |
    3. 3.3 Forecast Market Size (2026–2035) |
    4. 3.4 Year-over-Year Growth Analysis
  4. 4 Driver Impact Analysis |
    1. 4.1 Cardiovascular Outcome Labeling |
    2. 4.2 Obesity Prevalence Escalation |
    3. 4.3 Manufacturing Capacity Expansion |
    4. 4.4 Employer-Sponsored Weight Programs
  5. 5 Restraints Impact Analysis |
    1. 5.1 Net Price Erosion from Rebating |
    2. 5.2 Patent Expiry and Generic Entry |
    3. 5.3 Discontinuation and Adherence Attrition
  6. 6 Opportunities |
    1. 6.1 Oral Peptide Platform Scale-Up |
    2. 6.2 Emerging-Market Access Architecture |
    3. 6.3 Adjacent Indication Expansion |
    4. 6.4 Digital Adherence and Data Monetisation |
    5. 6.5 Telehealth-Integrated Distribution
  7. 7 Regional Market Share & Country-Level Analysis |
    1. 7.1 North America | |
      1. 7.1.1 US | |
      2. 7.1.2 Canada | |
      3. 7.1.3 Mexico |
    2. 7.2 Europe | |
      1. 7.2.1 Germany | |
      2. 7.2.2 UK | |
      3. 7.2.3 France | |
      4. 7.2.4 Italy | |
      5. 7.2.5 Spain | |
      6. 7.2.6 Nordic Countries | |
      7. 7.2.7 Russia | |
      8. 7.2.8 Rest of Europe |
    3. 7.3 Asia-Pacific | |
      1. 7.3.1 China | |
      2. 7.3.2 India | |
      3. 7.3.3 Japan | |
      4. 7.3.4 South Korea | |
      5. 7.3.5 ASEAN | |
      6. 7.3.6 Rest of Asia-Pacific |
    4. 7.4 South America | |
      1. 7.4.1 Brazil | |
      2. 7.4.2 Argentina | |
      3. 7.4.3 Rest of South America |
    5. 7.5 Middle East & Africa | |
      1. 7.5.1 Saudi Arabia | |
      2. 7.5.2 UAE | |
      3. 7.5.3 South Africa | |
      4. 7.5.4 Egypt | |
      5. 7.5.5 Rest of Middle East & Africa
  8. 8 Future Outlook (2026–2035) |
    1. 8.1 Manufacturing as Strategic Differentiator |
    2. 8.2 Payer Contracting Sophistication |
    3. 8.3 The Generic Transition |
    4. 8.4 Indication Convergence
  9. 9 Market Segmentation Analysis |
    1. 9.1 By Brand | |
      1. 9.1.1 Wegovy | |
      2. 9.1.2 Ozempic | |
      3. 9.1.3 Rybelsus |
    2. 9.2 By Formulation | |
      1. 9.2.1 Injectable | |
      2. 9.2.2 Oral |
    3. 9.3 By Indication | |
      1. 9.3.1 Type-2 Diabetes | |
      2. 9.3.2 Chronic Weight Management | |
      3. 9.3.3 Cardiovascular Risk Reduction | |
      4. 9.3.4 Other Indications |
    4. 9.4 By Distribution Channel | |
      1. 9.4.1 Hospital Pharmacies | |
      2. 9.4.2 Retail Pharmacies | |
      3. 9.4.3 Online Pharmacies
  10. 10 Competitive Landscape |
    1. 10.1 Market Concentration Analysis (2026) |
    2. 10.2 Competitive Benchmarking Matrix |
    3. 10.3 Company Profiles
  11. 11 Recent News & Developments
  12. 12 Report Scope & Methodology
  13. 13 Detailed Sources & Citations
  14. 14 Frequently Asked Questions
  15. 15 LIST OF TABLES |
  16. TABLE 1 Global Semaglutide Market Size & Forecast, by Revenue (USD Billion), 2021–2035 |
  17. TABLE 2 Global Semaglutide Market — Year-over-Year Growth Analysis, 2021–2035 |
  18. TABLE 3 Driver Impact Analysis Matrix, 2026–2035 |
  19. TABLE 4 Restraint Impact Analysis Matrix, 2026–2035 |
  20. TABLE 5 Global Semaglutide Market Size, by Region, 2021–2035 (USD Billion) |
  21. TABLE 6 North America Semaglutide Market Size, by Country, 2021–2035 (USD Billion) |
  22. TABLE 7 Europe Semaglutide Market Size, by Country, 2021–2035 (USD Billion) |
  23. TABLE 8 Asia-Pacific Semaglutide Market Size, by Country, 2021–2035 (USD Billion) |
  24. TABLE 9 South America Semaglutide Market Size, by Country, 2021–2035 (USD Billion) |
  25. TABLE 10 Middle East & Africa Semaglutide Market Size, by Country, 2021–2035 (USD Billion) |
  26. TABLE 11 Global Semaglutide Market Size, by Brand, 2021–2035 (USD Billion) |
  27. TABLE 12 Global Semaglutide Market Size, by Formulation, 2021–2035 (USD Billion) |
  28. TABLE 13 Global Semaglutide Market Size, by Indication, 2021–2035 (USD Billion) |
  29. TABLE 14 Global Semaglutide Market Size, by Distribution Channel, 2021–2035 (USD Billion) |
  30. TABLE 15 North America Semaglutide Market Size, by Brand and Formulation, 2021–2035 (USD Billion) |
  31. TABLE 16 Europe Semaglutide Market Size, by Indication and Distribution Channel, 2021–2035 (USD Billion) |
  32. TABLE 17 Asia-Pacific Semaglutide Market Size, by Brand and Indication, 2021–2035 (USD Billion) |
  33. TABLE 18 Competitive Benchmarking Matrix, 2026 |
  34. TABLE 19 Company Profiles — Key Players and Supply-Chain Participants |
  35. TABLE 20 Recent Developments & Strategic Announcements, 2023–2026 |
  36. TABLE 21 Report Scope & Methodology Summary |
  37. TABLE 22 Detailed Sources & Citations Index
  38. 16 LIST OF FIGURES |
  39. FIGURE 1 Global Semaglutide Market Dynamics — Drivers, Restraints, Opportunities |
  40. FIGURE 2 Industry Value Chain Analysis — API to Patient |
  41. FIGURE 3 Porter's Five Forces Assessment |
  42. FIGURE 4 Global Market Size Trend Line, 2021–2035 (USD Billion) |
  43. FIGURE 5 Year-over-Year Growth Curve, 2022–2035 |
  44. FIGURE 6 Market Share by Brand, 2025 vs 2035 |
  45. FIGURE 7 Market Share by Formulation, 2025 vs 2035 |
  46. FIGURE 8 Market Share by Indication, 2025 vs 2035 |
  47. FIGURE 9 Market Share by Distribution Channel, 2025 |
  48. FIGURE 10 Regional Revenue Share Distribution, 2025 |
  49. FIGURE 11 Regional CAGR Comparison, 2026–2035 |
  50. FIGURE 12 Country-Level Revenue Heat Map, 2025 |
  51. FIGURE 13 Competitive Positioning Quadrant, 2026 |
  52. FIGURE 14 Manufacturing Capacity vs Demand Outlook, 2026–2032 |
  53. FIGURE 15 Patent Expiry Timeline by Jurisdiction, 2026–2032
Share::
Request Free Sample

Segmentation Quick Reference

DimensionSub-SegmentsDominant SegmentFastest Growing Segment
By BrandWegovy, Ozempic, RybelsusOzempicWegovy
By FormulationInjectable, OralInjectableOral
By IndicationType-2 Diabetes, Chronic Weight Management, Cardiovascular Risk Reduction, Other IndicationsType-2 DiabetesCardiovascular Risk Reduction
By Distribution ChannelHospital Pharmacies, Retail Pharmacies, Online PharmaciesHospital PharmaciesOnline Pharmacies
By RegionNorth America, Europe, Asia-Pacific, Middle East & Africa, South AmericaNorth AmericaAsia-Pacific


Market Segmentation Overview

By Brand

Sub-SegmentKey Trend
WegovyCardiovascular indication unlocks payer categories previously closed to weight-management products
OzempicEntrenched endocrinology prescribing sustains the largest installed patient base
RybelsusNeedle-free administration attracts patients who decline injectable initiation


Brand strategy now hinges on indication breadth rather than molecule differentiation. Because all three products share an active ingredient, competitive positioning depends entirely on label scope, dose ceiling, and which reimbursement category each brand can access in a given market.

By Formulation

Sub-SegmentKey Trend
InjectableHigher dose ceilings preserve the efficacy advantage in weight management
OralTablet production bypasses sterile fill-finish bottlenecks and simplifies distribution


Formulation choice increasingly reflects supply-chain logic as much as clinical preference. Oral manufacturing scales along a different constraint curve, which gives manufacturers a hedge against pen capacity limits that persist through the late 2020s.

By Indication

Sub-SegmentKey Trend
Type-2 DiabetesSettled reimbursement and guideline placement provide revenue stability
Chronic Weight ManagementEmployer and commercial coverage drive the largest incremental volume
Cardiovascular Risk ReductionSecondary-prevention labeling converts payer resistance into coverage
Other IndicationsRenal and hepatic readouts open organ-protection positioning


Indication mix is migrating from glycaemic control toward organ protection. That shift matters commercially because cost-offset arguments are far stronger for renal and cardiac endpoints than for weight reduction alone.

By Distribution Channel

Sub-SegmentKey Trend
Hospital PharmaciesSpecialist-led initiation and structured titration protocols anchor volume
Retail PharmaciesRefill convenience supports long-term adherence and persistence
Online PharmaciesTelehealth integration compresses the prescription-to-fill cycle


Channel economics are being rewritten by manufacturer-operated direct pharmacies. Vertical integration lets originators capture cash-pay demand at controlled pricing while limiting the gross-to-net erosion that intermediated channels impose.




Share::
Request Free Sample
Download PDF ×

We do not share your information with anyone. However, we may send you emails based on your report interest from time to time. You may contact us at any time to opt-out.