Selective Catalytic Reduction (SCR) Market (2026 - 2035)

ID: MRFR/AT/3881-HCR 111 Pages Triveni Bhoyar Last Updated: October 31, 2026
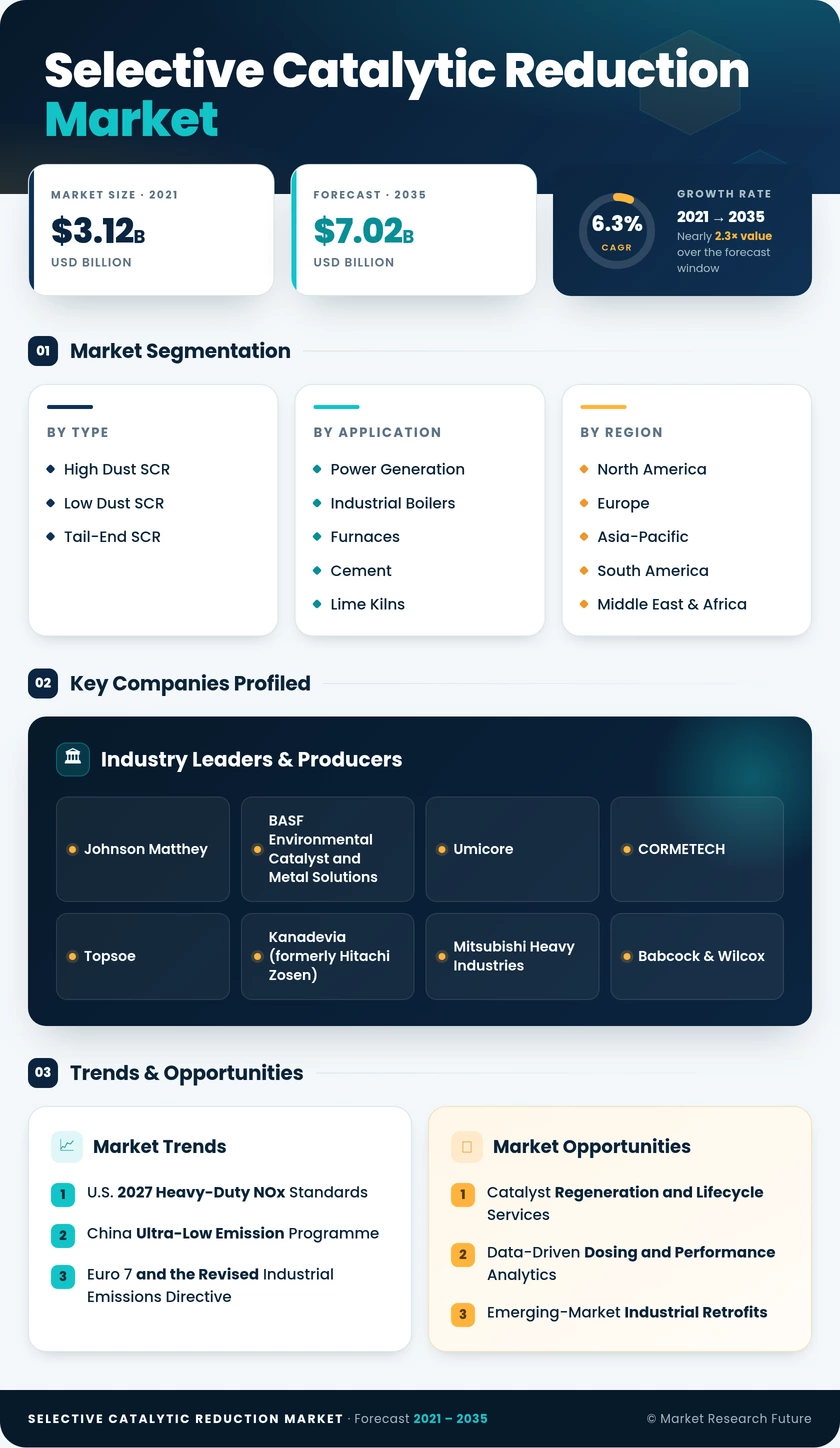
Selective Catalytic Reduction (SCR) Market Research Report By Type (High Dust SCR, Low Dust SCR, Tail-End SCR), By Application (Power Generation, Industrial Boilers and Furnaces, Cement and Lime Kilns, Iron and Steel, Chemicals and Petrochemicals, Automotive - Light-Duty, Automotive - Heavy-Duty, Marine Engines, Others) - Forecast to 2035
Selective Catalytic Reduction (SCR) Market
Market Size
Forecast Period2026-2035
CAGR (2026-2035)6.3%
2025 Market SizeUSD 3.81 Billion
2035 Market SizeUSD 7.02 Billion
Key Players
Johnson Matthey
BASF Environmental Catalyst and Metal Solutions
Umicore
CORMETECH
Topsoe
Kanadevia
Opportunities
  • Catalyst Regeneration and Lifecycle Services
  • Data-Driven Dosing and Performance Analytics
  • Emerging-Market Industrial Retrofits
  1. 1 Market Summary | |
  2. 2 Key Report Takeaways | |
    1. 2.1 By Type | |
    2. 2.2 By Application | |
    3. 2.3 By Region | |
  3. 3 Market Size and Forecast (2021–2035) | |
    1. 3.1 Historical Market Size (2021–2025) | |
    2. 3.2 Forecast Market Size (2026–2035) | |
    3. 3.3 Year-over-Year Growth Analysis | |
  4. 4 Driver Impact Analysis | |
    1. 4.1 U.S. 2027 Heavy-Duty NOx Standards | |
    2. 4.2 China Ultra-Low Emission Programme | |
    3. 4.3 Euro 7 and the Revised Industrial Emissions Directive | |
    4. 4.4 IMO Tier III Limits | |
    5. 4.5 India Thermal Plant and Vehicle Norms | |
    6. 4.6 Gas-Fired Capacity for Data Centres | |
  5. 5 Restraints Impact Analysis | |
    1. 5.1 Coal Plant Retirements | |
    2. 5.2 Battery-Electric Truck Adoption | |
    3. 5.3 Ammonium Bisulfate Fouling | |
    4. 5.4 Vanadium Price Volatility and Disposal | |
    5. 5.5 U.S. Regulatory Uncertainty | |
  6. 6 Opportunities | |
    1. 6.1 Catalyst Regeneration and Lifecycle Services | |
    2. 6.2 Data-Driven Dosing and Performance Analytics | |
    3. 6.3 Emerging-Market Industrial Retrofits | |
    4. 6.4 Ammonia and Hydrogen Combustion | |
    5. 6.5 Marine Retrofits and Newbuilds | |
  7. 7 Regional Market Share and Country-Level Analysis | |
    1. 7.1 North America | | |
      1. 7.1.1 US | | |
      2. 7.1.2 Canada | | |
      3. 7.1.3 Mexico | |
    2. 7.2 Europe | | |
      1. 7.2.1 Germany | | |
      2. 7.2.2 UK | | |
      3. 7.2.3 France | | |
      4. 7.2.4 Italy | | |
      5. 7.2.5 Spain | | |
      6. 7.2.6 Nordic Countries | | |
      7. 7.2.7 Russia | | |
      8. 7.2.8 Rest of Europe | |
    3. 7.3 Asia-Pacific | | |
      1. 7.3.1 China | | |
      2. 7.3.2 India | | |
      3. 7.3.3 Japan | | |
      4. 7.3.4 South Korea | | |
      5. 7.3.5 ASEAN | | |
      6. 7.3.6 Rest of Asia-Pacific | |
    4. 7.4 South America | | |
      1. 7.4.1 Brazil | | |
      2. 7.4.2 Argentina | | |
      3. 7.4.3 Rest of South America | |
    5. 7.5 Middle East & Africa | | |
      1. 7.5.1 Saudi Arabia | | |
      2. 7.5.2 UAE | | |
      3. 7.5.3 South Africa | | |
      4. 7.5.4 Egypt | | |
      5. 7.5.5 Rest of MEA | |
  8. 8 Future Outlook (2026–2035) | |
    1. 8.1 Fuel Transition and Low-Carbon Combustion | |
    2. 8.2 Digital and AI-Optimised Operation | |
    3. 8.3 Road-Transport Electrification | |
    4. 8.4 Circular Catalysts and ESG Reporting | |
  9. 9 Segmentation Analysis | |
    1. 9.1 By Type | | |
      1. 9.1.1 High Dust SCR | | |
      2. 9.1.2 Low Dust SCR | | |
      3. 9.1.3 Tail-End SCR | |
    2. 9.2 By Application | | |
      1. 9.2.1 Power Generation | | |
      2. 9.2.2 Industrial Boilers and Furnaces | | |
      3. 9.2.3 Cement and Lime Kilns | | |
      4. 9.2.4 Iron and Steel | | |
      5. 9.2.5 Chemicals and Petrochemicals | | |
      6. 9.2.6 Automotive - Light-Duty | | |
      7. 9.2.7 Automotive - Heavy-Duty | | |
      8. 9.2.8 Marine Engines | | |
      9. 9.2.9 Others | |
  10. 10 Competitive Landscape | |
    1. 10.1 Market Concentration Analysis | |
    2. 10.2 Competitive Benchmarking Matrix | |
    3. 10.3 Company Profiles | | |
      1. 10.3.1 Johnson Matthey | | |
      2. 10.3.2 BASF Environmental Catalyst and Metal Solutions | | |
      3. 10.3.3 Umicore | | |
      4. 10.3.4 CORMETECH | | |
      5. 10.3.5 Topsoe | | |
      6. 10.3.6 Kanadevia | | |
      7. 10.3.7 Mitsubishi Heavy Industries | | |
      8. 10.3.8 Babcock & Wilcox | | |
      9. 10.3.9 Cummins | | |
      10. 10.3.10 Tenneco | | |
      11. 10.3.11 Andritz | | |
      12. 10.3.12 Fuel Tech | |
  11. 11 Recent News & Developments | |
  12. 12 Report Scope and Methodology | |
  13. 13 Detailed Sources and Citations | |
  14. 14 Frequently Asked Questions (FAQs) | | LIST OF TABLES | |
  15. TABLE 1 Global SCR Market Summary Metrics, 2025–2035 | |
  16. TABLE 2 Global SCR Market Size & Forecast, by Revenue (USD Billion), 2021–2035 | |
  17. TABLE 3 Driver Impact Analysis, 2026–2035 | |
  18. TABLE 4 Restraints Impact Analysis, 2026–2035 | |
  19. TABLE 5 Global SCR Market, Regional Summary, 2025 | |
  20. TABLE 6 North America SCR Market, by Country, 2025 | |
  21. TABLE 7 Europe SCR Market, by Country, 2025 | |
  22. TABLE 8 Asia-Pacific SCR Market, by Country, 2025 | |
  23. TABLE 9 South America SCR Market, by Country, 2025 | |
  24. TABLE 10 Middle East & Africa SCR Market, by Country, 2025 | |
  25. TABLE 11 Global SCR Market, by Type, 2025 (USD Billion) | |
  26. TABLE 12 Global SCR Market, by Application, 2025 (USD Billion) | |
  27. TABLE 13 Competitive Benchmarking Matrix, 2025 | |
  28. TABLE 14 Report Scope and Methodology | |
  29. TABLE 15 Detailed Sources and Citations | |
  30. TABLE 16 Segmentation Quick Reference | |
  31. TABLE 17 By Type – Sub-Segment Key Trends | |
  32. TABLE 18 By Application – Sub-Segment Key Trends | | LIST OF FIGURES | |
  33. FIGURE 1 Market Dynamics Overview – Drivers, Restraints, Opportunities | |
  34. FIGURE 2 SCR Industry Value Chain Analysis | |
  35. FIGURE 3 Porter's Five Forces Analysis | |
  36. FIGURE 4 Global SCR Market Size Trend, 2021–2035 (USD Billion) | |
  37. FIGURE 5 Year-over-Year Growth Rate, 2021–2035 | |
  38. FIGURE 6 Market Share by Type, 2025 | |
  39. FIGURE 7 Market Share by Application, 2025 | |
  40. FIGURE 8 Regional Market Share, 2025 | |
  41. FIGURE 9 Country-Level Share within Asia-Pacific, 2025 | |
  42. FIGURE 10 Competitive Landscape – Estimated Revenue Share Ranges, 2025 | |
  43. FIGURE 11 Company Positioning Matrix

Segmentation Quick Reference

DimensionSub-SegmentsDominant SegmentFastest Growing Segment
By TypeHigh Dust SCR, Low Dust SCR, Tail-End SCRHigh Dust SCR (48.2%)Tail-End SCR (6.6% CAGR)
By ApplicationPower Generation, Industrial Boilers and Furnaces, Cement and Lime Kilns, Iron and Steel, Chemicals and Petrochemicals, Automotive - Light-Duty, Automotive - Heavy-Duty, Marine Engines, OthersPower Generation (40.8%)Automotive - Heavy-Duty (6.8% CAGR)
By RegionNorth America, Europe, Asia-Pacific, South America, Middle East & AfricaAsia-Pacific (44.6%)Asia-Pacific (44.6%)

Market Segmentation Overview

By Type

Sub-SegmentKey Trend
High Dust SCRErosion-resistant channel designs for coal ash loading
Low Dust SCRLonger catalyst life behind upstream precipitators
Tail-End SCRLow-temperature catalysts enabling installation after desulfurisation

High Dust SCR leads at 48.2% because coal boilers can place reactors where flue gas naturally sits at 300–420°C, avoiding reheating costs. Tail-End SCR grows fastest at a 6.6% CAGR as low-temperature vanadia-molybdenum and manganese catalysts tolerate cooler gas on turbines, ships and incinerators. Low Dust SCR occupies the middle ground, valued by operators who want reduced ash exposure without tail-end reheating.

By Application

Sub-SegmentKey Trend
Power GenerationReplacement-led demand on coal; tail-end growth on gas turbines
Industrial Boilers and FurnacesPermit tightening under industrial emissions rules
Cement and Lime KilnsKiln-specific dust-tolerant catalyst designs
Iron and SteelSintering retrofits under Chinese ultra-low limits
Chemicals and PetrochemicalsRefinery heater and nitric acid plant upgrades
Automotive - Light-DutyCoated filters on diesel cars and pickups
Automotive - Heavy-DutyDual dosing and heated catalysts for 2027 standards
Marine EnginesTier III retrofits on cruise and offshore vessels
OthersLocomotives, off-road equipment and backup gensets

Power Generation holds 40.8% of the Selective Catalytic Reduction Market, combining coal replacement cycles with new gas turbine installations. Automotive - Heavy-Duty grows fastest at a 6.8% CAGR because 2027 U.S. limits and Euro 7 raise catalyst and dosing content per truck. Marine Engines and Iron and Steel follow, driven respectively by Tier III emission control areas and Chinese sintering mandates.


Download PDF ×

We do not share your information with anyone. However, we may send you emails based on your report interest from time to time. You may contact us at any time to opt-out.