APAC SEA Robotic Process Automation Market Segmentation
SEA Robotic Process Automation Market By Application (USD Billion, 2026-2035)
- Data Entry Automation
- Invoice Processing
- Customer Service Automation
- Human Resources Management
- IT Process Automation
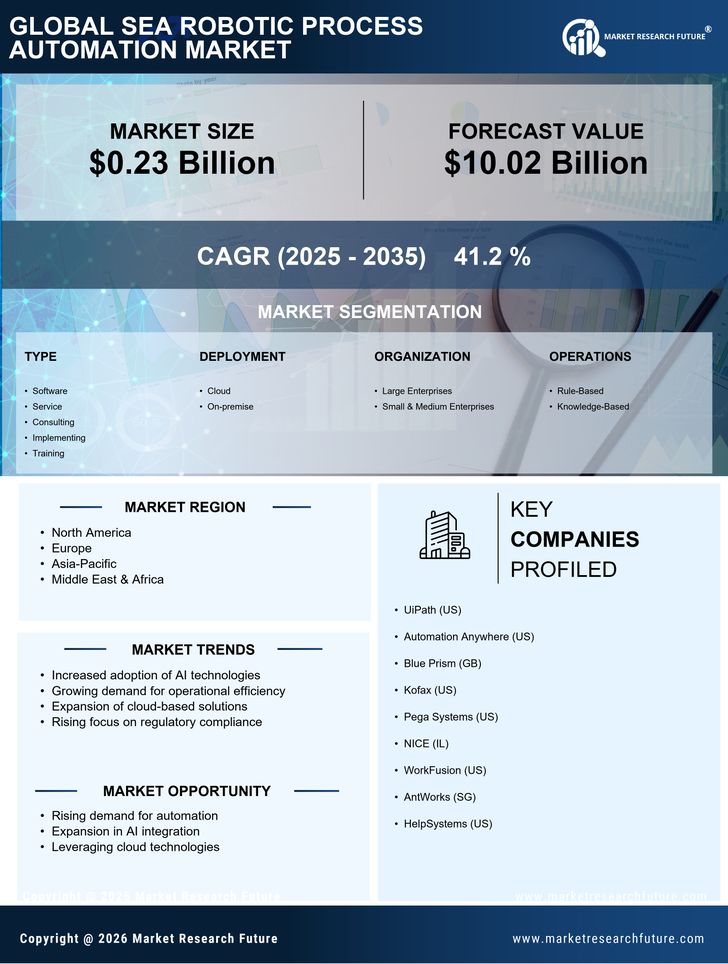
SEA Robotic Process Automation Market By Deployment Type (USD Billion, 2026-2035)
- On-Premises
- Cloud-Based
- Hybrid
SEA Robotic Process Automation Market By End User (USD Billion, 2026-2035)
- BFSI
- Healthcare
- Manufacturing
- Retail
- Telecommunications