Scalable Software Defined Networking Market (2026 - 2035)

ID: MRFR/ICT/35866-HCR 100 Pages Aarti Dhapte Last Updated: October 22, 2026
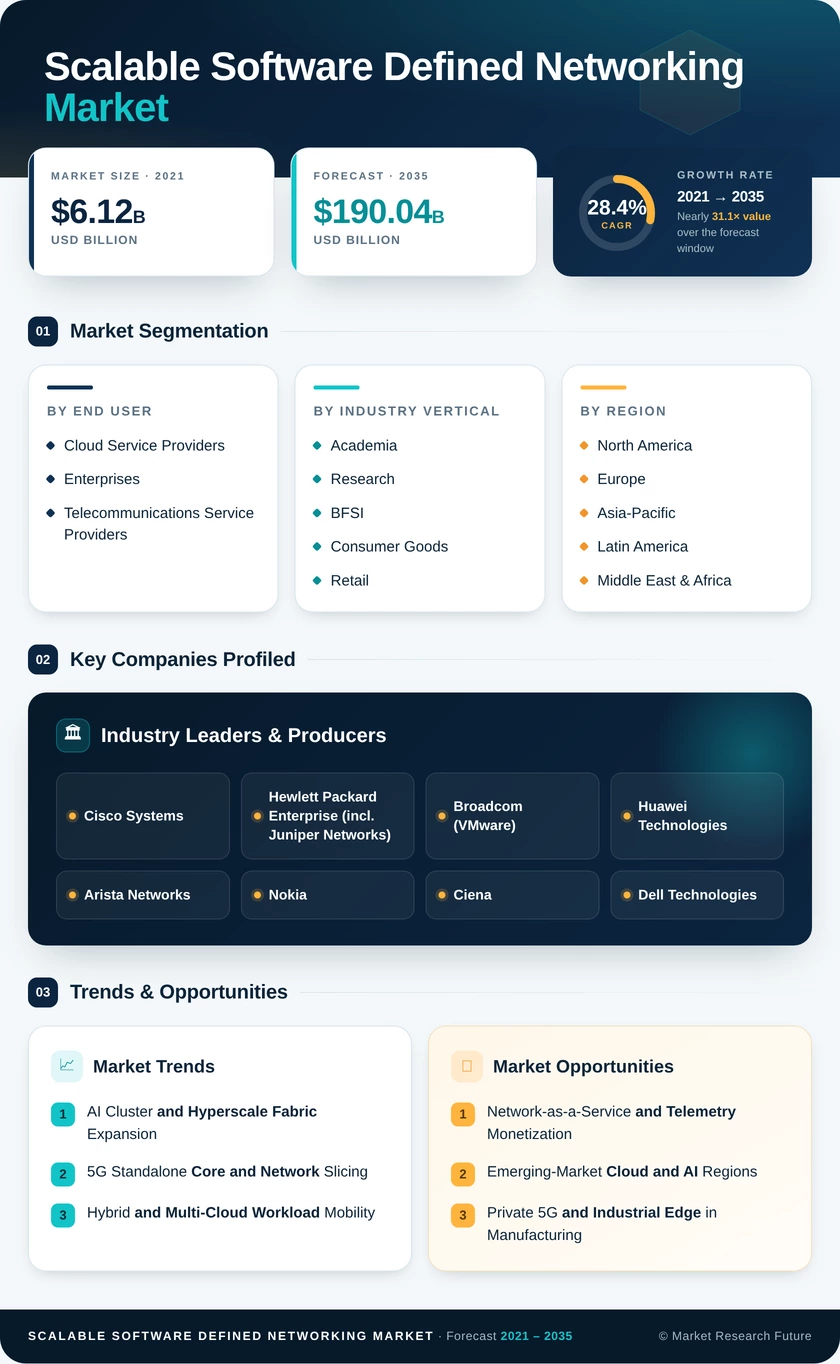
Scalable Software Defined Networking Market Size, Share and Research Report By End User (Cloud Service Providers, Enterprises, Telecommunications Service Providers), By Industry Vertical (Academia and Research, BFSI, Consumer Goods and Retail, Government and Defense, Manufacturing, Telecom and IT, Other Industry Verticals) and By Regional (North America, Europe, Asia-Pacific, Latin America, Middle East & Africa) - Industry Forecast to 2035.
Scalable Software Defined Networking Market
Market Size
Forecast Period2026-2035
CAGR (2026-2035)28.4%
2025 Market SizeUSD 15.6 Billion
2035 Market SizeUSD 190.0 Billion
Key Players
Cisco Systems
Hewlett Packard Enterprise
Broadcom
Huawei Technologies
Arista Networks
Nokia
Opportunities
  • Network-as-a-Service and Telemetry Monetization
  • Emerging-Market Cloud and AI Regions
  • Private 5G and Industrial Edge in Manufacturing
  1. 1 Market Summary | |
  2. 2 Key Report Takeaways | |
    1. 2.1 By End User | |
    2. 2.2 By Industry Vertical | |
    3. 2.3 By Region | |
  3. 3 Market Size and Forecast (2021–2035) | |
  4. 4 Driver Impact Analysis | |
    1. 4.1 AI Cluster and Hyperscale Fabric Expansion | |
    2. 4.2 5G Standalone Core and Network Slicing | |
    3. 4.3 Hybrid and Multi-Cloud Workload Mobility | |
    4. 4.4 Zero Trust Mandates and Micro-Segmentation | |
    5. 4.5 Public Broadband and Digital Infrastructure Funding | |
    6. 4.6 Open Networking Standards and Disaggregation | |
  5. 5 Restraints Impact Analysis | |
    1. 5.1 Controller-Level Cybersecurity Exposure | |
    2. 5.2 Brownfield Integration Complexity | |
    3. 5.3 Network Automation Skills Shortage | |
    4. 5.4 Licensing Model Disruption After Consolidation | |
    5. 5.5 Multi-Vendor Interoperability Gaps | |
  6. 6 Opportunities | |
    1. 6.1 Network-as-a-Service and Telemetry Monetization | |
    2. 6.2 Emerging-Market Cloud and AI Regions | |
    3. 6.3 Private 5G and Industrial Edge in Manufacturing | |
    4. 6.4 Secure Branch Convergence for Mid-Size Enterprises | |
    5. 6.5 AI-Native Intent-Based Operations | |
  7. 7 Regional Market Share and Country-Level Analysis | |
    1. 7.1 North America | | |
      1. 7.1.1 United States | | |
      2. 7.1.2 Canada | |
    2. 7.2 Europe | | |
      1. 7.2.1 United Kingdom | | |
      2. 7.2.2 Germany | | |
      3. 7.2.3 France | | |
      4. 7.2.4 Rest of Europe | |
    3. 7.3 Asia-Pacific | | |
      1. 7.3.1 China | | |
      2. 7.3.2 Japan | | |
      3. 7.3.3 India | | |
      4. 7.3.4 Rest of Asia Pacific | |
    4. 7.4 Latin America | | |
      1. 7.4.1 Brazil | | |
      2. 7.4.2 Argentina | | |
      3. 7.4.3 Rest of Latin America | |
    5. 7.5 Middle East & Africa | | |
      1. 7.5.1 Saudi Arabia | | |
      2. 7.5.2 United Arab Emirates | | |
      3. 7.5.3 South Africa | | |
      4. 7.5.4 Rest of Middle East & Africa | |
  8. 8 Future Outlook (2026–2035) | |
    1. 8.1 Autonomous, AI-Driven Network Operations | |
    2. 8.2 Network-as-a-Service Platform Economics | |
    3. 8.3 Energy-Constrained AI Data Centres | |
    4. 8.4 Open Standards and Digital Sovereignty | |
  9. 9 Segmentation Analysis | |
    1. 9.1 By End User | | |
      1. 9.1.1 Cloud Service Providers | | |
      2. 9.1.2 Enterprises | | |
      3. 9.1.3 Telecommunications Service Providers | |
    2. 9.2 By Industry Vertical | | |
      1. 9.2.1 Academia and Research | | |
      2. 9.2.2 BFSI | | |
      3. 9.2.3 Consumer Goods and Retail | | |
      4. 9.2.4 Government and Defense | | |
      5. 9.2.5 Manufacturing | | |
      6. 9.2.6 Telecom and IT | | |
      7. 9.2.7 Other Industry Verticals | |
  10. 10 Competitive Landscape | |
  11. 11 Recent News & Developments | |
  12. 12 Report Scope and Methodology | |
  13. 13 Detailed Sources and Citations | |
  14. 14 Frequently Asked Questions (FAQs) | | LIST OF TABLES | |
  15. TABLE 1 Global Market Size & Forecast, by Revenue (USD Billion), 2021–2035 | |
  16. TABLE 2 Year-over-Year Growth Analysis, 2021–2035 | |
  17. TABLE 3 Driver Impact Analysis on CAGR | |
  18. TABLE 4 Restraints Impact Analysis on CAGR | |
  19. TABLE 5 Regional Summary, 2025 | |
  20. TABLE 6 North America Market, by Country, 2025 | |
  21. TABLE 7 Europe Market, by Country, 2025 | |
  22. TABLE 8 Asia-Pacific Market, by Country, 2025 | |
  23. TABLE 9 Latin America Market, by Country, 2025 | |
  24. TABLE 10 Middle East & Africa Market, by Country, 2025 | |
  25. TABLE 11 Market Size, by End User, 2025 | |
  26. TABLE 12 Market Size, by Industry Vertical, 2025 | |
  27. TABLE 13 Competitive Benchmarking Matrix | |
  28. TABLE 14 Report Scope and Methodology | |
  29. TABLE 15 Detailed Sources and Citations | | LIST OF FIGURES | |
  30. FIGURE 1 Market Dynamics Overview (Drivers, Restraints, Opportunities) | |
  31. FIGURE 2 Industry Value Chain Analysis | |
  32. FIGURE 3 Porter's Five Forces Analysis | |
  33. FIGURE 4 Global Market Size Trend, 2021–2035 (USD Billion) | |
  34. FIGURE 5 Market Share, by End User, 2025 (%) | |
  35. FIGURE 6 Market Share, by Industry Vertical, 2025 (%) | |
  36. FIGURE 7 Regional Market Share, 2025 (%) | |
  37. FIGURE 8 Regional Growth Comparison, 2026–2035 (CAGR %) | |
  38. FIGURE 9 Competitive Landscape, Estimated Vendor Share Ranges | |
  39. FIGURE 10 Recent Strategic Developments Timeline, 2023–2025

Segmentation Quick Reference

DimensionSub-SegmentsDominant SegmentFastest Growing Segment
By End UserCloud Service Providers, Enterprises, Telecommunications Service ProvidersCloud Service Providers (41.3% share)Telecommunications Service Providers (30.6% CAGR)
By Industry VerticalAcademia and Research, BFSI, Consumer Goods and Retail, Government and Defense, Manufacturing, Telecom and IT, Other Industry VerticalsTelecom and IT (29.4% share)Manufacturing (31.4% CAGR)
By RegionNorth America, Europe, Asia-Pacific, Latin America, Middle East & AfricaNorth America (38.6% share)Asia-Pacific (32.1% CAGR)

Market Segmentation Overview

By End User

Sub-SegmentKey Trend
Cloud Service ProvidersAutomated leaf-spine fabrics for AI training clusters
EnterprisesCloud-managed campus, branch and hybrid cloud networking
Telecommunications Service ProvidersSoftware-controlled 5G standalone cores and slicing

Cloud Service Providers lead with a 41.3% share because hyperscale and AI fabrics must re-provision thousands of ports continuously, a task manual configuration cannot handle. Telecommunications Service Providers grow fastest at a 30.6% CAGR as standalone 5G cores and per-customer slices depend on programmable transport. Enterprises remain a large, steady buyer group, though licensing changes and skills gaps slow their conversion from pilots to full rollouts.

By Industry Vertical

Sub-SegmentKey Trend
Academia and ResearchResearch and education networks linked to HPC centres
BFSIMicro-segmentation for trading and payment compliance
Consumer Goods and RetailStore-edge analytics and omnichannel connectivity
Government and DefenseZero trust mission networks under federal mandates
ManufacturingPrivate 5G and deterministic factory networks
Telecom and ITCarrier core automation and managed network services
Other Industry VerticalsHealthcare, energy and transport digitization

Telecom and IT leads with a 29.4% share since carriers and IT service providers operate the largest and most frequently changing networks. Manufacturing is the fastest-growing vertical at a 31.4% CAGR, as private 5G, machine vision and mobile robots require segmented, reconfigurable plant networks. BFSI and Government and Defense follow closely, with spending tied to segmentation rules and zero trust programs rather than raw capacity.


Download PDF ×

We do not share your information with anyone. However, we may send you emails based on your report interest from time to time. You may contact us at any time to opt-out.