Satellite Based Augmentation Systems Market Segmentation
Satellite Based Augmentation Systems Market By Elements (USD Billion, 2025-2035)
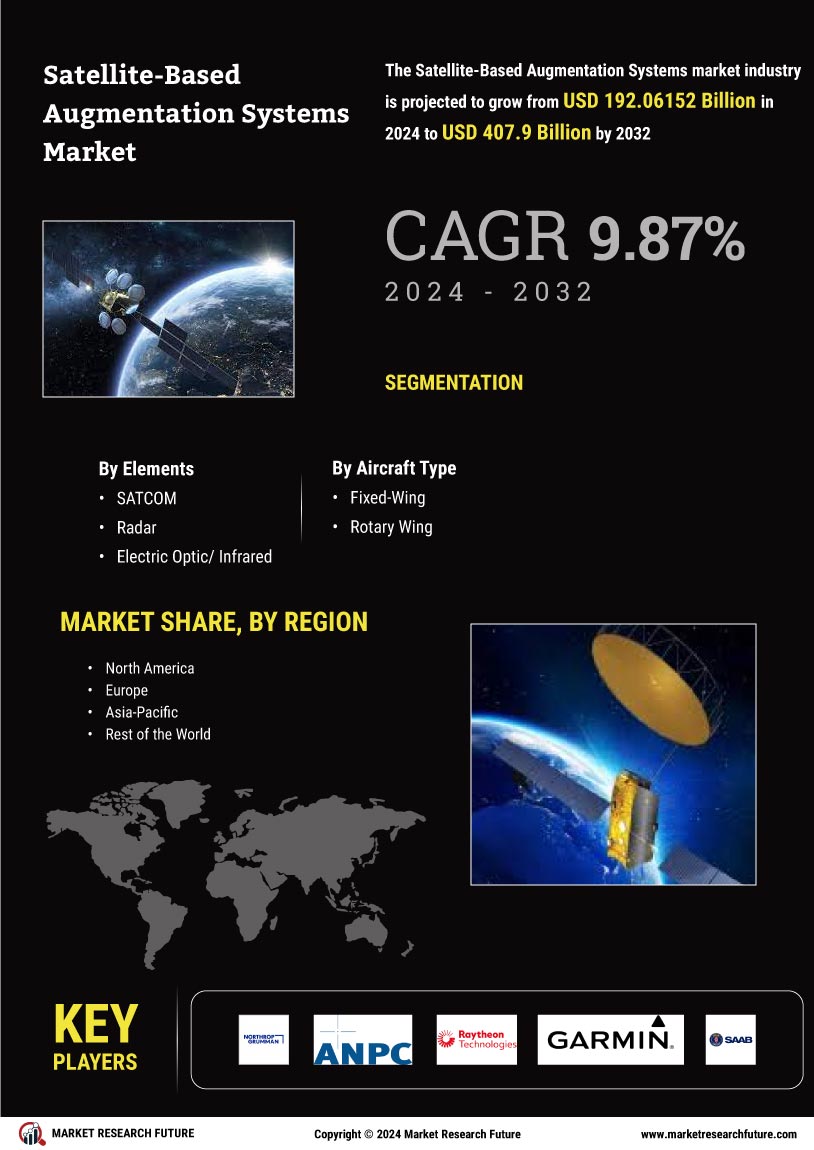
- SATCOM
- Radar
- Electric Optic/ Infrared
Satellite Based Augmentation Systems Market By Aircraft Type (USD Billion, 2025-2035)
- Fixed-Wing
- Rotary Wing