Risk-based Authentication Market (2026 - 2035)

ID: MRFR/ICT/31095-HCR 100 Pages Aarti Dhapte Last Updated: November 22, 2026
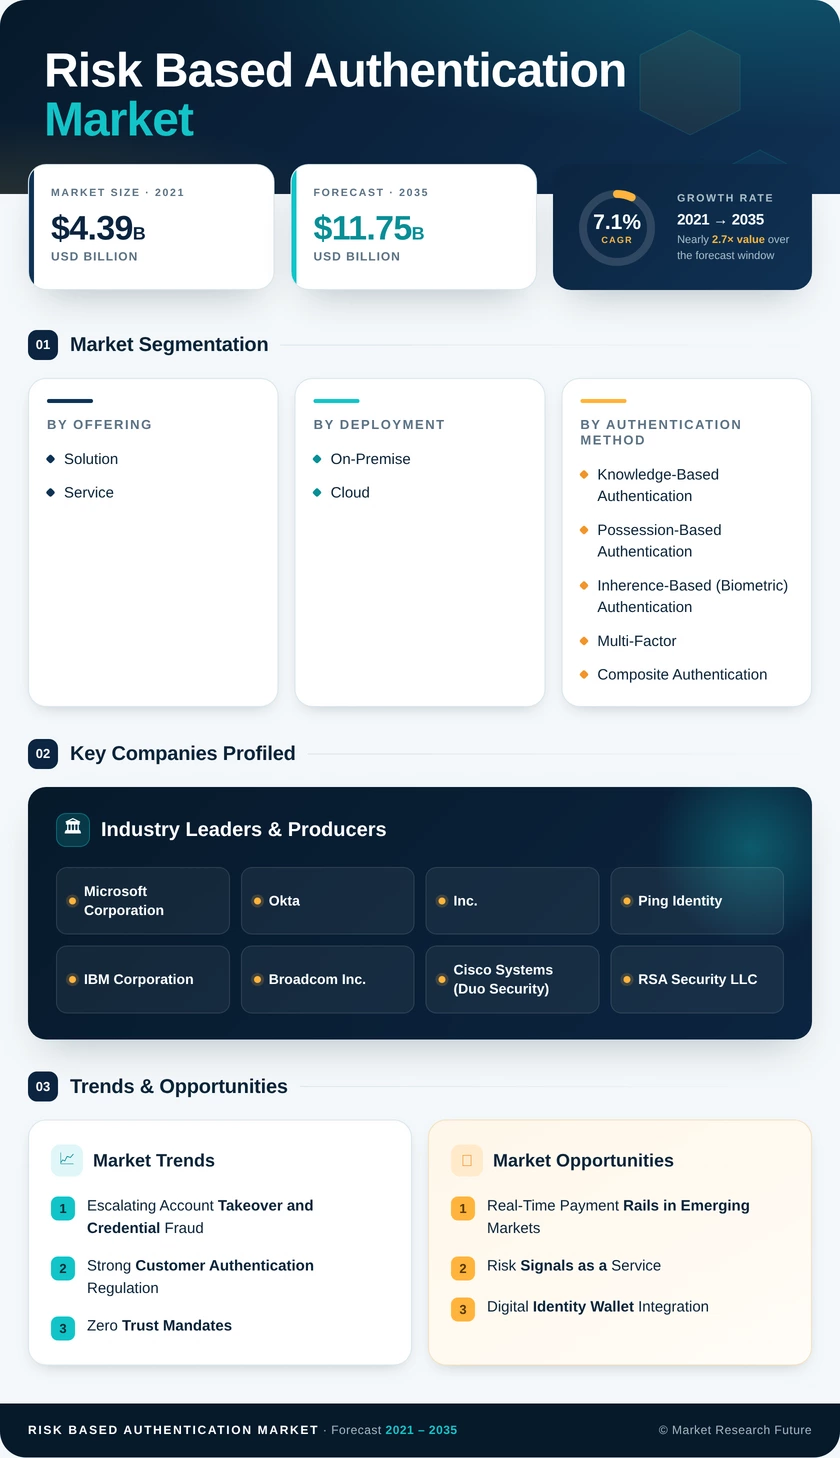
Risk-based Authentication Market Size, Share and Research Report By Offering (Solution and Service), By Deployment (On-Premise and Cloud), By Authentication Method (Knowledge-Based Authentication, Possession-Based Authentication, Inherence-Based (Biometric) Authentication, Multi-Factor and Composite Authentication, and Adaptive Behavioral Authentication), By Organization Size (Large Enterprises and Small and Medium Enterprises), By End-User Vertical (Banking and Financial Services, Retail, Government, Healthcare, IT and Telecom, and Others) And By Region (North America, Europe, Asia-Pacific, And Rest Of The World) –Industry Forecast Till 2035
Risk-based Authentication Market
Market Size
Forecast Period2026-2035
CAGR (2026-2035)7.1%
2025 Market SizeUSD 5.92 Billion
2035 Market SizeUSD 11.75 Billion
Key Players
Microsoft Corporation
Okta, Inc.
Ping Identity
IBM Corporation
Broadcom Inc.
Cisco Systems
Opportunities
  • Real-Time Payment Rails in Emerging Markets
  • Risk Signals as a Service
  • Digital Identity Wallet Integration
  1. 1 Market Summary | |
  2. 2 Key Report Takeaways | |
    1. 2.1 By Offering | |
    2. 2.2 By Deployment | |
    3. 2.3 By Authentication Method | |
    4. 2.4 By Organization Size | |
    5. 2.5 By End-User Vertical | |
    6. 2.6 By Region | |
  3. 3 Market Size and Forecast (2021–2035) | |
  4. 4 Driver Impact Analysis | |
    1. 4.1 Escalating Account Takeover and Credential Fraud | |
    2. 4.2 Strong Customer Authentication Regulation | |
    3. 4.3 Zero Trust Mandates | |
    4. 4.4 Cloud and SaaS Migration of Identity Stacks | |
    5. 4.5 AI-Driven Behavioral Analytics Maturity | |
    6. 4.6 Healthcare Digitization and HIPAA Security Updates | |
  5. 5 Restraints Impact Analysis | |
    1. 5.1 Privacy Limits on Behavioral and Biometric Data | |
    2. 5.2 Integration Complexity with Legacy IAM | |
    3. 5.3 Cybersecurity Skills Shortage | |
    4. 5.4 False Positives and Customer Friction | |
    5. 5.5 Budget Constraints Among Smaller Buyers | |
  6. 6 Opportunities | |
    1. 6.1 Real-Time Payment Rails in Emerging Markets | |
    2. 6.2 Risk Signals as a Service | |
    3. 6.3 Digital Identity Wallet Integration | |
    4. 6.4 Managed Services for SMEs | |
    5. 6.5 Machine and Agent Identities | |
  7. 7 Regional Market Share and Country-Level Analysis | |
    1. 7.1 North America | | |
      1. 7.1.1 United States | | |
      2. 7.1.2 Canada | | |
      3. 7.1.3 Mexico | |
    2. 7.2 Europe | | |
      1. 7.2.1 Germany | | |
      2. 7.2.2 United Kingdom | | |
      3. 7.2.3 France | | |
      4. 7.2.4 Italy | | |
      5. 7.2.5 Spain | | |
      6. 7.2.6 Nordic Countries | | |
      7. 7.2.7 Russia | | |
      8. 7.2.8 Rest of Europe | |
    3. 7.3 Asia-Pacific | | |
      1. 7.3.1 China | | |
      2. 7.3.2 India | | |
      3. 7.3.3 Japan | | |
      4. 7.3.4 South Korea | | |
      5. 7.3.5 ASEAN | | |
      6. 7.3.6 Rest of Asia-Pacific | |
    4. 7.4 South America | | |
      1. 7.4.1 Brazil | | |
      2. 7.4.2 Argentina | | |
      3. 7.4.3 Rest of South America | |
    5. 7.5 Middle East & Africa | | |
      1. 7.5.1 Saudi Arabia | | |
      2. 7.5.2 United Arab Emirates | | |
      3. 7.5.3 South Africa | | |
      4. 7.5.4 Egypt | | |
      5. 7.5.5 Rest of Middle East & Africa | |
  8. 8 Future Outlook (2026–2035) | |
    1. 8.1 AI Versus AI: Deepfakes and Agentic Identities | |
    2. 8.2 Passwordless by Default | |
    3. 8.3 Platform Consolidation | |
    4. 8.4 Regulatory Convergence and Digital Identity Wallets | |
  9. 9 Segmentation Analysis | |
    1. 9.1 By Offering | | |
      1. 9.1.1 Solution | | |
      2. 9.1.2 Service | |
    2. 9.2 By Deployment | | |
      1. 9.2.1 On-Premise | | |
      2. 9.2.2 Cloud | |
    3. 9.3 By Authentication Method | | |
      1. 9.3.1 Knowledge-Based Authentication | | |
      2. 9.3.2 Possession-Based Authentication | | |
      3. 9.3.3 Inherence-Based (Biometric) Authentication | | |
      4. 9.3.4 Multi-Factor and Composite Authentication | | |
      5. 9.3.5 Adaptive Behavioral Authentication | |
    4. 9.4 By Organization Size | | |
      1. 9.4.1 Large Enterprises | | |
      2. 9.4.2 Small and Medium Enterprises | |
    5. 9.5 By End-User Vertical | | |
      1. 9.5.1 Banking and Financial Services | | |
      2. 9.5.2 Retail | | |
      3. 9.5.3 Government | | |
      4. 9.5.4 Healthcare | | |
      5. 9.5.5 IT and Telecom | | |
      6. 9.5.6 Others | |
  10. 10 Competitive Landscape | |
    1. 10.1 Market Concentration Analysis | |
    2. 10.2 Competitive Benchmarking Table | |
  11. 11 Recent News & Developments | |
  12. 12 Report Scope and Methodology | |
  13. 13 Detailed Sources and Citations | |
  14. 14 Frequently Asked Questions (FAQs) | | LIST OF TABLES | |
  15. TABLE 1 Report Snapshot – Key Market Metrics, 2025–2035 | |
  16. TABLE 2 Global Market Size and Forecast, by Revenue (USD Billion), 2021–2035 | |
  17. TABLE 3 Driver Impact Analysis | |
  18. TABLE 4 Restraints Impact Analysis | |
  19. TABLE 5 Regional Summary, 2025 | |
  20. TABLE 6 North America Market, by Country, 2025 | |
  21. TABLE 7 Europe Market, by Country, 2025 | |
  22. TABLE 8 Asia-Pacific Market, by Country, 2025 | |
  23. TABLE 9 South America Market, by Country, 2025 | |
  24. TABLE 10 Middle East & Africa Market, by Country, 2025 | |
  25. TABLE 11 Market Segmentation, by Offering, 2025 | |
  26. TABLE 12 Market Segmentation, by Deployment, 2025 | |
  27. TABLE 13 Market Segmentation, by Authentication Method, 2025 | |
  28. TABLE 14 Market Segmentation, by Organization Size, 2025 | |
  29. TABLE 15 Market Segmentation, by End-User Vertical, 2025 | |
  30. TABLE 16 Competitive Benchmarking Table | |
  31. TABLE 17 Report Scope and Methodology | |
  32. TABLE 18 Detailed Sources and Citations | |
  33. TABLE 19 Segmentation Quick Reference | | LIST OF FIGURES | |
  34. FIGURE 1 Market Dynamics Overview – Drivers, Restraints and Opportunities | |
  35. FIGURE 2 Industry Value Chain Analysis | |
  36. FIGURE 3 Porter's Five Forces Analysis | |
  37. FIGURE 4 Global Market Size Trend (USD Billion), 2021–2035 | |
  38. FIGURE 5 Year-over-Year Growth Rate, 2021–2035 | |
  39. FIGURE 6 Market Share, by Offering, 2025 | |
  40. FIGURE 7 Market Share, by Deployment, 2025 | |
  41. FIGURE 8 Market Share, by Authentication Method, 2025 | |
  42. FIGURE 9 Market Share, by Organization Size, 2025 | |
  43. FIGURE 10 Market Share, by End-User Vertical, 2025 | |
  44. FIGURE 11 Regional Market Share, 2025 | |
  45. FIGURE 12 Country-Level Growth Comparison, 2026–2035 | |
  46. FIGURE 13 Competitive Landscape – Estimated Revenue Share Ranges | |
  47. FIGURE 14 Competitive Positioning Matrix

Segmentation Quick Reference

DimensionSub-SegmentsDominant SegmentFastest Growing Segment
By OfferingSolution; ServiceSolution (71.4% share)Service (8.6% CAGR)
By DeploymentOn-Premise; CloudCloudCloud (8.8% CAGR)
By Authentication MethodKnowledge-Based Authentication; Possession-Based Authentication; Inherence-Based (Biometric) Authentication; Multi-Factor and Composite Authentication; Adaptive Behavioral AuthenticationMulti-Factor and Composite Authentication (40.1% share)Adaptive Behavioral Authentication (7.4% CAGR)
By Organization SizeLarge Enterprises; Small and Medium EnterprisesLarge Enterprises (61.5% share)Small and Medium Enterprises (8.7% CAGR)
By End-User VerticalBanking and Financial Services; Retail; Government; Healthcare; IT and Telecom; OthersBanking and Financial Services (27.6% share)Healthcare (7.3% CAGR)
By RegionNorth America; Europe; Asia-Pacific; South America; Middle East & AfricaNorth America (36.8% share)Asia-Pacific (8.9% CAGR)

Market Segmentation Overview

By Offering

Sub-SegmentKey Trend
SolutionRisk engines bundled into multi-year identity platform licenses
ServiceManaged tuning, bias audits and compliance advisory on subscription

Solution leads because banks and agencies procure risk scoring inside broader identity platform contracts. Service grows fastest as buyers lacking in-house analysts outsource threshold tuning and PSD2 or HIPAA mapping. The widening gap pushes software publishers to embed managed detection and SLA-backed support into their licenses.

By Deployment

Sub-SegmentKey Trend
On-PremiseRetained in classified, air-gapped and sovereignty-sensitive networks
CloudSaaS risk engines with cross-tenant threat intelligence

Cloud both leads and grows fastest, since pooled signals across tenants improve model accuracy and zero trust programs need elastic, location-independent evaluation. On-Premise holds a 33.5% share in defense and public sector settings where data cannot leave controlled facilities. Data-residency options are steadily eroding the reasons to stay on appliances.

By Authentication Method

Sub-SegmentKey Trend
Knowledge-Based AuthenticationDeclining to recovery and fallback roles as phishing exposes static secrets
Possession-Based AuthenticationHardware tokens persist in defense and critical infrastructure
Inherence-Based (Biometric) AuthenticationDevice biometrics standard in consumer banking apps
Multi-Factor and Composite AuthenticationCompliance-recognized baseline across regulated sectors
Adaptive Behavioral AuthenticationSilent scoring of device, location and behavior to trigger step-up only when needed

Multi-Factor and Composite Authentication leads because auditors and SCA rules recognize it explicitly. Adaptive Behavioral Authentication grows fastest as it removes unnecessary prompts while catching replayed credentials that static factors miss. Knowledge-Based Authentication trails, increasingly confined to account recovery.

By Organization Size

Sub-SegmentKey Trend
Large EnterprisesUnified policy layers across workforce, customer and machine identities
Small and Medium EnterprisesPay-as-you-grow SaaS tiers and MSP-delivered bundles

Large Enterprises dominate spending through complex workforces, regulated data and dedicated security teams. Small and Medium Enterprises grow fastest because templated rule sets and low-code connectors let lean IT teams deploy risk-based login without specialist staff. Managed service providers are the main distribution channel accelerating that uptake.

By End-User Vertical

Sub-SegmentKey Trend
Banking and Financial ServicesTransaction risk analysis for SCA exemptions and fraud reimbursement
RetailCheckout and loyalty-account takeover protection
GovernmentZero trust deadlines and citizen e-service access
HealthcareLow-friction clinician access and prescription diversion detection
IT and TelecomSIM-swap defense and privileged workforce access
OthersEducation, energy and manufacturing access control

Banking and Financial Services leads because SCA rules and reimbursement liability make fraud losses directly visible to regulators and shareholders. Healthcare grows fastest as EHR portals, telehealth and proposed HIPAA changes demand stronger yet frictionless clinician sign-in. Government demand follows federal zero trust milestones, while Retail spending centers on checkout protection.

6 minutes ago

Download PDF ×

We do not share your information with anyone. However, we may send you emails based on your report interest from time to time. You may contact us at any time to opt-out.