Certified Global Research Member
Isomar fd.webp Wcrc 57.webp
Key Questions Answered
  • Global Market Outlook
  • In-depth analysis of global and regional trends
  • Analyze and identify the major players in the market, their market share, key developments, etc.
  • To understand the capability of the major players based on products offered, financials, and strategies.
  • Identify disrupting products, companies, and trends.
  • To identify opportunities in the market.
  • Analyze the key challenges in the market.
  • Analyze the regional penetration of players, products, and services in the market.
  • Comparison of major players’ financial performance.
  • Evaluate strategies adopted by major players.
  • Recommendations
Why Choose Market Research Future?
  • Vigorous research methodologies for specific market.
  • Knowledge partners across the globe
  • Large network of partner consultants.
  • Ever-increasing/ Escalating data base with quarterly monitoring of various markets
  • Trusted by fortune 500 companies/startups/ universities/organizations
  • Large database of 5000+ markets reports.
  • Effective and prompt pre- and post-sales support.

Renewable Energy Market Research Report Information By Type (Hydropower, Wind Energy, Solar Energy, Bioenergy, Geothermal Energy and Ocean Energy), By End-Use (Industrial, Residential and Commercial), and By Region (North America, Europe, Asia-Pacific, and Rest Of The World) - Industry Size, Share, Trends & Forecast to 2030


ID: MRFR/E&P/0986-CR | 188 Pages | Author: Priya Nagrale| October 2020

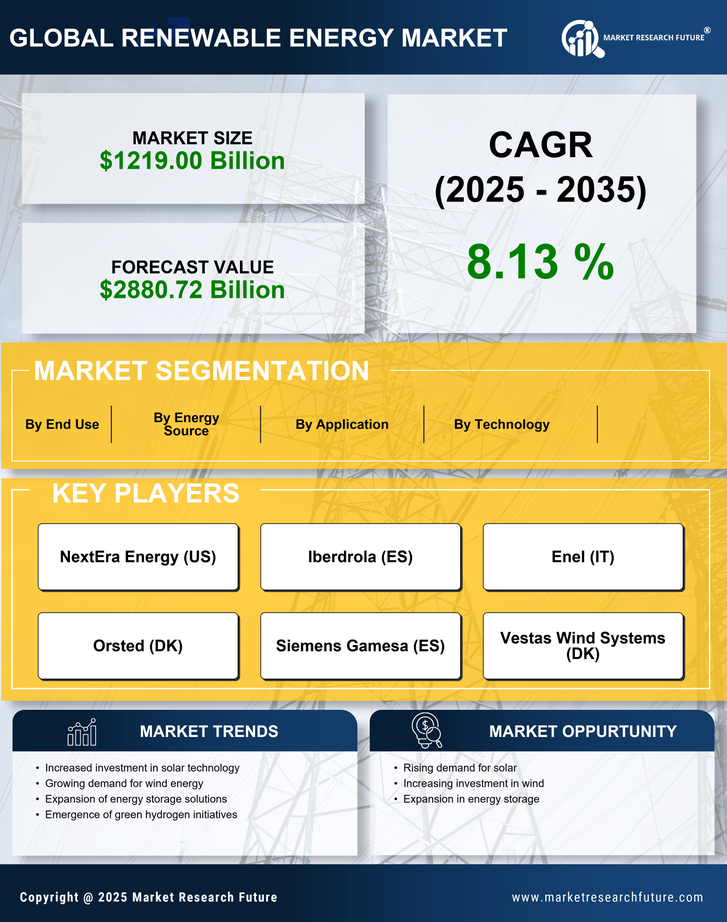
Renewable Energy Market Segmentation


Renewable Energy Type Outlook (USD Billion, 2018-2030)


  • Hydropower


  • Wind Energy


  • Solar Energy


  • Bioenergy


  • Geothermal Energy


  • Ocean Energy


Renewable Energy End-Use Outlook (USD Billion, 2018-2030)


  • Industrial


  • Residential


  • Commercial


Renewable Energy Regional Outlook (USD Billion, 2018-2030)


  • North America Outlook (USD Billion, 2018-2030)


    • North America Renewable Energy by Type


      • Hydropower


      • Wind Energy


      • Solar Energy


      • Bioenergy


      • Geothermal Energy


      • Ocean Energy


    • North America Renewable Energy by End-Use


      • Industrial


      • Residential


      • Commercial


    • US Outlook (USD Billion, 2018-2030)


    • US Renewable Energy by Type


      • Hydropower


      • Wind Energy


      • Solar Energy


      • Bioenergy


      • Geothermal Energy


      • Ocean Energy


    • US Renewable Energy by End-Use


      • Industrial


      • Residential


      • Commercial


    • Canada Outlook (USD Billion, 2018-2030)


    • Canada Renewable Energy by Type


      • Hydropower


      • Wind Energy


      • Solar Energy


      • Bioenergy


      • Geothermal Energy


      • Ocean Energy


    • Canada Renewable Energy by End-Use


      • Industrial


      • Residential


      • Commercial


  • Europe Outlook (USD Billion, 2018-2030)


    • Europe Renewable Energy by Type


      • Hydropower


      • Wind Energy


      • Solar Energy


      • Bioenergy


      • Geothermal Energy


      • Ocean Energy


    • Europe Renewable Energy by End-Use


      • Industrial


      • Residential


      • Commercial


    • Germany Outlook (USD Billion, 2018-2030)


    • Germany Renewable Energy by Type


      • Hydropower


      • Wind Energy


      • Solar Energy


      • Bioenergy


      • Geothermal Energy


      • Ocean Energy


    • Germany Renewable Energy by End-Use


      • Industrial


      • Residential


      • Commercial


    • France Outlook (USD Billion, 2018-2030)


    • France Renewable Energy by Type


      • Hydropower


      • Wind Energy


      • Solar Energy


      • Bioenergy


      • Geothermal Energy


      • Ocean Energy


    • France Renewable Energy by End-Use


      • Industrial


      • Residential


      • Commercial


    • UK Outlook (USD Billion, 2018-2030)


    • UK Renewable Energy by Type


      • Hydropower


      • Wind Energy


      • Solar Energy


      • Bioenergy


      • Geothermal Energy


      • Ocean Energy


    • UK Renewable Energy by End-Use


      • Industrial


      • Residential


      • Commercial


    • Italy Outlook (USD Billion, 2018-2030)


    • Italy Renewable Energy by Type


      • Hydropower


      • Wind Energy


      • Solar Energy


      • Bioenergy


      • Geothermal Energy


      • Ocean Energy


    • Italy Renewable Energy by End-Use


      • Industrial


      • Residential


      • Commercial


    • Spain Outlook (USD Billion, 2018-2030)


    • Spain Renewable Energy by Type


      • Hydropower


      • Wind Energy


      • Solar Energy


      • Bioenergy


      • Geothermal Energy


      • Ocean Energy


    • Spain Renewable Energy by End-Use


      • Industrial


      • Residential


      • Commercial


    • Rest Of Europe Outlook (USD Billion, 2018-2030)


    • Rest Of Europe Renewable Energy by Type


      • Hydropower


      • Wind Energy


      • Solar Energy


      • Bioenergy


      • Geothermal Energy


      • Ocean Energy


    • Rest Of Europe Renewable Energy by End-Use


      • Industrial


      • Residential


      • Commercial


  • Asia-Pacific Outlook (USD Billion, 2018-2030)


    • Asia-Pacific Renewable Energy by Type


      • Hydropower


      • Wind Energy


      • Solar Energy


      • Bioenergy


      • Geothermal Energy


      • Ocean Energy


    • Asia-Pacific Renewable Energy by End-Use


      • Industrial


      • Residential


      • Commercial


    • China Outlook (USD Billion, 2018-2030)


    • China Renewable Energy by Type


      • Hydropower


      • Wind Energy


      • Solar Energy


      • Bioenergy


      • Geothermal Energy


      • Ocean Energy


    • China Renewable Energy by End-Use


      • Industrial


      • Residential


      • Commercial


    • Japan Outlook (USD Billion, 2018-2030)


    • Japan Renewable Energy by Type


      • Hydropower


      • Wind Energy


      • Solar Energy


      • Bioenergy


      • Geothermal Energy


      • Ocean Energy


    • Japan Renewable Energy by End-Use


      • Industrial


      • Residential


      • Commercial


    • India Outlook (USD Billion, 2018-2030)


    • India Renewable Energy by Type


      • Hydropower


      • Wind Energy


      • Solar Energy


      • Bioenergy


      • Geothermal Energy


      • Ocean Energy


    • India Renewable Energy by End-Use


      • Industrial


      • Residential


      • Commercial


    • Australia Outlook (USD Billion, 2018-2030)


    • Australia Renewable Energy by Type


      • Hydropower


      • Wind Energy


      • Solar Energy


      • Bioenergy


      • Geothermal Energy


      • Ocean Energy


    • Australia Renewable Energy by End-Use


      • Industrial


      • Residential


      • Commercial


    • Rest of Asia-Pacific Outlook (USD Billion, 2018-2030)


    • Rest of Asia-Pacific Renewable Energy by Type


      • Hydropower


      • Wind Energy


      • Solar Energy


      • Bioenergy


      • Geothermal Energy


      • Ocean Energy


    • Rest of Asia-Pacific Renewable Energy by End-Use


      • Industrial


      • Residential


      • Commercial


  • Rest of the World Outlook (USD Billion, 2018-2030)


    • Rest of the World Renewable Energy by Type


      • Hydropower


      • Wind Energy


      • Solar Energy


      • Bioenergy


      • Geothermal Energy


      • Ocean Energy


    • Rest of the World Renewable Energy by End-Use


      • Industrial


      • Residential


      • Commercial


    • Middle East Outlook (USD Billion, 2018-2030)


    • Middle East Renewable Energy by Type


      • Hydropower


      • Wind Energy


      • Solar Energy


      • Bioenergy


      • Geothermal Energy


      • Ocean Energy


    • Middle East Renewable Energy by End-Use


      • Industrial


      • Residential


      • Commercial


    • Africa Outlook (USD Billion, 2018-2030)


    • Africa Renewable Energy by Type


      • Hydropower


      • Wind Energy


      • Solar Energy


      • Bioenergy


      • Geothermal Energy


      • Ocean Energy


    • Africa Renewable Energy by End-Use


      • Industrial


      • Residential


      • Commercial


    • Latin America Outlook (USD Billion, 2018-2030)


    • Latin America Renewable Energy by Type


      • Hydropower


      • Wind Energy


      • Solar Energy


      • Bioenergy


      • Geothermal Energy


      • Ocean Energy


    • Latin America Renewable Energy by End-Use


      • Industrial


      • Residential


      • Commercial


Research Methodology on Renewable Energy Market


⦁ Introduction


This research aims to investigate renewable energy as a viable option for a sustainable energy supply. The aim is to analyse the current state of the industry and compare the different types of renewable energy sources and future prospects for their potential in meeting global power demands. It aims to identify the challenges and opportunities afforded by the renewable energy industry and assess the current policy and market trends, and the growth potential. It also analyses the costs associated with renewable energy and the potential impact of renewable energy on the environment.


⦁ Research Design


The research design used in this study is a combination of both quantitative and qualitative methods. Quantitative methods are primarily used to analyse and compare the economic and environmental impacts of renewable energy sources. Qualitative methods such as interviews and focus groups are conducted to gain an in-depth understanding of the perceptions of stakeholders on renewable energy sources, as well as their potential for use as an effective alternative to traditional sources of energy. A literature review of both primary and secondary sources of research is conducted to analyse the current state of the renewable energy industry and the trends in the industry.


⦁ Sample Size and Sampling Techniques


The sample size in this research project is determined based on the availability of data. A stratified random sampling technique is used to select the participants in the focus groups and interviews, to select a representative sample of stakeholders. Once the participants are identified, their motivation to participate in the research is also taken into account.


⦁ Data Collection


The data collection methods used in this study make use of both primary and secondary data sources. Primary data is gathered primarily through face-to-face interviews and focus groups with relevant stakeholders in the renewable energy industry, including policymakers, industry professionals, investors, analysts and consumers. Relevant demographic information is also collected from the participants. Secondary data is gathered through the review of available publications, research papers, governmental data and reports, and media sources.


⦁ Data Analysis


The collected data is analysed using both quantitative and qualitative methods. The quantitative analysis focuses on the economic and environmental aspects of renewable energy. The collected data is summarised and analysed using descriptive statistics and inferential analysis. Qualitative analysis involves the interpretation and analysis of the collected data to gain an in-depth understanding of the perceptions of stakeholders regarding renewable energy. This includes the use of content analysis to identify themes and patterns in the collected data.


Conclusion


The research proposed in this study provides a comprehensive and in-depth analysis of the renewable energy industry, to understand the potential of renewable energy sources in meeting global power demands. The results of the study provide valuable insights into the current and future state of the industry, the associated costs and environmental impacts, and the market trends and policy considerations surrounding renewable energy sources. The findings of this research apply to both policymakers and industry players in evaluating the potential of renewable energy sources in providing a sustainable and viable future energy supply.

Leading companies partner with us for data-driven Insights
client_1 client_2 client_3 client_4 client_5 client_6 client_7 client_8 client_9 client_10
Please fill in Business Email for Quick Response

1 Executive Summary

2 Market Introduction

2.1 Definition 16

2.2 Scope Of The Study 16

2.3 Market Structure 17

3 Research Methodology

3.1 Research Process 19

3.2 Primary Research 20

3.3 Secondary Research 21

3.4 Market Size Estimation 22

3.5 Forecast Model 22

3.6 List Of Assumptions 23

4 Market Dynamics

4.1 Overview 25

4.2 Drivers 25

4.2.1 Rising Energy Demand Coupled With Increasing Share Of Renewable Energy In The Power Generation Mix 25

4.2.2 Favorable Government Initiatives 26

4.3 Opportunities 26

4.3.1 Scope Of Renewable Energy As A Power Source In Remote Areas 26

4.4 Restraints 27

4.4.1 High Cost Of Investment For Infrastructure Set Up 27

5 Global Renewable Energy Market, By Type

5.1 Overview 29

5.2 Hydropower 29

5.3 Wind Energy 29

5.4 Solar Energy 29

5.5 Bioenergy 30

5.6 Geothermal Energy 30

5.7 Ocean Energy 30

6 Global Renewable Energy Market, By End-Use

6.1 Overview 33

6.2 Industrial 33

6.2.1 Power 33

6.2.2 Iron & Steel 33

6.2.3 Chemicals And Petrochemicals 34

6.2.4 Oil & Gas 34

6.2.5 Food & Beverage 34

6.2.6 Automotive 34

6.2.7 Others 35

6.3 Residential 35

6.4 Commercial 36

7 Global Renewable Energy Market, By Region

7.1 Overview 38

7.1.1 North America 39

7.1.1.1 US 41

7.1.1.2 Canada 42

7.1.1.3 Mexico 43

7.2 Asia-Pacific 44

7.2.1.1 China 46

7.2.1.2 Japan 47

7.2.1.3 India 48

7.2.1.4 Australia 50

7.2.1.5 Rest Of Asia-Pacific 51

7.2.2 Europe 53

7.2.2.1 UK 55

7.2.2.2 France 56

7.2.2.3 Italy 57

7.2.2.4 Germany 58

7.2.2.5 Rest Of Europe 59

7.2.3 South America 61

7.2.3.1 Argentina 63

7.2.3.2 Chile 64

7.2.3.3 Brazil 65

7.2.3.4 Rest Of South America 66

7.2.4 Middle East & Africa 68

7.2.4.1 UAE 70

7.2.4.2 Saudi Arabia 71

7.2.4.3 South Africa 72

7.2.4.4 Rest Of Middle East And Africa 73

8 Competitive Landscape

8.1 Competitive Scenario 75

8.2 Siemens AG And Canadian Solar Inc: The Leading Players In Terms Of Number Of Developments In The Market 76

8.3 Contracts & Agreements 77

8.4 Partnership & Collaboration 78

9 Company Profiles

9.1 Ocean Power Technologies, Inc 80

9.1.1 Company Overview 80

9.1.2 Financial Overview 80

9.1.3 Products/Services Offered 81

9.1.4 Key Developments 81

9.1.5 SWOT Analysis 82

9.1.6 Key Strategies 82

9.2 Ørsted A/S 83

9.2.1 Company Overview 83

9.2.2 Financial Overview 83

9.2.3 Products/Services Offered 84

9.2.4 Key Developments 84

9.2.5 SWOT Analysis 85

9.2.6 Key Strategies 85

9.3 General Electric 86

9.3.1 Company Overview 86

9.3.2 Financial Overview 86

9.3.3 Products And Solutions Offered 87

9.3.4 Key Developments 88

9.3.5 SWOT Analysis 89

9.3.6 Key Strategies 89

9.4 NextEra Energy, Inc 90

9.4.1 Company Overview 90

9.4.2 Financial Overview 90

9.4.3 Products And Services Offered 91

9.4.4 Key Developments 91

9.4.5 SWOT Analysis 92

9.4.6 Key Strategies 92

9.5 Enel Spa 93

9.5.1 Company Overview 93

9.5.2 Financial Overview 93

9.5.3 Product/Service Offered 94

9.5.4 Key Developments 95

9.5.5 SWOT Analysis 96

9.5.6 Key Strategies 96

9.6 On Power 97

9.6.1 Company Overview 97

9.6.2 Financial Overview 97

9.6.3 Products And Solutions Offered 97

9.6.4 Key Developments 97

9.6.5 SWOT Analysis 98

9.6.6 Key Strategies 98

9.7 Yingli Solar 99

9.7.1 Company Overview 99

9.7.2 Financial Overview 99

9.7.3 Product/Service Offered 101

9.7.4 Key Developments 101

9.7.5 SWOT Analysis 102

9.7.6 Key Strategies 102

9.8 Tocardo BV 103

9.8.1 Company Overview 103

9.8.2 Financial Overview 103

9.8.3 Key Developments 103

9.8.4 SWOT Analysis 104

9.8.5 Key Strategies 104

9.9 SynTech Bioenergy LLC 105

9.9.1 Company Overview 105

9.9.2 Financial Overview 105

9.9.3 Key Developments 106

9.9.4 SWOT Analysis 106

9.9.5 Key Strategies 106

9.10 Vestas Wind Systems A/S 107

9.10.1 Company Overview 107

9.10.2 Financial Overview 107

9.10.3 Products/Services Offered 109

9.10.4 Key Developments 110

9.10.5 SWOT Analysis 110

9.10.6 Key Strategies 110

9.11 Siemens AG 111

9.11.1 Company Overview 111

9.11.2 Financial Overview 111

9.11.3 Products/Services Offered 112

9.11.4 Key Developments 113

9.11.5 SWOT Analysis 114

9.11.6 Key Strategies 115

9.12 Canadian Solar Inc. 116

9.12.1 Company Overview 116

9.12.2 Financial Overview 116

9.12.3 Products/Services Offered 117

9.12.4 Key Developments 119

9.12.5 SWOT Analysis 120

9.12.6 Key Strategies 120

10 List Of Tables

TABLE 1 MARKET SYNOPSIS 14

TABLE 2 LIST OF ASSUMPTIONS 23

TABLE 3 GLOBAL RENEWABLE ENERGY MARKET, BY TYPE, 2024–2030 (USD BILLION) 31

TABLE 4 GLOBAL RENEWABLE ENERGY MARKET, BY INDUSTRIAL, 2024–2030 (USD BILLION) 35

TABLE 5 GLOBAL RENEWABLE ENERGY MARKET, BY END-USE, 2024–2030 (USD BILLION) 36

TABLE 6 GLOBAL RENEWABLE ENERGY MARKET, BY REGION, 2024–2030 (USD BILLION) 38

TABLE 7 NORTH AMERICA RENEWABLE ENERGY MARKET, BY COUNTRY, 2024–2030 (USD BILLION) 39

TABLE 8 NORTH AMERICA RENEWABLE ENERGY MARKET, BY TYPE, 2024–2030 (USD BILLION) 40

TABLE 9 NORTH AMERICA RENEWABLE ENERGY MARKET, BY END-USE, 2024–2030 (USD BILLION) 40

TABLE 10 US: RENEWABLE ENERGY MARKET, BY TYPE, 2024–2030 (USD BILLION) 41

TABLE 11 US: RENEWABLE ENERGY MARKET, BY END-USE, 2024–2030 (USD BILLION) 41

TABLE 12 CANADA: RENEWABLE ENERGY MARKET, BY TYPE, 2024–2030 (USD BILLION) 42

TABLE 13 CANADA: RENEWABLE ENERGY MARKET, BY END-USE, 2024–2030 (USD BILLION) 42

TABLE 14 MEXICO: RENEWABLE ENERGY MARKET, BY TYPE, 2024–2030 (USD BILLION) 43

TABLE 15 MEXICO: RENEWABLE ENERGY MARKET, BY END-USE, 2024–2030 (USD BILLION) 43

TABLE 16 ASIA-PACIFIC RENEWABLE ENERGY MARKET, BY COUNTRY, 2024–2030 (USD BILLION) 44

TABLE 17 ASIA-PACIFIC RENEWABLE ENERGY MARKET, BY TYPE, 2024–2030 (USD BILLION) 45

TABLE 18 ASIA-PACIFIC RENEWABLE ENERGY MARKET, BY END-USE, 2024–2030 (USD BILLION) 45

TABLE 19 CHINA RENEWABLE ENERGY MARKET, BY TYPE, 2024–2030 (USD BILLION) 46

TABLE 20 CHINA RENEWABLE ENERGY MARKET, BY END-USE, 2024–2030 (USD BILLION) 47

TABLE 21 JAPAN RENEWABLE ENERGY MARKET, BY TYPE, 2024–2030 (USD BILLION) 47

TABLE 22 JAPAN RENEWABLE ENERGY MARKET, BY END-USE, 2024–2030 (USD BILLION) 48

TABLE 23 INDIA RENEWABLE ENERGY MARKET, BY TYPE, 2024–2030 (USD BILLION) 49

TABLE 24 INDIA RENEWABLE ENERGY MARKET, BY END-USE, 2024–2030 (USD BILLION) 49

TABLE 25 AUSTRALIA RENEWABLE ENERGY MARKET, BY TYPE, 2024–2030 (USD BILLION) 50

TABLE 26 AUSTRALIA RENEWABLE ENERGY MARKET, BY END-USE, 2024–2030 (USD BILLION) 50

TABLE 27 REST OF ASIA-PACIFIC RENEWABLE ENERGY MARKET, BY TYPE, 2024–2030 (USD BILLION) 51

TABLE 28 REST OF ASIA-PACIFIC RENEWABLE ENERGY MARKET, BY END-USE, 2024–2030 (USD BILLION) 52

TABLE 29 EUROPE RENEWABLE ENERGY MARKET, BY COUNTRY, 2024–2030 (USD BILLION) 53

TABLE 30 EUROPE RENEWABLE ENERGY MARKET, BY TYPE, 2024–2030 (USD BILLION) 54

TABLE 31 EUROPE RENEWABLE ENERGY MARKET, BY END-USE, 2024–2030 (USD BILLION) 54

TABLE 32 UK RENEWABLE ENERGY MARKET, BY TYPE, 2024–2030 (USD BILLION) 55

TABLE 33 UK RENEWABLE ENERGY MARKET, BY END-USE, 2024–2030 (USD BILLION) 55

TABLE 34 FRANCE RENEWABLE ENERGY MARKET, BY TYPE, 2024–2030 (USD BILLION) 56

TABLE 35 FRANCE RENEWABLE ENERGY MARKET, BY END-USE, 2024–2030 (USD BILLION) 56

TABLE 36 ITALY RENEWABLE ENERGY MARKET, BY TYPE, 2024–2030 (USD BILLION) 57

TABLE 37 ITALY RENEWABLE ENERGY MARKET, BY END-USE, 2024–2030 (USD BILLION) 57

TABLE 38 GERMANY RENEWABLE ENERGY MARKET, BY TYPE, 2024–2030 (USD BILLION) 58

TABLE 39 GERMANY RENEWABLE ENERGY MARKET, BY END-USE, 2024–2030 (USD BILLION) 59

TABLE 40 REST OF EUROPE RENEWABLE ENERGY MARKET, BY TYPE, 2024–2030 (USD BILLION) 59

TABLE 41 REST OF EUROPE RENEWABLE ENERGY MARKET, BY END-USE, 2024–2030 (USD BILLION) 60

TABLE 42 SOUTH AMERICA RENEWABLE ENERGY MARKET, BY COUNTRY, 2024–2030 (USD BILLION) 61

TABLE 43 SOUTH AMERICA RENEWABLE ENERGY MARKET, BY TYPE, 2024–2030 (USD BILLION) 62

TABLE 44 SOUTH AMERICA RENEWABLE ENERGY MARKET, BY END-USE, 2024–2030 (USD BILLION) 62

TABLE 45 ARGENTINA RENEWABLE ENERGY MARKET, BY TYPE, 2024–2030 (USD BILLION) 63

TABLE 46 ARGENTINA RENEWABLE ENERGY MARKET, BY END-USE, 2024–2030 (USD BILLION) 63

TABLE 47 CHILE RENEWABLE ENERGY MARKET, BY TYPE, 2024–2030 (USD BILLION) 64

TABLE 48 CHILE RENEWABLE ENERGY MARKET, BY END-USE, 2024–2030 (USD BILLION) 64

TABLE 49 BRAZIL RENEWABLE ENERGY MARKET, BY TYPE, 2024–2030 (USD BILLION) 65

TABLE 50 BRAZIL RENEWABLE ENERGY MARKET, BY END-USE, 2024–2030 (USD BILLION) 66

TABLE 51 REST OF SOUTH AMERICA RENEWABLE ENERGY MARKET, BY TYPE, 2024–2030 (USD BILLION) 67

TABLE 52 REST OF SOUTH AMERICA RENEWABLE ENERGY MARKET, BY END-USE, 2024–2030 (USD BILLION) 67

TABLE 53 MIDDLE EAST & AFRICA RENEWABLE ENERGY MARKET, BY COUNTRY, 2024–2030 (USD BILLION) 68

TABLE 54 MIDDLE EAST & AFRICA RENEWABLE ENERGY MARKET, BY TYPE2024–2030 (USD BILLION) 69

TABLE 55 MIDDLE EAST & AFRICA RENEWABLE ENERGY MARKET, BY END-USE, 2024–2030 (USD BILLION) 69

TABLE 56 UAE: RENEWABLE ENERGY MARKET, BY TYPE, 2024–2030 (USD BILLION) 70

TABLE 57 UAE: RENEWABLE ENERGY MARKET, BY END-USE, 2024–2030 (USD BILLION) 70

TABLE 58 SAUDI ARABIA: RENEWABLE ENERGY MARKET, BY TYPE, 2024–2030 (USD BILLION) 71

TABLE 59 SAUDI ARABIA: RENEWABLE ENERGY MARKET, BY END-USE, 2024–2030 (USD BILLION) 71

TABLE 60 SOUTH AFRICA: RENEWABLE ENERGY MARKET, BY TYPE, 2024–2030 (USD BILLION) 72

TABLE 61 SOUTH AFRICA: RENEWABLE ENERGY MARKET, BY END-USE, 2024–2030 (USD BILLION) 72

TABLE 62 REST OF MIDDLE EAST AND AFRICA: RENEWABLE ENERGY MARKET, BY TYPE, 2024–2030 (USD BILLION) 73

TABLE 63 REST OF MIDDLE EAST AND AFRICA: RENEWABLE ENERGY MARKET, BY END-USE, 2024–2030 (USD BILLION) 73

TABLE 64 SIEMENS AG AND CANADIAN SOLAR INC: THE MOST ACTIVE PLAYERS IN THE GLOBAL RENEWABLE ENERGY MARKET 76

11 List Of Figures

FIGURE 1 RENEWABLE ENERGY MARKET: MARKET STRUCTURE 17

FIGURE 2 RESEARCH PROCESS OF MRFR 19

FIGURE 3 TOP-DOWN & BOTTOM-UP APPROACHES 22

FIGURE 4 GLOBAL RENEWABLE ENERGY INVESTMENT, 2022 (USD BILLION) 25

FIGURE 5 GLOBAL RENEWABLE ENERGY MARKET, BY TYPE, 2022 (% SHARE) 30

FIGURE 6 GLOBAL RENEWABLE ENERGY MARKET, BY INDUSTRIAL END-USER, 2022 (% SHARE) 35

FIGURE 7 GLOBAL RENEWABLE ENERGY MARKET, BY END-USE, 2022 (% SHARE) 36

FIGURE 8 GLOBAL RENEWABLE ENERGY MARKET, BY REGION, 2022 (% SHARE) 38

FIGURE 9 NORTH AMERICA RENEWABLE ENERGY MARKET, BY COUNTRY, 2022 (% SHARE) 39

FIGURE 10 ASIA-PACIFIC RENEWABLE ENERGY MARKET, BY COUNTRY, 2022 (% SHARE) 44

FIGURE 11 EUROPE RENEWABLE ENERGY MARKET, BY COUNTRY, 2022 (% SHARE) 53

FIGURE 12 SOUTH AMERICA RENEWABLE ENERGY MARKET, BY COUNTRY, 2022 (% SHARE) 61

FIGURE 13 MIDDLE EAST & AFRICA RENEWABLE ENERGY MARKET, BY COUNTRY, 2022 (% SHARE) 68

FIGURE 14 GROWTH STRATEGIES ADOPTED BY KEY PLAYERS GLOBAL RENEWABLE ENERGY MARKET, 2024–2030, (%) 75

FIGURE 15 CONTRACTS & AGREEMENTS: % SHARE BY KEY PLAYERS, 2024–2030, (%) 77

FIGURE 16 PARTNERSHIP & COLLABORATION: % SHARE BY KEY PLAYERS, 2024–2030, (%) 78

FIGURE 17 OCEAN POWER TECHNOLOGIES, INC.: TOTAL REVENUE (2024–2030) 80

FIGURE 18 OCEAN POWER TECHNOLOGIES, INC: REGIONAL REVENUE (2022) 81

FIGURE 19 OCEAN POWER TECHNOLOGIES, INC.: SWOT ANALYSIS 82

FIGURE 20 ØRSTED A/S: TOTAL REVENUE (2024–2030) 83

FIGURE 21 ØRSTED A/S: REGIONAL REVENUE (2022) 84

FIGURE 22 ØRSTED A/S: SWOT ANALYSIS 85

FIGURE 23 GENERAL ELECTRIC: TOTAL REVENUE VS SEGMENTAL REVENUE (2024–2030) 86

FIGURE 24 GENERAL ELECTRIC: REGIONAL REVENUE (2022) 86

FIGURE 25 GENERAL ELECTRIC: SWOT ANALYSIS 89

FIGURE 26 NEXTERA ENERGY INC: TOTAL REVENUE VS SEGMENTAL REVENUE (2024–2030) 90

FIGURE 27 NEXTERA ENERGY INC: SWOT ANALYSIS 92

FIGURE 28 ENEL SPA: TOTAL REVENUE VS SEGMENTAL REVENUE (2024–2030) 93

FIGURE 29 ENEL SPA: REGIONAL REVENUE (2022) 94

FIGURE 30 ENEL SPA: SWOT ANALYSIS 96

FIGURE 31 ON POWER: SWOT ANALYSIS 98

FIGURE 32 YINGLI SOLAR: TOTAL REVENUE VS SEGMENTAL REVENUE (2024–2030) 99

FIGURE 33 YINGLI SOLAR: REGIONAL REVENUE (2022) 100

FIGURE 34 YINGLI SOLAR: SWOT ANALYSIS 102

FIGURE 35 GENERAL ELECTRIC: SWOT ANALYSIS 104

FIGURE 36 NEXTERA ENERGY INC: SWOT ANALYSIS 106

FIGURE 37 VESTAS WIND SYSTEMS A/S: TOTAL REVENUE (2024–2030) 107

FIGURE 38 VESTAS WIND SYSTEMS A/S: REGIONAL REVENUE (2022) 108

FIGURE 39 VESTAS WIND SYSTEMS A/S: SWOT ANALYSIS 110

FIGURE 40 SIEMENS AG: TOTAL REVENUE VS SEGMENTAL REVENUE (2024–2030) 111

FIGURE 41 SIEMENS AG: REGIONAL REVENUE (2022) 112

FIGURE 42 SIEMENS AG: SWOT ANALYSIS 114

FIGURE 43 CANADIAN SOLAR INC.: TOTAL REVENUE (2024–2030) 116

FIGURE 44 CANADIAN SOLAR INC: REGIONAL REVENUE (2022) 116

FIGURE 45 CANADIAN SOLAR INC.: SWOT ANALYSIS 120

Purchase Option
Single User $ 4,950
Multiuser License $ 5,950
Enterprise User $ 7,250
Compare Licenses
Tailored for You
  • Dedicated Research on any specifics segment or region.
  • Focused Research on specific players in the market.
  • Custom Report based only on your requirements.
  • Flexibility to add or subtract any chapter in the study.
  • Historic data from 2014 and forecasts outlook till 2040.
  • Flexibility of providing data/insights in formats (PDF, PPT, Excel).
  • Provide cross segmentation in applicable scenario/markets.