Segmentation Quick Reference
| Dimension | Sub-Segments | Dominant Segment | Fastest Growing Segment |
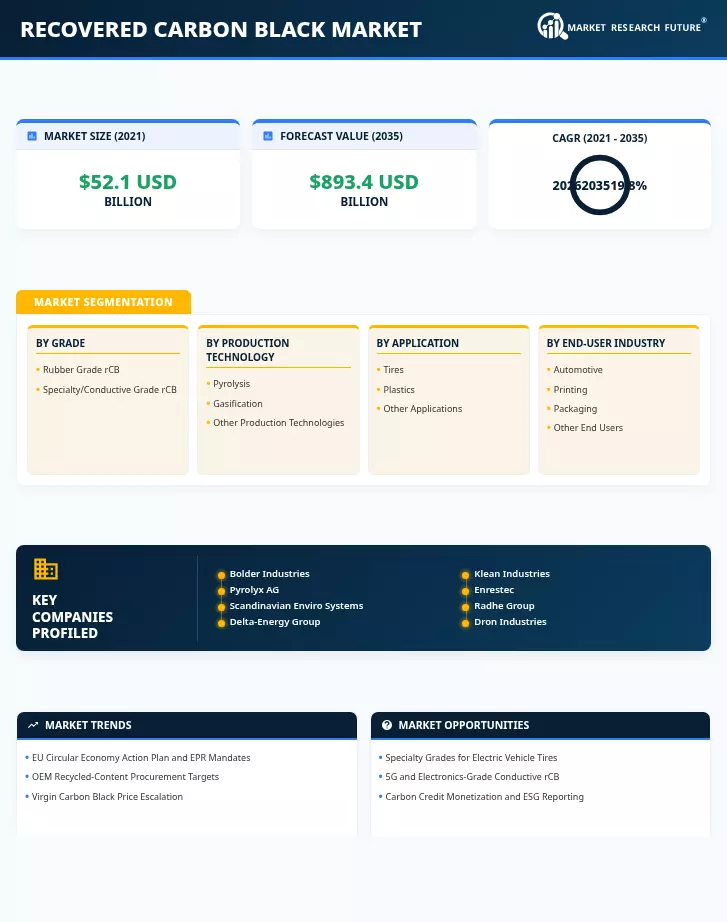
| Grade | Rubber Grade rCB, Specialty/Conductive Grade rCB | Rubber Grade rCB | Specialty/Conductive Grade rCB |
| Production Technology | Pyrolysis, Gasification, Other Production Technologies | Pyrolysis | Gasification |
| Application | Tires, Plastics, Other Applications | Tires | Plastics |
| End-User Industry | Automotive, Printing and Packaging, Other End Users | Automotive | Printing and Packaging |
| Geography | Asia-Pacific, North America, Europe, South America, the Middle East & Africa | Europe | North America |
Market Segmentation Overview
By Grade
| Sub-Segment | Key Trend |
| Rubber Grade rCB | OEM mandates for recycled content in tire compounds are driving steady volume growth, with substitution rates increasing from 10% to 20% loading. |
| Specialty/Conductive Grade rCB | Demand from 5G EMI shielding and EV battery applications is creating premium pricing opportunities for advanced post-treated grades. |
Rubber-grade rCB remains the volume backbone of the recovered carbon black industry, directly linked to end-of-life tire processing throughput. Specialty grades represent the margin frontier, requiring additional capital investment in surface activation and particle engineering but commanding price premiums of 2–3x over standard rubber grades.
By Production Technology
| Sub-Segment | Key Trend |
| Pyrolysis | Continuous reactor designs are scaling to 50,000+ tons/year nameplate capacity, with AI-driven process control reducing quality variability. |
| Gasification | Pilot-stage development in Japan and South Korea targets syngas co-production alongside recovered carbon materials. |
| Other Production Technologies | Mechanical and devulcanization approaches serve niche applications but lack the scale economics of thermal processes. |
Pyrolysis dominates because it simultaneously produces rCB, fuel oil, and recovered steel—a three-product revenue model that strengthens unit economics. Gasification offers higher energy yields but lower rCB quality, positioning it as a complementary rather than competing pathway.
By Application
| Sub-Segment | Key Trend |
| Tires | Recycled content mandates in Europe and automaker sustainability commitments are driving structured offtake agreements for tire-grade rCB. |
| Plastics | Masterbatch producers are qualifying rCB as a cost-effective colorant and reinforcing filler for automotive and agricultural plastics. |
| Other Applications | Inks, coatings, and construction sealants represent emerging application channels with lower volume but favorable pricing. |
The tire application dominates due to the circular logic of tire-to-tire recycling—rCB produced from end-of-life tires returning to tire manufacturing. Plastics compounding is the breakout growth channel as formulation acceptance broadens.
By End-User Industry
| Sub-Segment | Key Trend |
| Automotive | Scope 3 reporting and recycled-content procurement targets are embedding rCB into automotive supply chain specifications. |
| Printing and Packaging | Sustainable ink reformulations and recyclable packaging mandates are creating new demand channels for fine-particle rCB grades. |
| Other End Users | Recovered Carbon Black Market, consumer goods, and industrial rubber goods represent a fragmented but collectively significant demand pool. |
Automotive's dominance reflects both the tire and non-tire rubber component markets that consume the majority of global carbon black output. Printing and packaging offer the most attractive incremental growth trajectory as brand owners pursue sustainability commitments across their full packaging portfolios.
By Geography
| Sub-Segment | Key Trend |
| Europe | Mature tire collection infrastructure, binding EPR mandates, and Michelin/Continental JVs sustain the largest production and consumption base. |
| Asia-Pacific | China's regulatory formalization and India's EPR rollout are transforming fragmented informal recycling into structured industrial markets. |
| North America | U.S. Gulf Coast and Ontario greenfield projects are driving the fastest regional capacity expansion through 2028. |
| South America | Brazil's CONAMA tire stewardship rules provide a regulatory foundation for nascent pyrolysis capacity development. |
| Middle East & Africa | UAE waste diversion targets and South African standards development signal early-stage market formation. |
Europe's leadership position is structural, built on regulatory frameworks that predate commercial rCB production by over a decade. North America's growth trajectory reflects a concentrated burst of project finance activity that will reshape the global supply landscape by the end of the decade.