ID: MRFR/F-B & N/1350-HCR | August 2022 | Region: Global | 90 Pages
Table of Contents
1. EXECUTIVE SUMMARY
1.1. Market Attractiveness Analysis
1.1.1. Global Real Chocolate Market, by Type
1.1.2. Global Real Chocolate Market, by Application
1.1.3. Global Real Chocolate Market, by Region
1.1.4. Global Compound Chocolate Market, by Type
1.1.5. Global Compound Chocolate Market, by Application
1.1.6. Global Compound Chocolate Market, by Region
2. MARKET INTRODUCTION
2.1. Definition
2.2. Scope of the Study
2.3. Market Structure
2.4. Key Buying Criteria
2.5. Macro Factor Indicator Analysis
3. RESEARCH METHODOLOGY
3.1. Research Process
3.2. Primary Research
3.3. Secondary Research
3.4. Market Size Estimation
3.5. Forecast Model
3.6. List of Assumptions
4. MARKET DYNAMICS
4.1. Introduction
4.2. Drivers
4.3. Restraints
4.4. Opportunities
4.5. Challenges
5. MARKET FACTOR ANALYSIS
5.1. Value Chain Analysis
5.2. Supply Chain Analysis
5.3. Porterβs Five Forces Model
5.3.1. Bargaining Power of Suppliers
5.3.2. Bargaining Power of Buyers
5.3.3. Threat of New Entrants
5.3.4. Threat of Substitutes
5.3.5. Intensity of Rivalry
6. GLOBAL REAL CHOCOLATE MARKET, BY TYPE
6.1. Introduction
6.2. Dark
6.2.1. Dark: Market Estimates & Forecast by Region/Country, 2020β2027
6.3. Milk
6.3.1. Milk: Market Estimates & Forecast by Region/Country, 2020β2027
6.4. White
6.4.1. White: Market Estimates & Forecast by Region/Country, 2020β2027
7. GLOBAL REAL CHOCOLATE MARKET, BY APPLICATION
7.1. Introduction
7.2. Bakery & Confectionery
7.2.1. Bakery & Confectionery: Market Estimates & Forecast by Region/Country, 2020β2027
7.3. Dairy & Frozen Desserts
7.3.1. Dairy & Frozen Desserts: Market Estimates & Forecast by Region/Country, 2020β2027
7.4. Syrups & Spreads
7.4.1. Syrups & Spreads: Market Estimates & Forecast by Region/Country, 2020β2027
7.5. Beverages
7.5.1. Beverages: Market Estimates & Forecast by Region/Country, 2020β2027
7.6. Others
7.6.1. Others: Market Estimates & Forecast by Region/Country, 2020β2027
8. GLOBAL REAL CHOCOLATE MARKET, BY REGION
8.1. Introduction
8.2. North America
8.2.1. US
8.2.2. Canada
8.2.3. Mexico
8.3. Europe
8.3.1. Germany
8.3.2. UK
8.3.3. France
8.3.4. Italy
8.3.5. Rest of Europe
8.4. Asia-Pacific
8.4.1. China
8.4.2. Japan
8.4.3. India
8.4.4. Australia & New Zealand
8.4.5. Rest of Asia-Pacific
8.5. Rest of the World
8.5.1. Latin America
8.5.2. Middle East
8.5.3. Africa
9. GLOBAL COMPOUND CHOCOLATE MARKET, BY TYPE
9.1. Introduction
9.2. Dark
9.2.1. Dark: Market Estimates & Forecast by Region/Country, 2020β2027
9.3. Milk
9.3.1. Milk: Market Estimates & Forecast by Region/Country, 2020β2027
9.4. White
9.4.1. White: Market Estimates & Forecast by Region/Country, 2020β2027
10. GLOBAL COMPOUND CHOCOLATE MARKET, BY APPLICATION
10.1. Introduction
10.2. Bakery & Confectionery
10.2.1. Bakery & Confectionery: Market Estimates & Forecast by Region/Country, 2020β2027
10.3. Dairy & Frozen Desserts
10.3.1. Dairy & Frozen Desserts: Market Estimates & Forecast by Region/Country, 2020β2027
10.4. Syrups & Spreads
10.4.1. Syrups & Spreads: Market Estimates & Forecast by Region/Country, 2020β2027
10.5. Beverages
10.5.1. Beverages: Market Estimates & Forecast by Region/Country, 2020β2027
10.6. Others
10.6.1. Others: Market Estimates & Forecast by Region/Country, 2020β2027
11. GLOBAL COMPOUND CHOCOLATE MARKET, BY REGION
11.1. Introduction
11.2. North America
11.2.1. US
11.2.2. Canada
11.2.3. Mexico
11.3. Europe
11.3.1. Germany
11.3.2. UK
11.3.3. France
11.3.4. Italy
11.3.5. Rest of Europe
11.4. Asia-Pacific
11.4.1. China
11.4.2. Japan
11.4.3. India
11.4.4. Australia & New Zealand
11.4.5. Rest of Asia-Pacific
11.5. Rest of the World
11.5.1. Latin America
11.5.2. Middle East
11.5.3. Africa
12. COMPETITIVE LANDSCAPE
12.1. Introduction
12.2. Competitive Benchmarking
12.3. Development Share Analysis
12.4. Key Developments & Growth Strategies
13. COMPANY PROFILES
13.1. Mars Inc.
13.1.1. Company Overview
13.1.2. Financial Overview
13.1.3. Products Offered
13.1.4. Key Developments
13.1.5. SWOT Analysis
13.1.6. Key Strategies
13.2. Mondelez International, Inc.
13.2.1. Company Overview
13.2.2. Financial Overview
13.2.3. Products Offered
13.2.4. Key Developments
13.2.5. SWOT Analysis
13.2.6. Key Strategies
13.3. The Hershey Co.
13.3.1. Company Overview
13.3.2. Financial Overview
13.3.3. Products Offered
13.3.4. Key Developments
13.3.5. SWOT Analysis
13.3.6. Key Strategies
13.4. Barry Callebaut AG
13.4.1. Company Overview
13.4.2. Financial Overview
13.4.3. Products Offered
13.4.4. Key Developments
13.4.5. SWOT Analysis
13.4.6. Key Strategies
13.5. Nestle S.A.
13.5.1. Company Overview
13.5.2. Financial Overview
13.5.3. Products Offered
13.5.4. Key Developments
13.5.5. SWOT Analysis
13.5.6. Key Strategies
13.6. Blommer Chocolate Company
13.6.1. Company Overview
13.6.2. Financial Overview
13.6.3. Products Offered
13.6.4. Key Developments
13.6.5. SWOT Analysis
13.6.6. Key Strategies
13.7. Foleyβs Candies Ltd
13.7.1. Company Overview
13.7.2. Financial Overview
13.7.3. Products Offered
13.7.4. Key Developments
13.7.5. SWOT Analysis
13.7.6. Key Strategies
13.8. Guittard Chocolate Company
13.8.1. Company Overview
13.8.2. Financial Overview
13.8.3. Products Offered
13.8.4. Key Developments
13.8.5. SWOT Analysis
13.8.6. Key Strategies
13.9. Ferrero SPA
13.9.1. Company Overview
13.9.2. Financial Overview
13.9.3. Products Offered
13.9.4. Key Developments
13.9.5. SWOT Analysis
13.9.6. Key Strategies
13.10. Alpezzi Chocolate
13.10.1. Company Overview
13.10.2. Financial Overview
13.10.3. Products Offered
13.10.4. Key Developments
13.10.5. SWOT Analysis
13.10.6. Key Strategies
14. APPENDIX
14.1. General Sources & References
14.2. List of Abbreviation
β
LIST OF TABLES
Table 1 Global Real Chocolate Market, by Region, 2020β2027 (USD Million)
Table 2 Global Real Chocolate Market, by Type, 2020β2027 (USD Million)
Table 3 Global Real Chocolate Market, by Application, 2020β2027 (USD Million)
Table 4 North America: Real Chocolate Market, by Country, 2020β2027 (USD Million)
Table 5 North America: Real Chocolate Market, by Type, 2020β2027 (USD Million)
Table 6 North America: Real Chocolate Market, by Application, 2020β2027 (USD Million)
Table 7 US: Real Chocolate Market, by Type, 2020β2027 (USD Million)
Table 8 US: Real Chocolate Market, by Application, 2020β2027 (USD Million)
Table 9 Canada: Real Chocolate Market, by Type, 2020β2027 (USD Million)
Table 10 Canada: Real Chocolate Market, by Application, 2020β2027 (USD Million)
Table 11 Mexico: Real Chocolate Market, by Type, 2020β2027 (USD Million)
Table 12 Mexico: Real Chocolate Market, by Application, 2020β2027 (USD Million)
Table 13 Europe: Real Chocolate Market, by Country, 2020β2027 (USD Million)
Table 14 Europe: Real Chocolate Market, by Type, 2020β2027 (USD Million)
Table 15 Europe: Real Chocolate Market, by Application, 2020β2027 (USD Million)
Table 16 Germany: Real Chocolate Market, by Type, 2020β2027 (USD Million)
Table 17 Germany: Real Chocolate Market, by Application, 2020β2027 (USD Million)
Table 18 France: Real Chocolate Market, by Type, 2020β2027 (USD Million)
Table 19 France: Real Chocolate Market, by Application, 2020β2027 (USD Million)
Table 20 Italy: Real Chocolate Market, by Type, 2020β2027 (USD Million)
Table 21 Italy: Real Chocolate Market, by Application, 2020β2027 (USD Million)
Table 22 UK: Real Chocolate Market, by Type, 2020β2027 (USD Million)
Table 23 UK: Real Chocolate Market, by Application, 2020β2027 (USD Million)
Table 24 Rest of Europe: Real Chocolate Market, by Type, 2020β2027 (USD Million)
Table 25 Rest of Europe: Real Chocolate Market, by Application, 2020β2027 (USD Million)
Table 26 Asia-Pacific: Real Chocolate Market, by Country, 2020β2027 (USD Million)
Table 27 Asia-Pacific: Real Chocolate Market, by Type, 2020β2027 (USD Million)
Table 28 Asia-Pacific: Real Chocolate Market, by Application, 2020β2027 (USD Million)
Table 29 China: Real Chocolate Market, by Type, 2020β2027 (USD Million)
Table 30 China: Real Chocolate Market, by Application, 2020β2027 (USD Million)
Table 31 India: Real Chocolate Market, by Type, 2020β2027 (USD Million)
Table 32 India: Real Chocolate Market, by Application, 2020β2027 (USD Million)
Table 33 Japan: Real Chocolate Market, by Type, 2020β2027 (USD Million)
Table 34 Japan: Real Chocolate Market, by Application, 2020β2027 (USD Million)
Table 35 Australia & New Zealand: Real Chocolate Market, by Type, 2020β2027 (USD Million)
Table 36 Australia & New Zealand: Real Chocolate Market, by Application, 2020β2027 (USD Million)
Table 37 Rest of Asia-Pacific: Real Chocolate Market, by Type, 2020β2027 (USD Million)
Table 38 Rest of Asia-Pacific: Real Chocolate Market, by Application, 2020β2027 (USD Million)
Table 39 Rest of the World (RoW): Real Chocolate Market, by Country, 2020β2027 (USD Million)
Table 40 Rest of the World (RoW): Real Chocolate Market, by Type, 2020β2027 (USD Million)
Table 41 Rest of the World (RoW): Real Chocolate Market, by Application, 2020β2027 (USD Million)
Table 42 Latin America: Real Chocolate Market, by Type, 2020β2027 (USD Million)
Table 43 Latin America: Real Chocolate Market, by Application, 2020β2027 (USD Million)
Table 44 Middle East: Real Chocolate Market, by Type, 2020β2027 (USD Million)
Table 45 Middle East: Real Chocolate Market, by Application, 2020β2027 (USD Million)
Table 46 Africa: Real Chocolate Market, by Type, 2020β2027 (USD Million)
Table 47 Africa: Real Chocolate Market, by Application, 2020β2027 (USD Million)
β
LIST OF FIGURES
FIGURE 1 Global Real Chocolate Market Segmentation
FIGURE 2 Forecast Research Methodology
FIGURE 3 Porterβs Five Forces Analysis of Global Real Chocolate Market
FIGURE 4 Value Chain of the Global Real Chocolate Market
FIGURE 5 Share of the Global Real Chocolate Market in 2018, by Country (%)
FIGURE 6 Global Real Chocolate Market, by Region, 2020β2027,
FIGURE 7 Global Real Chocolate Market Size, by Type, 2018
FIGURE 8 Share of the Global Real Chocolate Market, by Type, 2020β2027 (%)
FIGURE 9 Global Real Chocolate Market Size, by Application, 2018
FIGURE 10 Share of the Global Real Chocolate Market, by Application, 2020β2027 (%)
β
LIST OF TABLES
Table 1 Global Compound Chocolate Market, by Region, 2020β2027 (USD Million)
Table 2 Global Compound Chocolate Market, by Type, 2020β2027 (USD Million)
Table 3 Global Compound Chocolate Market, by Application, 2020β2027 (USD Million)
Table 4 North America: Compound Chocolate Market, by Country, 2020β2027 (USD Million)
Table 5 North America: Compound Chocolate Market, by Type, 2020β2027 (USD Million)
Table 6 North America: Compound Chocolate Market, by Application, 2020β2027 (USD Million)
Table 7 US: Compound Chocolate Market, by Type, 2020β2027 (USD Million)
Table 8 US: Compound Chocolate Market, by Application, 2020β2027 (USD Million)
Table 9 Canada: Compound Chocolate Market, by Type, 2020β2027 (USD Million)
Table 10 Canada: Compound Chocolate Market, by Application, 2020β2027 (USD Million)
Table 11 Mexico: Compound Chocolate Market, by Type, 2020β2027 (USD Million)
Table 12 Mexico: Compound Chocolate Market, by Application, 2020β2027 (USD Million)
Table 13 Europe: Compound Chocolate Market, by Country, 2020β2027 (USD Million)
Table 14 Europe: Compound Chocolate Market, by Type, 2020β2027 (USD Million)
Table 15 Europe: Compound Chocolate Market, by Application, 2020β2027 (USD Million)
Table 16 Germany: Compound Chocolate Market, by Type, 2020β2027 (USD Million)
Table 17 Germany: Compound Chocolate Market, by Application, 2020β2027 (USD Million)
Table 18 France: Compound Chocolate Market, by Type, 2020β2027 (USD Million)
Table 19 France: Compound Chocolate Market, by Application, 2020β2027 (USD Million)
Table 20 Italy: Compound Chocolate Market, by Type, 2020β2027 (USD Million)
Table 21 Italy: Compound Chocolate Market, by Application, 2020β2027 (USD Million)
Table 22 UK: Compound Chocolate Market, by Type, 2020β2027 (USD Million)
Table 23 UK: Compound Chocolate Market, by Application, 2020β2027 (USD Million)
Table 24 Rest of Europe: Compound Chocolate Market, by Type, 2020β2027 (USD Million)
Table 25 Rest of Europe: Compound Chocolate Market, by Application, 2020β2027 (USD Million)
Table 26 Asia-Pacific: Compound Chocolate Market, by Country, 2020β2027 (USD Million)
Table 27 Asia-Pacific: Compound Chocolate Market, by Type, 2020β2027 (USD Million)
Table 28 Asia-Pacific: Compound Chocolate Market, by Application, 2020β2027 (USD Million)
Table 29 China: Compound Chocolate Market, by Type, 2020β2027 (USD Million)
Table 30 China: Compound Chocolate Market, by Application, 2020β2027 (USD Million)
Table 31 India: Compound Chocolate Market, by Type, 2020β2027 (USD Million)
Table 32 India: Compound Chocolate Market, by Application, 2020β2027 (USD Million)
Table 33 Japan: Compound Chocolate Market, by Type, 2020β2027 (USD Million)
Table 34 Japan: Compound Chocolate Market, by Application, 2020β2027 (USD Million)
Table 35 Australia & New Zealand: Compound Chocolate Market, by Type, 2020β2027 (USD Million)
Table 36 Australia & New Zealand: Compound Chocolate Market, by Application, 2020β2027 (USD Million)
Table 37 Rest of Asia-Pacific: Compound Chocolate Market, by Type, 2020β2027 (USD Million)
Table 38 Rest of Asia-Pacific: Compound Chocolate Market, by Application, 2020β2027 (USD Million)
Table 39 Rest of the World (RoW): Compound Chocolate Market, by Country, 2020β2027 (USD Million)
Table 40 Rest of the World (RoW): Compound Chocolate Market, by Type, 2020β2027 (USD Million)
Table 41 Rest of the World (RoW): Compound Chocolate Market, by Application, 2020β2027 (USD Million)
Table 42 Latin America: Compound Chocolate Market, by Type, 2020β2027 (USD Million)
Table 43 Latin America: Compound Chocolate Market, by Application, 2020β2027 (USD Million)
Table 44 Middle East: Compound Chocolate Market, by Type, 2020β2027 (USD Million)
Table 45 Middle East: Compound Chocolate Market, by Application, 2020β2027 (USD Million)
Table 46 Africa: Compound Chocolate Market, by Type, 2020β2027 (USD Million)
Table 47 Africa: Compound Chocolate Market, by Application, 2020β2027 (USD Million)
LIST OF FIGURES
FIGURE 1 Global Compound Chocolate Market Segmentation
FIGURE 2 Forecast Research Methodology
FIGURE 3 Five Forces Analysis of Global Compound Chocolate Market
FIGURE 4 Value Chain of Global Compound Chocolate Market
FIGURE 5 Share of Global Compound Chocolate Market in 2020, by Country (%)
FIGURE 6 Global Compound Chocolate Market, by Region, 2020β2027,
FIGURE 7 Global Compound Chocolate Market Size, by Type, 2020
FIGURE 8 Share of Global Compound Chocolate Market, by Type, 2020β2027 (%)
FIGURE 9 Global Compound Chocolate Market Size, by Application, 2020
FIGURE 10 Share of Global Compound Chocolate Market, by Application, 2020β2027 (%)
$75,856 million
6.11 %
Europe
2020-2026
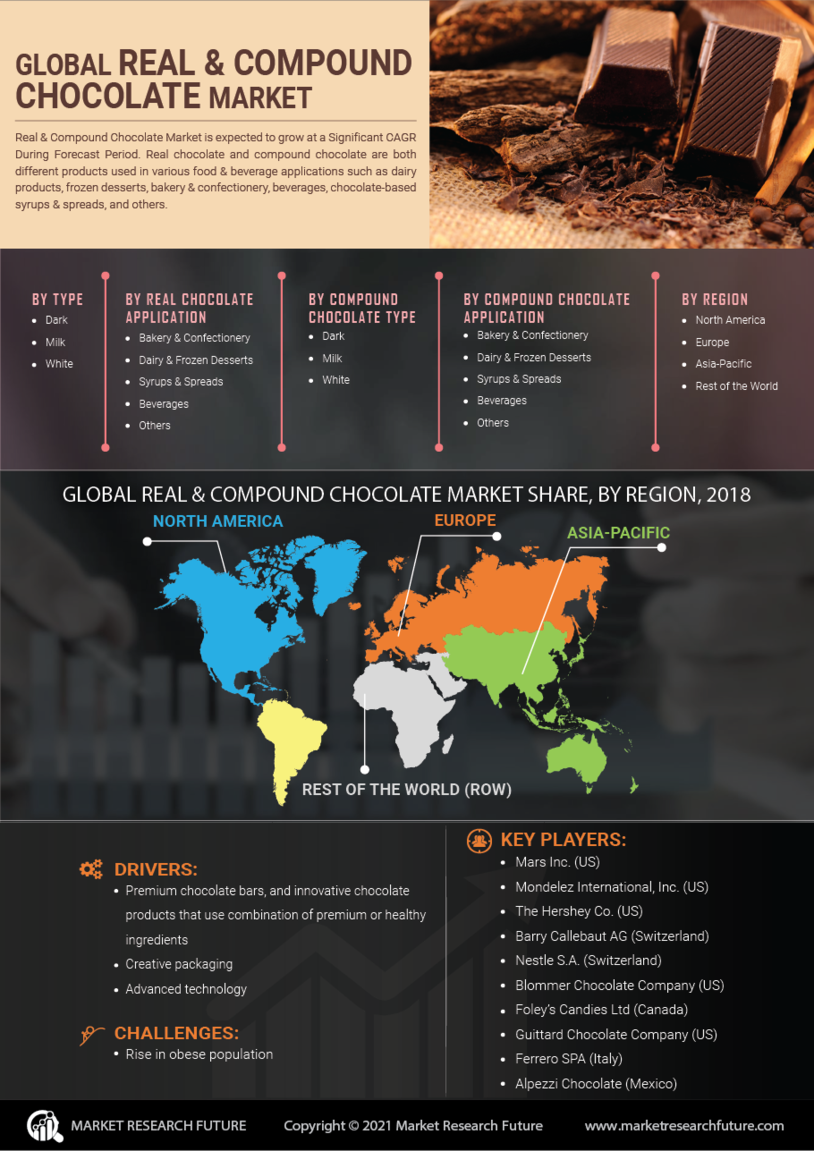
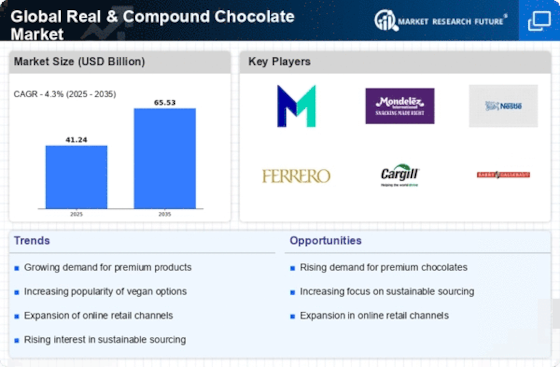
The real & compound chocolate market garnered a revenue of USD 73,856 million in 2018 and is expected to register a CAGR of 2.11% during the forecast period of 2019–2024. The global real chocolate market garnered a revenue of USD 13,078 million in 2018 and is expected to register a CAGR of 3.21% during the forecast period of 2019–2024. Real chocolate and compound chocolate are both different products used in various food & beverage applications such as dairy products, frozen desserts, bakery & confectionery, beverages, chocolate-based syrups & spreads, and others. The difference between the products is purely based on the ingredients used. Real chocolate consists of milk powder, sugar, and cocoa butter and cocoa mass, whereas, in compound chocolate, the cocoa bean derived cocoa butter and cocoa mass are replaced by vegetable oils and cocoa powder respectively.
The market for compound chocolate is expected to register a higher CAGR during the forecast period due to the low cost of compound chocolate and its increasing application in less expensive chocolate-based products. Additionally, the ability of compound chocolate to harden without tempering is promoting its use in ice creams, confectionery products, bakery products, and few other frozen desserts. Compound chocolate efficiently replicates the functional attributes of real chocolate at a lower price, which, in turn, is boosting the growth of compound chocolate market as compared to the real chocolate market. The key industry players in the real & compound chocolate market have adopted strategies such as geographic expansion, new product launch, acquisitions, agreement, and R&D to strengthen their business portfolio & presence. Most of the companies operating in this market are focusing on expanding their operations across new geographies, augmenting their capabilities and investing in research and development to offer products with better functionality.
Segmentation
The global real & compound chocolate market has been segmented based on type, application, and region.
By type, the global real & compound chocolate market has been classified as dark, white, and milk.
Based on application, real & compound chocolate market is segregated into, bakery & confectionery, dairy & frozen desserts, syrups & spreads, beverages, and others.
The global real & compound chocolate market has been studied with regard to four key regions—North America, Europe, Asia-Pacific, and the rest of the world.
The North American real & compound chocolate market has further been segmented into the US, Canada, and Mexico. The European real chocolate market has been classified as the UK, Germany, France, Italy, and the rest of Europe. The real chocolate market in Asia-Pacific has been divided into China, India, Japan, Australia and New Zealand, and the rest of Asia-Pacific. The real chocolate market in the rest of the world has been segmented into Latin America, the Middle East, and Africa.
The global compound chocolate market has been segmented based on type, application, and region.
By type, the global compound chocolate market has been classified as dark, white, and milk.
Based on application, the market is segregated into, bakery & confectionery, dairy & frozen desserts, syrups & spreads, beverages, and others.
The global compound chocolate market has been studied with regard to four key regions—North America, Europe, Asia-Pacific, and the rest of the world.
The North American compound chocolate market has further been segmented into the US, Canada, and Mexico. The European compound chocolate market has been classified as the UK, Germany, France, Italy, and the rest of Europe. The compound chocolate market in Asia-Pacific has been divided into China, India, Japan, Australia and New Zealand, and the rest of Asia-Pacific. The compound chocolate market in the rest of the world has been segmented into Latin America, the Middle East, and Africa.
Key Players
Regional Market Summary
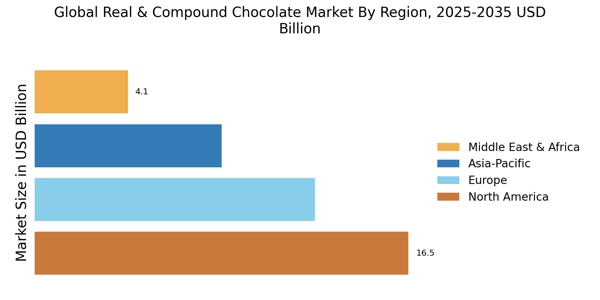
In both, global real compound chocolate market and global compound chocolate market, in 2018, Europe garnered the largest revenue share of nearly 42%. High demand for dark chocolate in Europe due to its health benefits is amongst the major determinant driving the growth of the regional market. Belgium, Germany, the UK, Italy, and Switzerland are the major country-level markets contributing to the growth of Europe real & compound chocolate market. However, Asia-Pacific is expected to register the highest CAGR during the forecast period 2019–2024 due to the increasing expansion of market players in the region and growth of application industries in Asia-Pacific.
Global Real Chocolate Market, by Type
Global Real Chocolate Market, by Application
Global Real Chocolate Market, by Region
Global Compound Chocolate Market, by Type
Global Compound Chocolate Market, by Application
Global Compound Chocolate Market, by Region
Intended Audience
Frequently Asked Questions (FAQ) :
Real & compound chocolate market projected to grow at a 3.21% CAGR between 2019-2024.
Europe is expected to dominate the real & compound chocolate market.
White, milk, and dark are the different types of real & compound chocolate.
Some major applications real & compound chocolate include beverages, syrups and spreads, dairy and frozen desserts, and others.
Different strategies adopted key players to strengthen their presence in the real & compound chocolate market include R&D, agreement, expansion, and new product launch.