Reading Glasses Market (2026 - 2035)

ID: MRFR/HC/10501-HCR 128 Pages Rahul Gotadki Last Updated: October 21, 2026
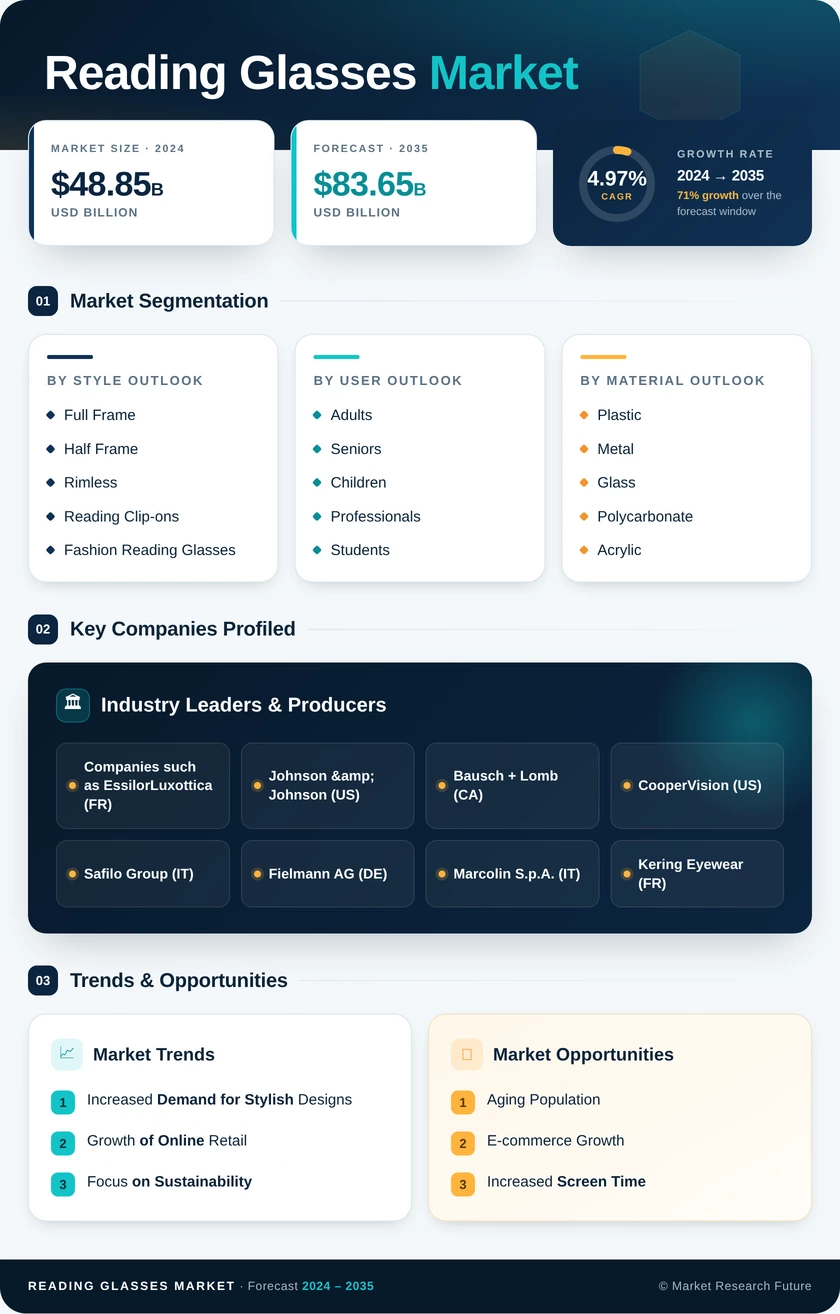
Reading Glasses Market Research Report Information By Age Group (Less Than 18 Years, 18-64 Years, and 65 Years and Greater), By Type (Prescription Reading Glasses and OTC Reading Glasses), By Distribution Channel (Retail Stores, Online Sales Channels, and Ophthalmology Clinics), and By Region (North America, Europe, Asia-Pacific, and Rest Of The World) – Market Forecast Till 2035
Reading Glasses Market
Market Size
Forecast Period2026-2035
CAGR (2026-2035)4.9%
2025 Market SizeUSD 45.62 Billion
2035 Market SizeUSD 73.61 Billion
Key Players
EssilorLuxottica
Hoya Corporation
Carl Zeiss AG
Specsavers
Fielmann Group
Safilo Group
Opportunities
  • Closing the Unmet-Need Gap in South Asia and Africa
  • Subscription and Data-Driven Business Models
  • Workplace and Occupational Vision Programs
  1. 1 Market Summary | |
    1. 1.1 Study Assumptions & Market Definition | |
    2. 1.2 Scope of the Study | |
    3. 1.3 Research Methodology | |
  2. 2 Key Report Takeaways | |
    1. 2.1 By Lens Type | |
    2. 2.2 By Power Range | |
    3. 2.3 By Frame Material | |
    4. 2.4 By Distribution Channel | |
    5. 2.5 By Region | |
  3. 3 Market Size and Forecast (2021–2035) | |
    1. 3.1 Historical Market Size (2021–2025) | |
    2. 3.2 Forecast Market Size (2026–2035) | |
    3. 3.3 Year-over-Year Growth Analysis | |
  4. 4 Driver Impact Analysis | |
    1. 4.1 Aging Population and Rising Presbyopia Prevalence | |
    2. 4.2 Earlier Near-Vision Fatigue From Screen Use | |
    3. 4.3 E-Commerce, Virtual Try-On, and Digital Power Testing | |
    4. 4.4 Public Vision Programs in Emerging Markets | |
    5. 4.5 Multi-Pair Ownership and Fashion Positioning | |
    6. 4.6 Premiumization Through Coatings and Smart Features | |
  5. 5 Restraints Impact Analysis | |
    1. 5.1 Price Commoditization and Low-Cost Imports | |
    2. 5.2 Pharmacological Presbyopia Treatments | |
    3. 5.3 Tariff Escalation and Supply Chain Costs | |
    4. 5.4 Refractive and Lens-Replacement Surgery | |
    5. 5.5 Weak Clinical Evidence for Blue-Light Claims | |
  6. 6 Opportunities | |
    1. 6.1 Closing the Unmet-Need Gap in South Asia and Africa | |
    2. 6.2 Subscription and Data-Driven Business Models | |
    3. 6.3 Workplace and Occupational Vision Programs | |
    4. 6.4 Circular and Low-Carbon Frame Design | |
    5. 6.5 Smart and Adaptive Eyewear for Older Adults | |
  7. 7 Regional Market Share and Country-Level Analysis | |
    1. 7.1 North America | | |
      1. 7.1.1 United States | | |
      2. 7.1.2 Canada | | |
      3. 7.1.3 Mexico | |
    2. 7.2 Europe | | |
      1. 7.2.1 Germany | | |
      2. 7.2.2 UK | | |
      3. 7.2.3 France | | |
      4. 7.2.4 Italy | | |
      5. 7.2.5 Spain | | |
      6. 7.2.6 Nordic Countries | | |
      7. 7.2.7 Russia | | |
      8. 7.2.8 Rest of Europe | |
    3. 7.3 Asia-Pacific | | |
      1. 7.3.1 China | | |
      2. 7.3.2 India | | |
      3. 7.3.3 Japan | | |
      4. 7.3.4 South Korea | | |
      5. 7.3.5 ASEAN | | |
      6. 7.3.6 Rest of Asia-Pacific | |
    4. 7.4 South America | | |
      1. 7.4.1 Brazil | | |
      2. 7.4.2 Argentina | | |
      3. 7.4.3 Rest of South America | |
    5. 7.5 Middle East & Africa | | |
      1. 7.5.1 Saudi Arabia | | |
      2. 7.5.2 UAE | | |
      3. 7.5.3 South Africa | | |
      4. 7.5.4 Egypt | | |
      5. 7.5.5 Rest of MEA | |
  8. 8 Future Outlook (2026–2035) | |
    1. 8.1 Smart and Connected Eyewear | |
    2. 8.2 Digital Diagnostics and Platform Retail | |
    3. 8.3 Universal Eye Health Coverage | |
    4. 8.4 Sustainability and Product Passports | |
  9. 9 Segmentation Analysis | |
    1. 9.1 By Lens Type | | |
      1. 9.1.1 Ready-Made Single-Vision Readers | | |
      2. 9.1.2 Bifocal | | |
      3. 9.1.3 Progressive / Multifocal | | |
      4. 9.1.4 Blue-Light-Blocking Readers | | |
      5. 9.1.5 Adjustable-Focus Readers | | |
      6. 9.1.6 Impact-Rated / Safety Readers | |
    2. 9.2 By Power Range | | |
      1. 9.2.1 +0.75 to +1.75 D | | |
      2. 9.2.2 +2.00 to +2.75 D | | |
      3. 9.2.3 +3.00 D and Above | |
    3. 9.3 By Frame Material | | |
      1. 9.3.1 Plastic | | |
      2. 9.3.2 Metal Alloys | | |
      3. 9.3.3 Titanium | | |
      4. 9.3.4 Bio-Based & Recycled Materials | |
    4. 9.4 By Distribution Channel | | |
      1. 9.4.1 Optical Retail Stores | | |
      2. 9.4.2 Mass-Merchandisers | | |
      3. 9.4.3 Drugstores & Pharmacies | | |
      4. 9.4.4 Online / D2C E-commerce | | |
      5. 9.4.5 Department Stores & Boutiques | | |
      6. 9.4.6 Clinics & Vision Programs | |
  10. 10 Competitive Landscape | |
    1. 10.1 Market Concentration Analysis | |
    2. 10.2 Competitive Benchmarking Matrix | |
    3. 10.3 Company Profiles | | |
      1. 10.3.1 EssilorLuxottica | | |
      2. 10.3.2 Hoya Corporation | | |
      3. 10.3.3 Carl Zeiss AG | | |
      4. 10.3.4 Specsavers | | |
      5. 10.3.5 Fielmann Group | | |
      6. 10.3.6 Safilo Group | | |
      7. 10.3.7 Zenni Optical | | |
      8. 10.3.8 Warby Parker | | |
      9. 10.3.9 Peepers | | |
      10. 10.3.10 Eyebobs | | |
      11. 10.3.11 ThinOptics | |
  11. 11 Recent News & Developments | |
  12. 12 Report Scope and Methodology | |
  13. 13 Detailed Sources and Citations | |
  14. 14 Frequently Asked Questions (FAQs) | | LIST OF TABLES | |
  15. TABLE 1 Global Market Snapshot, 2025–2035 | |
  16. TABLE 2 Global Market Size & Forecast, by Revenue (USD Billion), 2021–2035 | |
  17. TABLE 3 Driver Impact Analysis, 2026–2035 | |
  18. TABLE 4 Restraints Impact Analysis, 2026–2035 | |
  19. TABLE 5 Regional Market Summary, 2025 | |
  20. TABLE 6 North America Market, by Country, 2025 | |
  21. TABLE 7 Europe Market, by Country, 2025 | |
  22. TABLE 8 Asia-Pacific Market, by Country, 2025 | |
  23. TABLE 9 South America Market, by Country, 2025 | |
  24. TABLE 10 Middle East & Africa Market, by Country, 2025 | |
  25. TABLE 11 Global Market, by Lens Type, 2025 | |
  26. TABLE 12 Global Market, by Power Range, 2025 | |
  27. TABLE 13 Global Market, by Frame Material, 2025 | |
  28. TABLE 14 Global Market, by Distribution Channel, 2025 | |
  29. TABLE 15 Competitive Benchmarking Matrix, 2025 | |
  30. TABLE 16 Report Scope and Methodology | |
  31. TABLE 17 Detailed Sources and Citations | |
  32. TABLE 18 Segmentation Quick Reference | | LIST OF FIGURES | |
  33. FIGURE 1 Market Dynamics Overview — Drivers, Restraints, Opportunities | |
  34. FIGURE 2 Industry Value Chain Analysis | |
  35. FIGURE 3 Porter's Five Forces Analysis | |
  36. FIGURE 4 Global Market Size Trend, 2021–2035 (USD Billion) | |
  37. FIGURE 5 Market Share by Lens Type, 2025 | |
  38. FIGURE 6 Market Share by Power Range, 2025 | |
  39. FIGURE 7 Market Share by Frame Material, 2025 | |
  40. FIGURE 8 Market Share by Distribution Channel, 2025 | |
  41. FIGURE 9 Regional Market Share, 2025 | |
  42. FIGURE 10 Regional CAGR Comparison, 2026–2035 | |
  43. FIGURE 11 Competitive Landscape — Estimated Revenue Share Ranges, 2025

Segmentation Quick Reference

DimensionSub-SegmentsDominant SegmentFastest Growing Segment
By Lens TypeReady-Made Single-Vision Readers; Bifocal; Progressive / Multifocal; Blue-Light-Blocking Readers; Adjustable-Focus Readers; Impact-Rated / Safety ReadersReady-Made Single-Vision Readers (58.4% share)Blue-Light-Blocking Readers (6.6% CAGR)
By Power Range+0.75 to +1.75 D; +2.00 to +2.75 D; +3.00 D and Above+2.00 to +2.75 D (41.8% share)+0.75 to +1.75 D (6.4% CAGR)
By Frame MaterialPlastic; Metal Alloys; Titanium; Bio-Based & Recycled MaterialsPlastic (51.3% share)Bio-Based & Recycled Materials (5.0% CAGR)
By Distribution ChannelOptical Retail Stores; Mass-Merchandisers; Drugstores & Pharmacies; Online / D2C E-commerce; Department Stores & Boutiques; Clinics & Vision ProgramsOptical Retail Stores (35.7% share)Online / D2C E-commerce (7.6% CAGR)
By RegionNorth America; Europe; Asia-Pacific; South America; Middle East & AfricaNorth America (36.8% share)Asia-Pacific (6.3% CAGR)

Market Segmentation Overview

By Lens Type

Sub-SegmentKey Trend
Ready-Made Single-Vision ReadersHigh-volume drugstore and supermarket sales at low price points
BifocalSteady demand from older users needing near and distance correction.
Progressive / MultifocalGrowing comfort with variable-focus optics
Blue-Light-Blocking ReadersScreen-driven demand, tempered by evidence scrutiny
Adjustable-Focus ReadersEmerging premium niche for multi-task users
Impact-Rated / Safety ReadersWorkplace compliance in factories and hospitals

Ready-Made Single-Vision Readers lead with a 58.4% share because they require no prescription and sell off the rack at drugstores and supermarkets. Blue-Light-Blocking Readers grow fastest at a 6.6% CAGR as office and remote workers tie screen time to eye discomfort. That growth depends partly on marketing claims that clinical reviews have challenged, so suppliers are pairing filters with anti-glare coatings that deliver more tangible comfort benefits.

By Power Range

Sub-SegmentKey Trend
+0.75 to +1.75 DEarlier first purchases among screen-heavy professionals
+2.00 to +2.75 DCore presbyopic cohort buying multiple pairs
+3.00 D and AboveModest growth as surgery attracts high-income patients

The +2.00 to +2.75 D band dominates with a 41.8% share because it matches buyers in their 50s and 60s, who frequently keep several pairs. The +0.75 to +1.75 D band grows fastest at a 6.4% CAGR as near-focus fatigue appears earlier among people in their late 30s and 40s. Online webcam-based reading tests are helping these first-time buyers pick the right low power without an optician visit.

By Frame Material

Sub-SegmentKey Trend
PlasticLow cost and wide color range keep volume leadership
Metal AlloysSlim, durable frames for mid-to-premium buyers
TitaniumLightweight base for premium and electronics-enabled frames
Bio-Based & Recycled MaterialsRegulatory and consumer push toward circular design.

Plastic frames lead with a 51.3% share on low cost and styling flexibility, especially in multi-pack and drugstore assortments. Bio-Based & Recycled Materials grow fastest at a 5.0% CAGR as the EU Ecodesign regulation and eco-aware shoppers push retailers to favor recycled acetates and modular frames. Titanium sits between the two, gaining with premium buyers who want lightweight frames and with brands building electronics into the temple.

By Distribution Channel

Sub-SegmentKey Trend
Optical Retail StoresExams, insurance billing, and instant fulfillment
Mass-MerchandisersImpulse purchases amid shelf rationalization
Drugstores & PharmaciesConvenience-led, slow-growing volume
Online / D2C E-commerceVirtual try-on, easy returns, digital power tests
Department Stores & BoutiquesDesigner frames sold as lifestyle accessories
Clinics & Vision ProgramsNGO and CSR-funded access for underserved users

Optical Retail Stores lead with a 35.7% share by combining professional eye exams with insurance billing and same-day pickup. Online / D2C E-commerce grows fastest at a 7.6% CAGR, as virtual try-on and generous return policies remove the fit and power uncertainty that once kept readers in physical stores. Drugstores and mass merchandisers still move large volumes on impulse, but slower growth reflects tightening shelf space and online price competition.


Download PDF ×

We do not share your information with anyone. However, we may send you emails based on your report interest from time to time. You may contact us at any time to opt-out.