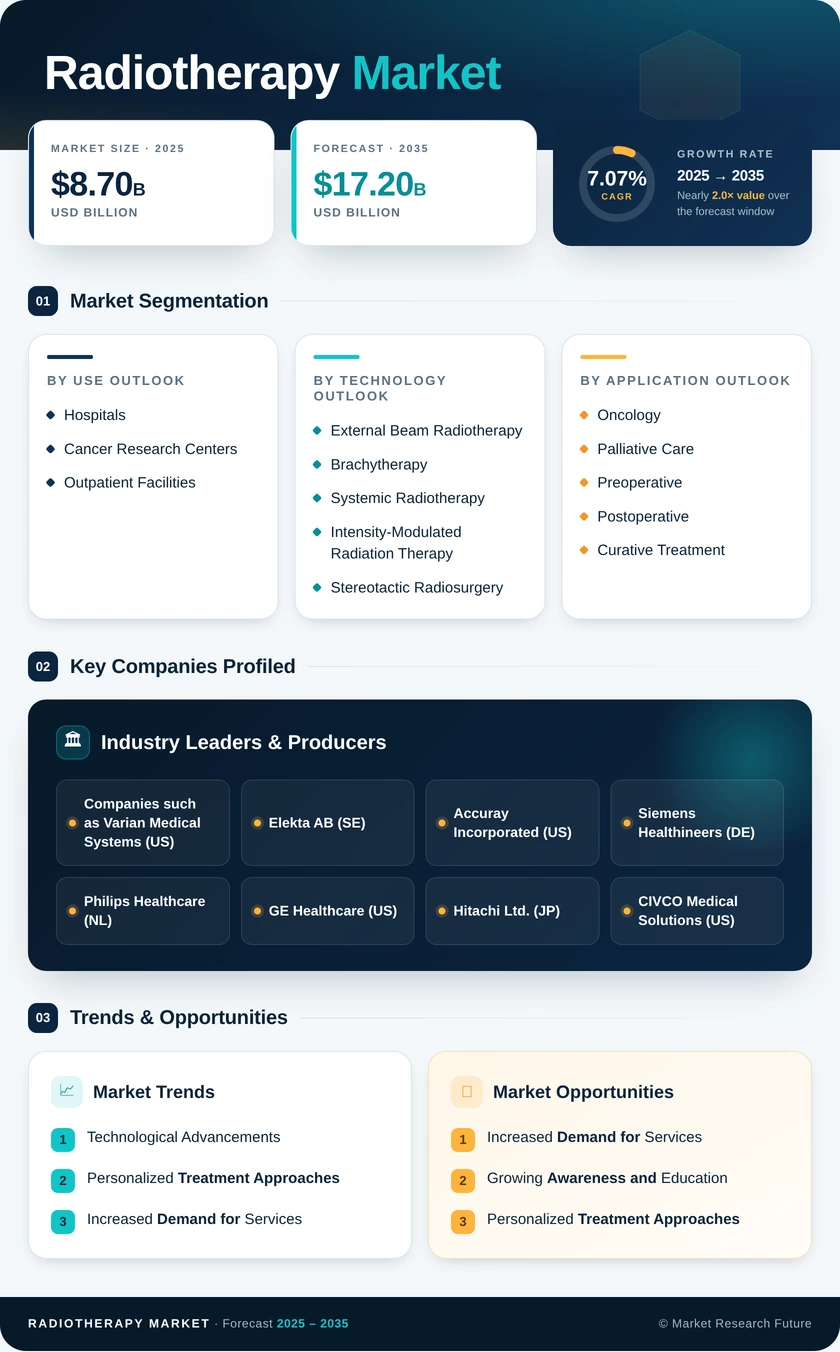
Radiotherapy Market (2026 - 2035)

ID: MRFR/HC/0997-HCR 200 Pages Nidhi Mandole Last Updated: September 15, 2026
Radiotherapy Market Research Report Size, Share, Trend Analysis By Technology (External Beam Radiotherapy, Brachytherapy, Systemic Radiotherapy, Intensity-Modulated Radiation Therapy, Stereotactic Radiosurgery), By Applications (Oncology, Palliative Care, Preoperative, Postoperative, Curative Treatment), By End Use (Hospitals, Cancer Research Centers, Outpatient Facilities), By Treatment Type (Conventional Radiotherapy, Radiotherapy for Targeted Therapy, Combination Therapy) and By Region (North America, Europe, South America, Asia Pacific, Middle East and Africa) - Growth Outlook & Industry Forecast 2025 To 2035
Radiotherapy Market
Market Size
Forecast Period2026-2035
CAGR (2026-2035)7.6%
2025 Market SizeUSD 9.09 Billion
2035 Market SizeUSD 18.91 Billion
Key Players
Siemens Healthineers
Elekta AB
Accuray Incorporated
Ion Beam Applications SA
Hitachi Ltd.
Brainlab AG
Opportunities
  • Software-Defined Capacity Expansion
  • Emerging-Market Fleet Buildout
  • Radioligand Therapy Commercialisation
  1. 1 Market Summary |
    1. 1.1 Study Assumptions & Market Definition |
    2. 1.2 Scope of the Study |
    3. 1.3 Research Methodology
  2. 2 Key Report Takeaways |
    1. 2.1 By Technology |
    2. 2.2 By Sector |
    3. 2.3 By Region
  3. 3 Market Size & Forecast (2021–2035) |
    1. 3.1 Historical Market Size (2021–2025) |
    2. 3.2 Current & Forecast Market Size (2026–2035) |
    3. 3.3 Year-over-Year Growth Analysis
  4. 4 Driver Impact Analysis |
    1. 4.1 Cancer Incidence and the Treatment-Capacity Gap |
    2. 4.2 Artificial Intelligence in Treatment Planning |
    3. 4.3 Outpatient Reimbursement and Hypofractionation |
    4. 4.4 Public Cancer Plans Across Asia-Pacific
  5. 5 Restraints Impact Analysis |
    1. 5.1 Financing Costs and Deferred Capital Projects |
    2. 5.2 Workforce Scarcity |
    3. 5.3 Isotope Supply Concentration
  6. 6 Opportunities |
    1. 6.1 Software-Defined Capacity Expansion |
    2. 6.2 Emerging-Market Fleet Buildout |
    3. 6.3 Radioligand Therapy Commercialisation |
    4. 6.4 Outcomes Data Monetisation |
    5. 6.5 Compact Particle Systems
  7. 7 Regional Market Share & Country-Level Analysis |
    1. 7.1 North America | |
      1. 7.1.1 US | |
      2. 7.1.2 Canada | |
      3. 7.1.3 Mexico |
    2. 7.2 Europe | |
      1. 7.2.1 Germany | |
      2. 7.2.2 UK | |
      3. 7.2.3 France | |
      4. 7.2.4 Italy | |
      5. 7.2.5 Spain | |
      6. 7.2.6 Nordic Countries | |
      7. 7.2.7 Russia | |
      8. 7.2.8 Rest of Europe |
    3. 7.3 Asia-Pacific | |
      1. 7.3.1 China | |
      2. 7.3.2 India | |
      3. 7.3.3 Japan | |
      4. 7.3.4 South Korea | |
      5. 7.3.5 ASEAN | |
      6. 7.3.6 Rest of Asia-Pacific |
    4. 7.4 South America | |
      1. 7.4.1 Brazil | |
      2. 7.4.2 Argentina | |
      3. 7.4.3 Rest of South America |
    5. 7.5 Middle East & Africa | |
      1. 7.5.1 Saudi Arabia | |
      2. 7.5.2 UAE | |
      3. 7.5.3 South Africa | |
      4. 7.5.4 Egypt | |
      5. 7.5.5 Rest of Middle East & Africa
  8. 8 Future Outlook (2026–2035) |
    1. 8.1 Autonomous Treatment Workflows |
    2. 8.2 Service Contracts as the Profit Engine |
    3. 8.3 Convergence with Nuclear Medicine |
    4. 8.4 Sustainability and Facility Energy Load
  9. 9 Market Segmentation Analysis |
    1. 9.1 By Product | |
      1. 9.1.1 Radiotherapy Equipment | |
      2. 9.1.2 Radiotherapy Software | |
      3. 9.1.3 Radiotherapy Services |
    2. 9.2 By Technology | |
      1. 9.2.1 Intensity-Modulated Radiotherapy (IMRT) | |
      2. 9.2.2 Image-Guided Radiotherapy (IGRT) | |
      3. 9.2.3 3D Conformal Radiotherapy | |
      4. 9.2.4 Stereotactic Technology | |
      5. 9.2.5 Proton Beam Therapy | |
      6. 9.2.6 Volumetric Modulated Arc Therapy | |
      7. 9.2.7 Other Technologies |
    3. 9.3 By Therapy Type | |
      1. 9.3.1 External Beam Radiation Therapy | |
      2. 9.3.2 Brachytherapy | |
      3. 9.3.3 Systemic Radiotherapy |
    4. 9.4 By Application | |
      1. 9.4.1 Breast Cancer | |
      2. 9.4.2 Prostate Cancer | |
      3. 9.4.3 Lung Cancer | |
      4. 9.4.4 Head & Neck Cancer | |
      5. 9.4.5 Cervical Cancer | |
      6. 9.4.6 Colorectal Cancer | |
      7. 9.4.7 Other Applications |
    5. 9.5 By End User | |
      1. 9.5.1 Hospitals and Clinics | |
      2. 9.5.2 Independent Radiotherapy Centres | |
      3. 9.5.3 Ambulatory Surgery Centres | |
      4. 9.5.4 Research Institutes
  10. 10 Competitive Landscape |
    1. 10.1 Market Concentration Analysis (2026) |
    2. 10.2 Competitive Benchmarking Matrix |
    3. 10.3 Company Profiles | |
      1. 10.3.1 Siemens Healthineers (Varian) | |
      2. 10.3.2 Elekta AB | |
      3. 10.3.3 Accuray Incorporated | |
      4. 10.3.4 Ion Beam Applications SA | |
      5. 10.3.5 Hitachi Ltd. | |
      6. 10.3.6 Novartis AG | |
      7. 10.3.7 Brainlab AG | |
      8. 10.3.8 Lantheus Holdings | |
      9. 10.3.9 Sumitomo Heavy Industries | |
      10. 10.3.10 Mevion Medical Systems | |
      11. 10.3.11 Curium Pharma
  11. 11 Recent News & Developments
  12. 12 Report Scope & Methodology |
    1. 12.1 Study Period & Base Year |
    2. 12.2 Data Sources & Citations |
    3. 12.3 Abbreviations
  13. 13 Detailed Sources & Citations
  14. 14 Frequently Asked Questions
  15. 15 LIST OF TABLES |
  16. TABLE 1 Global Radiotherapy Market Size & Forecast, by Revenue (USD Billion), 2021–2035 |
  17. TABLE 2 Global Radiotherapy Market – Year-over-Year Growth Analysis, 2021–2035 |
  18. TABLE 3 Driver Impact Analysis – Contribution to CAGR, 2026–2035 |
  19. TABLE 4 Restraint Impact Analysis – Drag on CAGR, 2026–2035 |
  20. TABLE 5 Global Radiotherapy Market Size, by Region, 2021–2035 (USD Billion) |
  21. TABLE 6 North America Radiotherapy Market Size, by Country, 2021–2035 (USD Billion) |
  22. TABLE 7 Europe Radiotherapy Market Size, by Country, 2021–2035 (USD Billion) |
  23. TABLE 8 Asia-Pacific Radiotherapy Market Size, by Country, 2021–2035 (USD Billion) |
  24. TABLE 9 South America Radiotherapy Market Size, by Country, 2021–2035 (USD Billion) |
  25. TABLE 10 Middle East & Africa Radiotherapy Market Size, by Country, 2021–2035 (USD Billion) |
  26. TABLE 11 Global Radiotherapy Market Size, by Product, 2021–2035 (USD Billion) |
  27. TABLE 12 Global Radiotherapy Market Size, by Technology, 2021–2035 (USD Billion) |
  28. TABLE 13 Global Radiotherapy Market Size, by Therapy Type, 2021–2035 (USD Billion) |
  29. TABLE 14 Global Radiotherapy Market Size, by Application, 2021–2035 (USD Billion) |
  30. TABLE 15 Global Radiotherapy Market Size, by End User, 2021–2035 (USD Billion) |
  31. TABLE 16 North America Radiotherapy Market Size, by Technology and End User, 2021–2035 (USD Billion) |
  32. TABLE 17 Europe Radiotherapy Market Size, by Technology and End User, 2021–2035 (USD Billion) |
  33. TABLE 18 Asia-Pacific Radiotherapy Market Size, by Technology and End User, 2021–2035 (USD Billion) |
  34. TABLE 19 South America Radiotherapy Market Size, by Technology and End User, 2021–2035 (USD Billion) |
  35. TABLE 20 Middle East & Africa Radiotherapy Market Size, by Technology and End User, 2021–2035 (USD Billion) |
  36. TABLE 21 Competitive Benchmarking Matrix – Global Radiotherapy Market, 2026 |
  37. TABLE 22 Company Profiles – Key Players, Global Radiotherapy Market |
  38. TABLE 23 Recent Developments & Strategic Announcements, 2023–2025 |
  39. TABLE 24 Report Scope & Methodology Summary |
  40. TABLE 25 Detailed Sources & Citations Index
  41. 16 LIST OF FIGURES |
  42. FIGURE 1 Global Radiotherapy Market – Market Dynamics Snapshot (Drivers, Restraints, Opportunities) |
  43. FIGURE 2 Industry Value Chain Analysis – Component Supply to Clinical Delivery |
  44. FIGURE 3 Porter's Five Forces Analysis – Global Radiotherapy Market |
  45. FIGURE 4 Global Market Size Trend Line, 2021–2035 (USD Billion) |
  46. FIGURE 5 Year-over-Year Growth Trajectory, 2022–2035 (%) |
  47. FIGURE 6 Market Share by Product, 2025 vs 2035 (%) |
  48. FIGURE 7 Market Share by Technology, 2025 (%) |
  49. FIGURE 8 Market Share by Therapy Type, 2025 (%) |
  50. FIGURE 9 Market Share by Application, 2025 (%) |
  51. FIGURE 10 Market Share by End User, 2025 (%) |
  52. FIGURE 11 Regional Revenue Share Distribution, 2025 (%) |
  53. FIGURE 12 Regional CAGR Comparison, 2026–2035 (%) |
  54. FIGURE 13 North America Country-Level Share Breakdown, 2025 (%) |
  55. FIGURE 14 Europe Country-Level Share Breakdown, 2025 (%) |
  56. FIGURE 15 Asia-Pacific Country-Level Share Breakdown, 2025 (%) |
  57. FIGURE 16 Competitive Landscape – Estimated Revenue Share Bands, 2026 |
  58. FIGURE 17 Competitive Positioning Matrix – Hardware vs Software Intensity |
  59. FIGURE 18 Installed Accelerator Density per Million Population, by Region

Segmentation Quick Reference

DimensionSub-SegmentsDominant SegmentFastest Growing Segment
By ProductRadiotherapy Equipment; Radiotherapy Software; Radiotherapy ServicesRadiotherapy EquipmentRadiotherapy Software
By TechnologyIntensity-Modulated Radiotherapy (IMRT); Image-Guided Radiotherapy (IGRT); 3D Conformal Radiotherapy; Stereotactic Technology; Proton Beam Therapy; Volumetric Modulated Arc Therapy; Other TechnologiesIntensity-Modulated Radiotherapy (IMRT)Proton Beam Therapy
By Therapy TypeExternal Beam Radiation Therapy; Brachytherapy; Systemic RadiotherapyExternal Beam Radiation TherapySystemic Radiotherapy
By ApplicationBreast Cancer; Prostate Cancer; Lung Cancer; Head & Neck Cancer; Cervical Cancer; Colorectal Cancer; Other ApplicationsBreast CancerLung Cancer
By End UserHospitals and Clinics; Independent Radiotherapy Centres; Ambulatory Surgery Centres; Research InstitutesHospitals and ClinicsAmbulatory Surgery Centres
By RegionNorth America; Europe; Asia-Pacific; South America; Middle East & AfricaNorth AmericaAsia-Pacific


Market Segmentation Overview

By Product

Sub-SegmentKey Trend
Radiotherapy EquipmentReplacement cycles overtake greenfield installs in mature health systems
Radiotherapy SoftwareAdaptive planning and auto-contouring shift revenue toward recurring licences
Radiotherapy ServicesMulti-year uptime contracts become the primary margin pool for suppliers


Product mix is drifting away from one-time hardware sales. Departments buy capability upgrades that extend the useful life of vaults they already own, and suppliers are restructuring commercial models to match.

By Technology

Sub-SegmentKey Trend
Intensity-Modulated Radiotherapy (IMRT)Remains default standard of care across most solid tumour protocols
Image-Guided Radiotherapy (IGRT)Daily volumetric imaging enables tighter planning margins
3D Conformal RadiotherapyRetains relevance in cost-constrained and high-volume public settings
Stereotactic TechnologyOligometastatic evidence expands curative-intent indications
Proton Beam TherapyCompact single-room designs lower the facility cost threshold
Volumetric Modulated Arc TherapyShorter delivery times improve daily patient throughput
Other TechnologiesBrachytherapy afterloaders and specialist platforms serve defined niches


Technology competition now runs through planning software as much as beam hardware. Vendors that make mixed-vendor fleets easier to manage gain influence over purchase decisions they do not directly supply.

By Therapy Type

Sub-SegmentKey Trend
External Beam Radiation TherapyHypofractionation lifts throughput per installed room
BrachytherapyGuideline-mandated boost protocols sustain steady utilisation
Systemic RadiotherapyRadioligand approvals draw pharmaceutical capital into the category


External beam retains overwhelming revenue weight, but systemic delivery is the structural story of the decade. Its growth pulls nuclear pharmacy logistics into the centre of oncology service planning.

By Application

Sub-SegmentKey Trend
Breast CancerScreening programmes and short-course regimens sustain volume leadership
Prostate CancerAging demographics combine with hypofractionated and radioligand options
Lung CancerStereotactic delivery converts inoperable cases to curative intent
Head & Neck CancerComplex anatomy sustains demand for highly modulated delivery
Cervical CancerBrachytherapy boost remains guideline standard in curative pathways
Colorectal CancerNeoadjuvant short-course protocols gain guideline traction
Other ApplicationsSarcoma, lymphoma and palliative indications diversify caseload


Indication mix determines equipment mix. Centres with heavy thoracic and cranial caseloads justify stereotactic and image-guidance investment that high-volume breast programmes alone would not.

By End User

Sub-SegmentKey Trend
Hospitals and ClinicsIntegrated pathways keep radiation adjacent to surgery and systemic therapy
Independent Radiotherapy CentresFocused operations deliver shorter wait times and higher room utilisation
Ambulatory Surgery CentresSite-neutral reimbursement removes the historic structural penalty
Research InstitutesTrial infrastructure drives early adoption of novel modalities


End-user structure is loosening as payment policy stops privileging hospital settings. Independent and ambulatory operators will absorb a growing share of routine, protocol-driven caseloads through 2035.




Download PDF ×

We do not share your information with anyone. However, we may send you emails based on your report interest from time to time. You may contact us at any time to opt-out.