ID: MRFR/HC/6432-HCR | February 2021 | Region: Global | 85 pages
Market Scenario
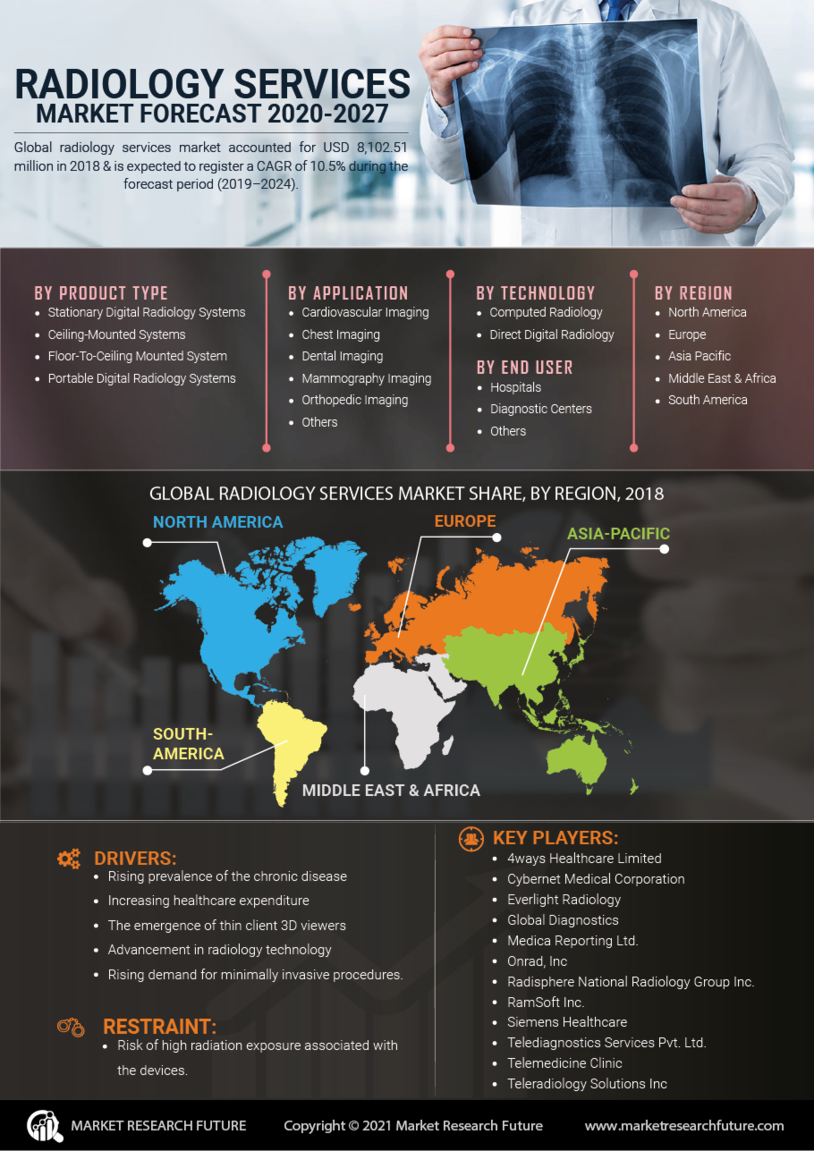
The global radiology services market accounted for USD 8,102.51 million in 2018 and is expected to register a CAGR of 10.5% during the forecast period (2019–2024).
Radiology is the technology that diagnosis and treat diseases within the human body by using medical imaging. The radiology services are served by the radiologists and experts that are qualified for performing the test and have unique postgraduate medical education in, radiation effects on the human body, radiation safety/protection, appropriate performance and interpretation of quality radiologic, and medical imaging examinations. Radiology services comprise X-Rays, computed tomography (CT), ultrasound, fusion imaging, positron emission tomography (PET), nuclear medicine, and magnetic resonance imaging (MRI). These imaging techniques should be performed after having adequate training and understanding of radiation safety and protection.
The rising prevalence of the chronic disease, increasing healthcare expenditure, the emergence of thin client 3D viewers, advancement in radiology technology, rising demand for minimally invasive procedures are expected to drive the growth of the market. Moreover, rising R&D spending and aggressive strategies adopted by the top players, such as new product launches, are contributing to the growth of the market. For instance, In June 2018, FDA has anticipated reclassifying some types of radiology image software analyzers from class III to class II devices for mammography breast cancer, ultrasound breast lesions, and radiograph lung nodules. This will help to reduce the regulatory burden on the medical device industry.
However, the risk of high radiation exposure associated with the devices may hamper the growth of the market during the assessment period.
Segmentation
The global radiology services market has been segmented on the basis of product type, application, technology, end user, and region.
On the basis of product type, the market has been classified as stationary digital radiology systems and portable digital radiology systems. Stationary digital radiology systems have been further segmented into stationary ceiling-mounted systems and floor-to-ceiling mounted system. Based on application, the market has been segmented into cardiovascular imaging, chest imaging, dental imaging, mammography imaging, orthopedic imaging, and others. The market, by technology, has been segmented into computed radiology and direct digital radiology. On the basis of end user, the market has been classified as hospitals, diagnostic centers, and others. The stationary digital radiology segment is expected to hold the largest market share of the radiology services market due to acceptance of stationary systems in hospitals, extensive application, and less exposure to radiation. However, portable digital radiology segment is showing the highest growth rate owing to simplicity in the workflow, low-cost, and proficiency performing complex computational tasks.
The market has been segmented, by region, into the Americas, Europe, Asia-Pacific, and the Middle East & Africa. The radiology services market in the Americas has further been segmented into North America and South America, with the North American market divided into the US and Canada.
The European radiology services market has been segmented into Western Europe and Eastern Europe. Western Europe has further been classified as Germany, France, the UK, Italy, Spain, and the rest of Western Europe.
The radiology services market in Asia-Pacific has been segmented into Japan, China, India, South Korea, Australia, and the rest of Asia-Pacific. The radiology services market in the Middle East & Africa has been segmented into the Middle East and Africa.
Key Players
Some of the key players in the global radiology services market are 4ways Healthcare Limited, Cybernet Medical Corporation, Everlight Radiology, Global Diagnostics, Medica Reporting Ltd., Onrad, Inc, Radisphere National Radiology Group Inc., RamSoft Inc., Siemens Healthcare, Telediagnostics Services Pvt. Ltd., Telemedicine Clinic, Teleradiology Solutions Inc, and Virtual Radiology (vRAD).
Regional Market Summary
Global Radiology Services Market Share, by Region, 2018 (%)
Source: MRFR Analysis
The Americas are likely to dominate the global radiology services market owing to the rising aging population, chronic disease, increasing funding & investments by manufacturer, and government initiative towards advance healthcare infrastructure. For instance, according to the report published by the US Department of Health & Human Services, in 2017, around 11.5% of the adult population in the US are diagnosed with heart disease, i.e., 28.2 million.
The European market is expected to be the second-largest radiology services market. The market growth in this region can be attributed to government funding and support of the healthcare sector, coupled with increasing research and development. Moreover, favorable reimbursement policies in European countries are contributing to the growth of the market in this region. For instance, the National Health Service (NHS), UK’s publicly sponsored national healthcare system, reimbursed about 40 million diagnostic imaging tests in 2016.
Asia-Pacific is expected to be the fastest-growing radiology services market during the forecast period owing to the increasing prevalence of cancer, rising investments in healthcare, and expansions by market players in the region. Also, a country such as India and China are considering the fastest growing region due to the presence of a huge patient population. Moreover, the government of these countries is open to adopting new technology and the best treatment option from a developed country. According to the International Agency for Research on Cancer, in 2018, India has a prevalence of 173.5 cancer patients per 100,000 population. Moreover, in China, the prevalence rate of cancer was 377.6 patients per 100,000 population in 2018.
The market in the Middle East & Africa is expected to account for the smallest share of the global radiology services market due to an underdeveloped healthcare sector, lack of technical knowledge, and poor medical facilities.
Global Radiology Services Market, by Product Type
Global Radiology Services Market, by Application
Global Radiology Services Market, by Technology
Global Radiology Services Market, by End User
Global Radiology Services Market, by Region
Intended Audience
Frequently Asked Questions (FAQ) :
The radiology services market is projected to grow at a 10.5% CAGR between 2019-2024.
The Americas is expected to spearhead the radiology services market.
Eminent players profiled in the radiology services market include Virtual Radiology (vRAD), Teleradiology Solutions Inc, Telemedicine Clinic, Telediagnostics Services Pvt. Ltd., Siemens Healthcare, RamSoft Inc., Radisphere National Radiology Group Inc., Onrad, Inc, Global Diagnostics, Medica Reporting Ltd., Everlight Radiology, Cybernet Medical Corporation, and 4ways Healthcare Limited.
Specific strategies adopted by industry players to create a foothold in the radiology services market include extensive research and development activities, partnerships, mergers, and expansions.
It finds extensive applications in orthopedic imaging, mammography imaging, dental imaging, chest imaging, cardiovascular imaging, and others.
Table of Contents
Chapter 1 Report Prologue
Chapter 2 Market Introduction
2.1 Definition
2.2 Scope of the Study
2.2.1 Research Objective
2.2.2 Assumptions
2.2.3 Limitations
Chapter 3 Research Methodology
3.1 Introduction
3.2 Primary Research
3.3 Secondary Research
3.4 Market Size Estimation
Chapter 4 Market Dynamics
4.1 Drivers
4.2 Restraints
4.3 Opportunities
4.4 Challenges
4.5 Macroeconomic Indicators
4.6 Detection Technique Trends & Assessment
Chapter 5 Market Factor Analysis
5.1 Porter’s Five Forces Analysis
5.1.1 Bargaining Power of Suppliers
5.1.2 Bargaining Power of Buyers
5.1.3 Threat of New Entrants
5.1.4 Threat of Substitutes
5.1.5 Intensity of Rivalry
5.2 Value Chain Analysis
5.3 Investment Feasibility Analysis
5.4 Pricing Analysis
Chapter 6 Global Radiology services Market, by Product Type
6.1 Introduction
6.2 Stationary Digital Radiology Systems
6.2.1 Ceiling-Mounted Systems
Market Estimates & Forecast, by Region, 2019–2024
Market Estimates & Forecast, by Country, 2019–2024
6.2.2 Floor-To-Ceiling Mounted System
Market Estimates & Forecast, by Region, 2019–2024
Market Estimates & Forecast, by Country, 2019–2024
6.3 Portable Digital Radiology Systems
6.3.1 Handheld Radiology Systems
Market Estimates & Forecast, by Region, 2019–2024
Market Estimates & Forecast, by Country, 2019–2024
6.3.2 Mobile Radiology Systems
Market Estimates & Forecast, by Region, 2019–2024
Market Estimates & Forecast, by Country, 2019–2024
Chapter 7 Global Radiology Services Market, by Application
7.1 Introduction
7.2 Cardiovascular Imaging
Market Estimates & Forecast, by Region, 2019–2024
Market Estimates & Forecast, by Country, 2019–2024
7.3 Chest Imaging
Market Estimates & Forecast, by Region, 2019–2024
Market Estimates & Forecast, by Country, 2019–2024
7.4 Dental Imaging
Market Estimates & Forecast, by Region, 2019–2024
Market Estimates & Forecast, by Country, 2019–2024
7.5 Mammography Imaging
Market Estimates & Forecast, by Region, 2019–2024
Market Estimates & Forecast, by Country, 2019–2024
7.6 Orthopedic Imaging
Market Estimates & Forecast, by Region, 2019–2024
Market Estimates & Forecast, by Country, 2019–2024
7.7 Others
Market Estimates & Forecast, by Region, 2019–2024
Market Estimates & Forecast, by Country, 2019–2024
Chapter 8 Global Radiology Services Market, By Technology
8.1 Introduction
8.2 Computed Radiology
Market Estimates & Forecast, by Region, 2019–2024
Market Estimates & Forecast, by Country, 2019–2024
8.3 Direct Digital Radiology
Market Estimates & Forecast, by Region, 2019–2024
Market Estimates & Forecast, by Country, 2019–2024
Chapter 9 Global Radiology Services Market, By End User
9.1 Introduction
9.2 Hospitals
Market Estimates & Forecast, by Region, 2019–2024
Market Estimates & Forecast, by Country, 2019–2024
9.3 Diagnostic Centers
Market Estimates & Forecast, by Region, 2019–2024
Market Estimates & Forecast, by Country, 2019–2024
9.4 Others
Market Estimates & Forecast, by Region, 2019–2024
Market Estimates & Forecast, by Country, 2019–2024
Chapter 10 Global Radiology Services Market, by Region
10.1 Introduction
10.2 Americas
10.2.1 North America
10.2.1.1 US
10.2.1.2 Canada
10.2.2 Latin America
10.3 Europe
10.3.1 Western Europe
10.3.1.1 Germany
10.3.1.2 France
10.3.1.3 Italy
10.3.1.4 Spain
10.3.1.5 UK
10.3.1.6 Rest of Western Europe
10.3.2 Eastern Europe
10.4 Asia-Pacific
10.4.1 Japan
10.4.2 China
10.4.3 India
10.4.4 Australia
10.4.5 South Korea
10.4.6 Rest of Asia-Pacific
10.5 Middle East & Africa
10.5.1 Middle East
10.5.2 Africa
Chapter 11 Company Landscape
11.1 Introduction
11.2 Market Share Analysis
11.3 Key Developments & Strategies
Chapter 12 Company Profiles
12.1 4ways Healthcare Limited
12.1.1 Company Overview
12.1.2 Product Overview
12.1.3 Financial Overview
12.1.4 Key Developments
12.1.5 SWOT Analysis
12.1.6 Key Strategies
12.2 Cybernet Medical Corporation
12.2.1 Company Overview
12.2.2 Product Overview
12.2.3 Financial Overview
12.2.4 Key Developments
12.2.5 SWOT Analysis
12.2.6 Key Strategies
12.3 Everlight Radiology
12.3.1 Company Overview
12.3.2 Product Overview
12.3.3 Financial Overview
12.3.4 Key Developments
12.3.5 SWOT Analysis
12.3.6 Key Strategies
12.4 Global Diagnostics
12.4.1 Company Overview
12.4.2 Product Overview
12.4.3 Financial Overview
12.4.4 Key Developments
12.4.5 SWOT Analysis
12.4.6 Key Strategies
12.5 Medica Reporting Ltd.
12.5.1 Company Overview
12.5.2 Product Overview
12.5.3 Financial Overview
12.5.4 Key Developments
12.5.5 SWOT Analysis
12.5.6 Key Strategies
12.6 Onrad, Inc
12.6.1 Company Overview
12.6.2 Product Overview
12.6.3 Financial Overview
12.6.4 Key Developments
12.6.5 SWOT Analysis
12.6.6 Key Strategies
12.7 Radisphere National Radiology Group Inc.
12.7.1 Company Overview
12.7.2 Product Overview
12.7.3 Financial Overview
12.7.4 Key Developments
12.7.5 SWOT Analysis
12.7.6 Key Strategies
12.8 RamSoft Inc.
12.8.1 Company Overview
12.8.2 Product Overview
12.8.3 Financial Overview
12.8.4 Key Developments
12.8.5 SWOT Analysis
12.8.6 Key Strategies
12.9 Siemens Healthcare
12.9.1 Company Overview
12.9.2 Product Overview
12.9.3 Financial Overview
12.9.4 Key Developments
12.9.5 SWOT Analysis
12.9.6 Key Strategies
12.10 Telediagnostics Services Pvt. Ltd.
12.10.1 Company Overview
12.10.2 Product Overview
12.10.3 Financial Overview
12.10.4 Key Developments
12.10.5 SWOT Analysis
12.10.6 Key Strategies
12.11 Telemedicine Clinic
12.11.1 Company Overview
12.11.2 Product Overview
12.11.3 Financial Overview
12.11.4 Key Developments
12.11.5 SWOT Analysis
12.11.6 Key Strategies
12.12 Teleradiology Solutions Inc
12.12.1 Company Overview
12.12.2 Product Overview
12.12.3 Financial Overview
12.12.4 Key Developments
12.12.5 SWOT Analysis
12.12.6 Key Strategies
12.13 Virtual Radiology (vRAD)
12.13.1 Company Overview
12.13.2 Product Overview
12.13.3 Financial Overview
12.13.4 Key Developments
12.13.5 SWOT Analysis
12.13.6 Key Strategies
12.14 Others
Chapter 13 MRFR Conclusion
13.1 Key Findings
13.1.1 From CEO’s Viewpoint
13.1.2 Unmet Needs of the Market
13.2 Key Companies to Watch
13.3 Predictions for the Radiology Services Industry
Chapter 14 Appendix
LIST OF TABLES
Table 1 Global Radiology Services Market Synopsis, 2019–2024
Table 2 Global Radiology Services Market Estimates and Forecast, 2019–2024 (USD Million)
Table 3 Global Radiology Services Market, by Region, 2019–2024 (USD Million)
Table 4 Global Radiology Services Market, by Product Type, 2019–2024 (USD Million)
Table 5 Global Radiology Services Market, by Application, 2019–2024 (USD Million)
Table 6 Global Radiology Services Market, By Technology, 2019–2024 (USD Million)
Table 7 Global Radiology Services Market, By End User, 2019–2024 (USD Million)
Table 8 North America: Radiology Services Market, by Product Type, 2019–2024 (USD Million)
Table 9 North America: Radiology Services Market, by Application, 2019–2024 (USD Million)
Table 10 North America: Radiology Services Market, By Technology, 2019–2024 (USD Million)
Table 11 North America: Radiology Services Market, By End User, 2019–2024 (USD Million)
Table 12 US: Radiology Services Market, by Product Type, 2019–2024 (USD Million)
Table 13 US: Radiology Services Market, by Application, 2019–2024 (USD Million)
Table 14 US: Radiology Services Market, By Technology, 2019–2024 (USD Million)
Table 15 US: Radiology Services Market, By End User, 2019–2024 (USD Million)
Table 16 Canada: Radiology Services Market, by Product Type, 2019–2024 (USD Million)
Table 17 Canada: Radiology Services Market, by Application, 2019–2024 (USD Million)
Table 18 Canada: Radiology Services Market, By Technology, 2019–2024 (USD Million)
Table 19 Canada: Radiology Services Market, By End User, 2019–2024 (USD Million)
Table 20 Latin America: Radiology Services Market, by Product Type, 2019–2024 (USD Million)
Table 21 Latin America: Radiology Services Market, by Application, 2019–2024 (USD Million)
Table 22 Latin America: Radiology Services Market, By Technology, 2019–2024 (USD Million)
Table 23 Latin America: Radiology Services Market, By End User, 2019–2024 (USD Million)
Table 24 Europe: Radiology Services Market, by Product Type, 2019–2024 (USD Million)
Table 25 Europe: Radiology Services Market, by Application, 2019–2024 (USD Million)
Table 26 Europe: Radiology Services Market, By Technology, 2019–2024 (USD Million)
Table 27 Europe: Radiology Services Market, By End User, 2019–2024 (USD Million)
Table 28 Western Europe: Radiology Services Market, by Product Type, 2019–2024 (USD Million)
Table 29 Western Europe: Radiology Services Market, by Application, 2019–2024 (USD Million)
Table 30 Western Europe: Radiology Services Market, By Technology, 2019–2024 (USD Million)
Table 31 Western Europe: Radiology Services Market, By End User, 2019–2024 (USD Million)
Table 32 Eastern Europe: Radiology Services Market, by Product Type, 2019–2024 (USD Million)
Table 33 Eastern Europe: Radiology Services Market, by Application, 2019–2024 (USD Million)
Table 34 Eastern Europe: Radiology Services Market, By Technology, 2019–2024 (USD Million)
Table 35 Eastern Europe: Radiology Services Market, By End User, 2019–2024 (USD Million)
Table 36 Asia-Pacific: Radiology Services Market, by Product Type, 2019–2024 (USD Million)
Table 37 Asia-Pacific: Radiology Services Market, by Application, 2019–2024 (USD Million)
Table 38 Asia-Pacific: Radiology Services Market, By Technology, 2019–2024 (USD Million)
Table 39 Asia-Pacific: Radiology Services Market, By End User, 2019–2024 (USD Million)
Table 40 Middle East & Africa: Radiology Services Market, by Product Type, 2019–2024 (USD Million)
Table 41 Middle East & Africa: Radiology Services Market, by Application, 2019–2024 (USD Million)
Table 42 Middle East & Africa: Radiology Services Market, By Technology, 2019–2024 (USD Million)
Table 43 Middle East & Africa: Radiology Services Market, By End User, 2019–2024 (USD Million)
LIST OF FIGURES
Figure 1 Research Process
Figure 2 Segmentation for Global Radiology Services Market
Figure 3 Segmentation Market Dynamics for Global Radiology Services Market
Figure 4 Global Radiology Services Market Share, by Product Type, 2018
Figure 5 Global Radiology Services Market Share, by Application, 2018
Figure 6 Global Radiology Services Market Share, By Technology, 2018
Figure 7 Global Radiology Services Market Share, By End User, 2018
Figure 8 Global Radiology Services Market Share, by Region, 2018
Figure 9 North America: Radiology Services Market Share, by Country, 2018
Figure 10 Europe: Radiology Services Market Share, by Country, 2018
Figure 11 Asia-Pacific: Radiology Services Market Share, by Country, 2018
Figure 12 Middle East & Africa: Radiology Services Market Share, by Country, 2018
Figure 13 Global Radiology Services Market: Company Share Analysis, 2018 (%)
Figure 14 4ways Healthcare Limited: Key Financials
Figure 15 4ways Healthcare Limited: Segmental Revenue
Figure 16 4ways Healthcare Limited: Geographical Revenue
Figure 17 Cybernet Medical Corporation: Key Financials
Figure 18 Cybernet Medical Corporation: Segmental Revenue
Figure 19 Cybernet Medical Corporation: Geographical Revenue
Figure 20 Everlight Radiology: Key Financials
Figure 21 Everlight Radiology: Segmental Revenue
Figure 22 Everlight Radiology: Geographical Revenue
Figure 23 Global Diagnostics: Key Financials
Figure 24 Global Diagnostics: Segmental Revenue
Figure 25 Global Diagnostics: Geographical Revenue
Figure 26 Medica Reporting Ltd.: Key Financials
Figure 27 Medica Reporting Ltd.: Segmental Revenue
Figure 28 Medica Reporting Ltd.: Geographical Revenue
Figure 29 Onrad, Inc: Key Financials
Figure 30 Onrad, Inc: Segmental Revenue
Figure 31 Onrad, Inc: Geographical Revenue
Figure 32 Radisphere National Radiology Group Inc.: Key Financials
Figure 33 Radisphere National Radiology Group Inc.: Segmental Revenue
Figure 34 Radisphere National Radiology Group Inc.: Geographical Revenue
Figure 35 RamSoft Inc.: Key Financials
Figure 36 RamSoft Inc.: Segmental Revenue
Figure 37 RamSoft Inc.: Geographical Revenue
Figure 38 Siemens Healthcare: Key Financials
Figure 39 Siemens Healthcare: Segmental Revenue
Figure 40 Siemens Healthcare: Geographical Revenue
Figure 41 Telediagnostics Services Pvt. Ltd.: Key Financials
Figure 42 Telediagnostics Services Pvt. Ltd.: Segmental Revenue
Figure 43 Telediagnostics Services Pvt. Ltd.: Geographical Revenue
Figure 44 Telemedicine Clinic: Key Financials
Figure 45 Telemedicine Clinic: Segmental Revenue
Figure 46 Telemedicine Clinic: Geographical Revenue
Figure 47 Teleradiology Solutions Inc: Key Financials
Figure 48 Teleradiology Solutions Inc: Segmental Revenue
Figure 49 Teleradiology Solutions Inc: Geographical Revenue
Figure 50 Virtual Radiology (vRAD): Key Financials
Figure 51 Virtual Radiology (vRAD): Segmental Revenue
Figure 52 Virtual Radiology (vRAD): Geographical Revenue
This table of content is tentative and subject to change as the research progresses.
Please Note: Financial details of company cannot be provided if the information of the company is not available in public domain and or reliable source.