Segmentation Quick Reference
| Dimension | Sub-Segments | Dominant Segment | Fastest Growing Segment |
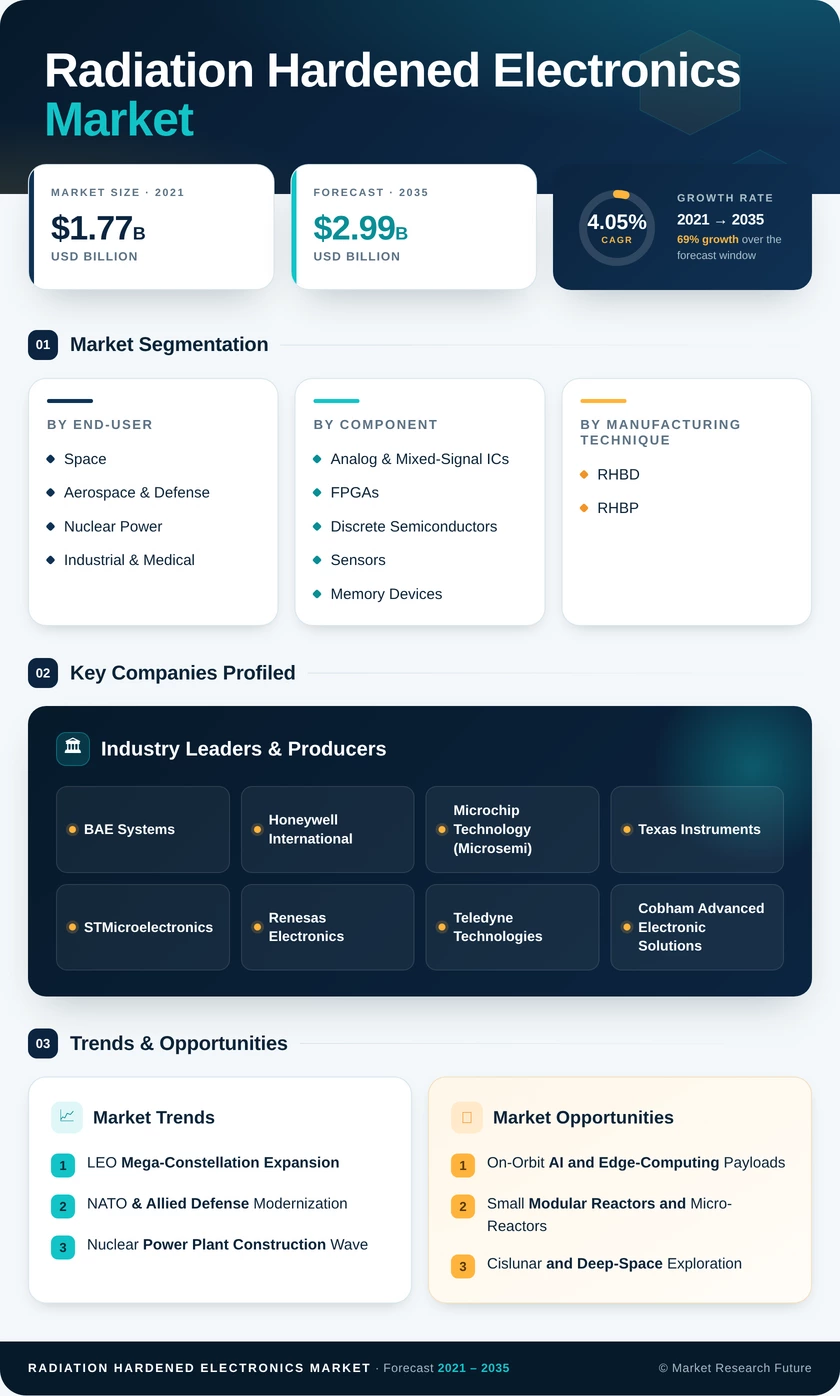
| End-User | Space; Aerospace & Defense; Nuclear Power; Industrial & Medical | Space (49.6% share, 2025) | Aerospace & Defense (4.41% CAGR) |
| Component | Analog & Mixed-Signal ICs; FPGAs; Discrete Semiconductors; Sensors; Memory Devices | Analog & Mixed-Signal ICs (37.8% share, 2025) | FPGAs (4.75% CAGR) |
| Manufacturing Technique | RHBD; RHBP | RHBD (56.1% share, 2025) | RHBD (4.43% CAGR) |
| Semiconductor Material | Silicon; SiC; GaN | Silicon (68.8% share, 2025) | GaN (4.85% CAGR) |
| Radiation Type | TID; SEE; Displacement Damage | TID (51.7% share, 2025) | SEE (5.52% CAGR) |
| Geography | North America; Europe; Asia-Pacific; South America; MEA | North America (44.6% share, 2025) | Asia-Pacific (5.37% CAGR) |
Market Segmentation Overview
By End-User
| Sub-Segment | Key Trend |
| Space | LEO mega-constellation demand is sustaining 200+ launches per year globally |
| Aerospace & Defense | NATO modernization cycles are refreshing avionics and missile guidance electronics |
| Nuclear Power | 60+ reactor units under construction across Asia and the Middle East |
| Industrial & Medical | Proton therapy and particle accelerator instrumentation are driving niche uptake. |
Space end users account for the largest share of the Radiation Hardened Electronics Market, underpinned by commercial constellation build-outs and government reconnaissance programs that require qualified radiation-tolerant components across every satellite subsystem.
By Component
| Sub-Segment | Key Trend |
| Analog & Mixed-Signal ICs | Ubiquitous need for hardened power management and data conversion |
| FPGAs | Reprogrammable on-orbit computing replacing fixed-function ASICs |
| Discrete Semiconductors | Power switching and voltage regulation across all platforms |
| Sensors | Star trackers, dosimeters, and imaging arrays for space payloads |
| Memory Devices | Non-volatile flight-software storage with error-correcting codes |
Analog and mixed-signal ICs dominate component demand because every satellite bus and reactor system requires hardened voltage regulators and signal-conditioning front ends. FPGAs are the fastest-growing line as rad-hard space electronics designers adopt reconfigurable logic for on-orbit updates.
By Manufacturing Technique
| Sub-Segment | Key Trend |
| Radiation-Hard-by-Design (RHBD) | Migration to 65 nm and 45 nm commercial nodes with circuit-level hardening |
| Radiation-Hard-by-Process (RHBP) | Heritage 150 nm nodes are maintained for legacy platform sustainment |
RHBD solutions are expanding share as designers capitalize on smaller commercial geometries, cutting die area and power consumption while maintaining radiation tolerance above 100 krad for space-grade hardened ICs.
By Semiconductor Material
| Sub-Segment | Key Trend |
| Silicon | Dominant mature ecosystem; broadest qualified-parts catalog |
| Silicon Carbide (SiC) | High-temperature operation for reactor-adjacent instrumentation |
| Gallium Nitride (GaN) | High-power RF and electric-propulsion driver applications |
Silicon's extensive qualification history ensures its continued dominance, while GaN is gaining rapid traction in nuclear-resistant electronics applications demanding higher power density and efficiency.
By Radiation Type
| Sub-Segment | Key Trend |
| Total Ionizing Dose (TID) | Protection against cumulative ionizing exposure in GEO and nuclear environments |
| Single-Event Effects (SEE) | Mitigation of heavy-ion and proton-induced transients in advanced nodes |
| Displacement Damage | Neutron-flux hardening for reactor containment electronics |
TID protection remains the largest category, but SEE mitigation is accelerating as transistor scaling below 65 nm increases vulnerability to single-particle upsets in radiation shielded circuits.