Segmentation Quick Reference
| Dimension | Sub-Segments | Dominant Segment | Fastest Growing Segment |
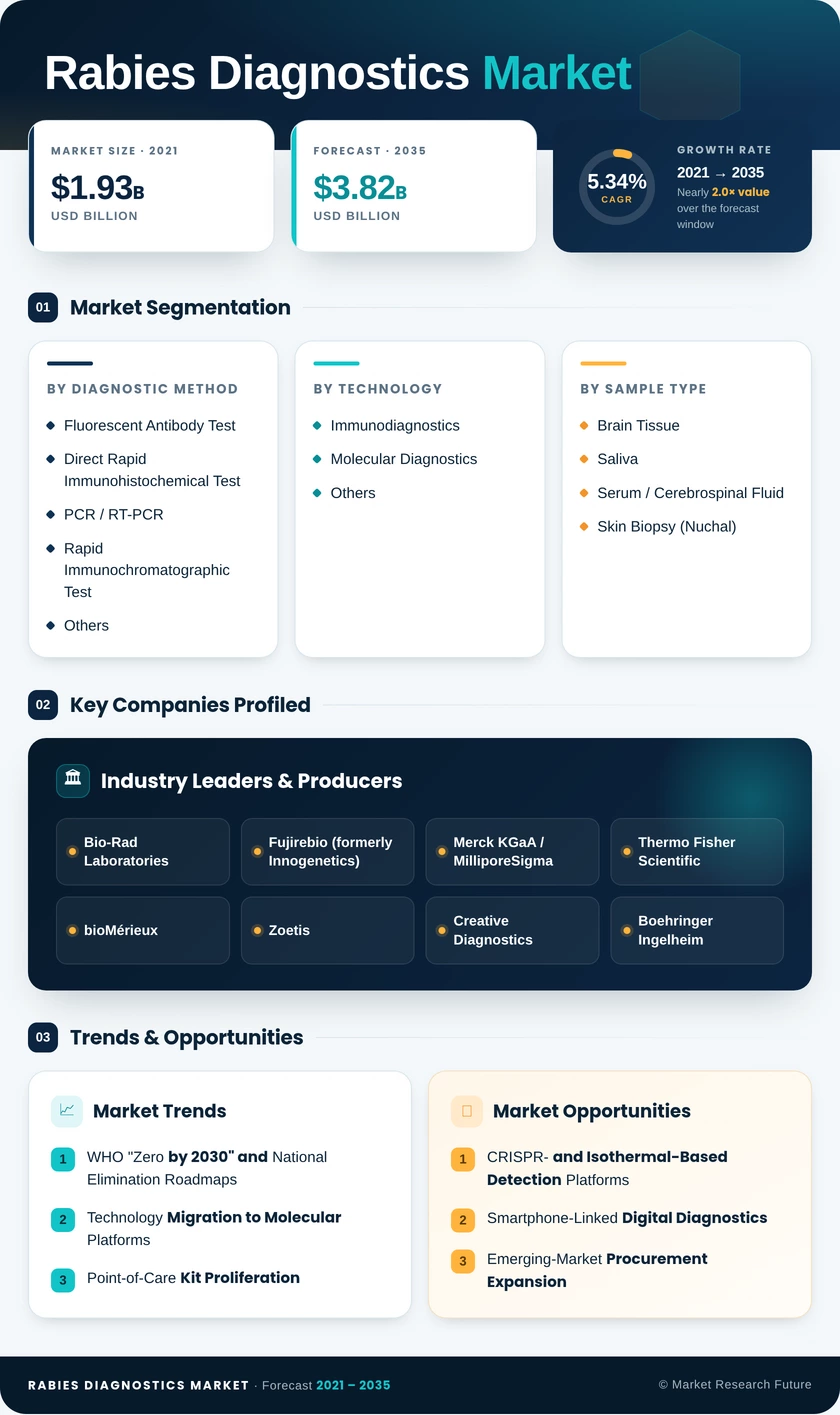
| By Diagnostic Method | Fluorescent Antibody Test, Direct Rapid Immunohistochemical Test, PCR / RT-PCR, Rapid Immunochromatographic Test, Others | Fluorescent Antibody Test (44.1% share, 2024) | PCR / RT-PCR (8.89% CAGR) |
| By Rabies Diagnostics Market | Immunodiagnostics, Molecular Diagnostics, Others | Immunodiagnostics (57.2% share, 2024) | Molecular Diagnostics (9.37% CAGR) |
| By Sample Type | Brain Tissue, Saliva, Serum / Cerebrospinal Fluid, Skin Biopsy (Nuchal) | Brain Tissue (50.0% share, 2024) | Saliva (6.88% CAGR) |
| By End User | Reference Laboratories, Point-of-Care / Veterinary Clinics, Research & Academic Institutions, Public Health Agencies | Reference Laboratories (47.4% share, 2024) | Point-of-Care / Veterinary Clinics (7.83% CAGR) |
| By Region | North America, Europe, Asia-Pacific, South America, Middle East & Africa | North America (35.7% share, 2024) | Asia-Pacific (6.67% CAGR) |
Market Segmentation Overview
By Diagnostic Method
| Sub-Segment | Key Trend |
| Fluorescent Antibody Test (FAT) | Remains the regulatory gold standard; gradual share erosion to molecular alternatives |
| Direct Rapid Immunohistochemical Test (DRIT) | Growing adoption as a lower-cost alternative to FAT in resource-limited labs |
| PCR / RT-PCR | Fastest-growing method driven by superior sensitivity and viral genotyping capability |
| Rapid Immunochromatographic Test (RICT) | Expanding rapidly in the field and veterinary clinic settings due to cold-chain independence |
| Others (ELISA, Cell Culture, DBIA) | Niche use for vaccination verification, serology and archival research |
The diagnostic method landscape is bifurcating between high-complexity reference-lab assays and simplified rapid tests designed for decentralized settings. Manufacturers that bridge both tiers through integrated platform strategies will capture the widest share of procurement budgets over the forecast period.
By Rabies Diagnostics Market
| Sub-Segment | Key Trend |
| Immunodiagnostics | Dominant technology encompassing FAT, ELISA, and lateral-flow immunoassays |
| Molecular Diagnostics | Rapid uptake of RT-PCR and emerging isothermal/CRISPR-based platforms |
| Others (Cell Culture, Histopathology) | Limited to specialized research and archival tissue analysis |
Immunodiagnostic platforms benefit from an extensive installed base, but molecular diagnostics are attracting the largest share of new capital investment as laboratories seek multiplexing and genotyping capabilities.
By Sample Type
| Sub-Segment | Key Trend |
| Brain Tissue | Post-mortem confirmatory standard; stable volume driven by regulatory mandates |
| Saliva | Non-invasive ante-mortem collection is gaining clinical and regulatory traction. |
| Serum / Cerebrospinal Fluid | Antibody titer verification for pre- and post-exposure prophylaxis monitoring |
| Skin Biopsy (Nuchal) | Emerging ante-mortem technique validated by CDC and WHO-affiliated laboratories |
The long-term trajectory favors ante-mortem specimen types as clinical protocols evolve, and One-Health surveillance models emphasize living-animal sampling to preserve epidemiological data quality.
By End User
| Sub-Segment | Key Trend |
| Reference Laboratories | Centralized confirmatory hub; investing in automation and molecular upgrades |
| Point-of-Care / Veterinary Clinics | Fastest-growing channel driven by rapid-test availability and regulatory acceptance |
| Research & Academic Institutions | Focus on variant surveillance, vaccine efficacy studies, and novel assay development |
| Public Health Agencies | Field investigation kits and mobile laboratory deployments for outbreak response |
Decentralization is the defining theme: as rapid tests achieve regulatory acceptance for preliminary screening, test volumes are shifting from centralized reference laboratories to distributed veterinary and clinical settings closer to the point of exposure.