Quick Service Restaurants (QSR) Market Segmentation
Quick Service Restaurants (QSR) Market By Service Type (USD Billion, 2025-2035)
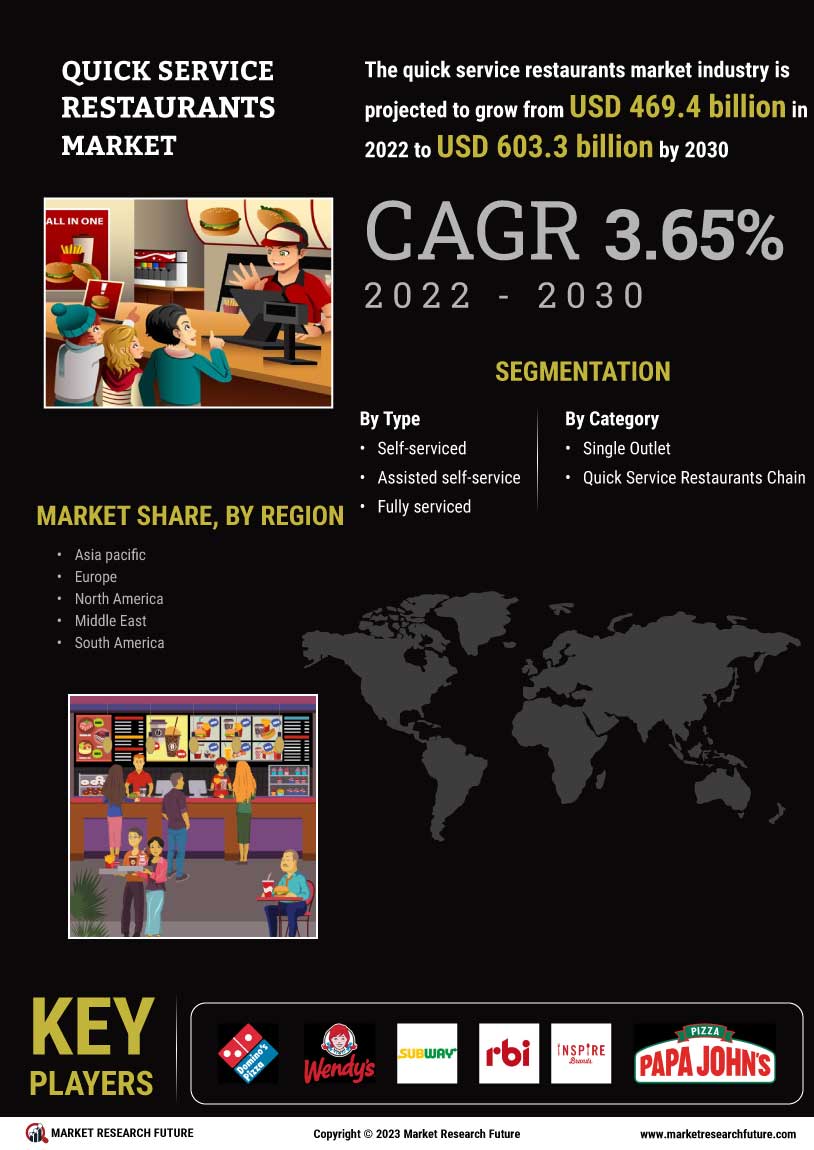
- Self-serviced
- Assisted self-serviced
- Fully serviced
Quick Service Restaurants (QSR) Market By Category (USD Billion, 2025-2035)
- Single Outlet
- Quick Service Restaurants Chain