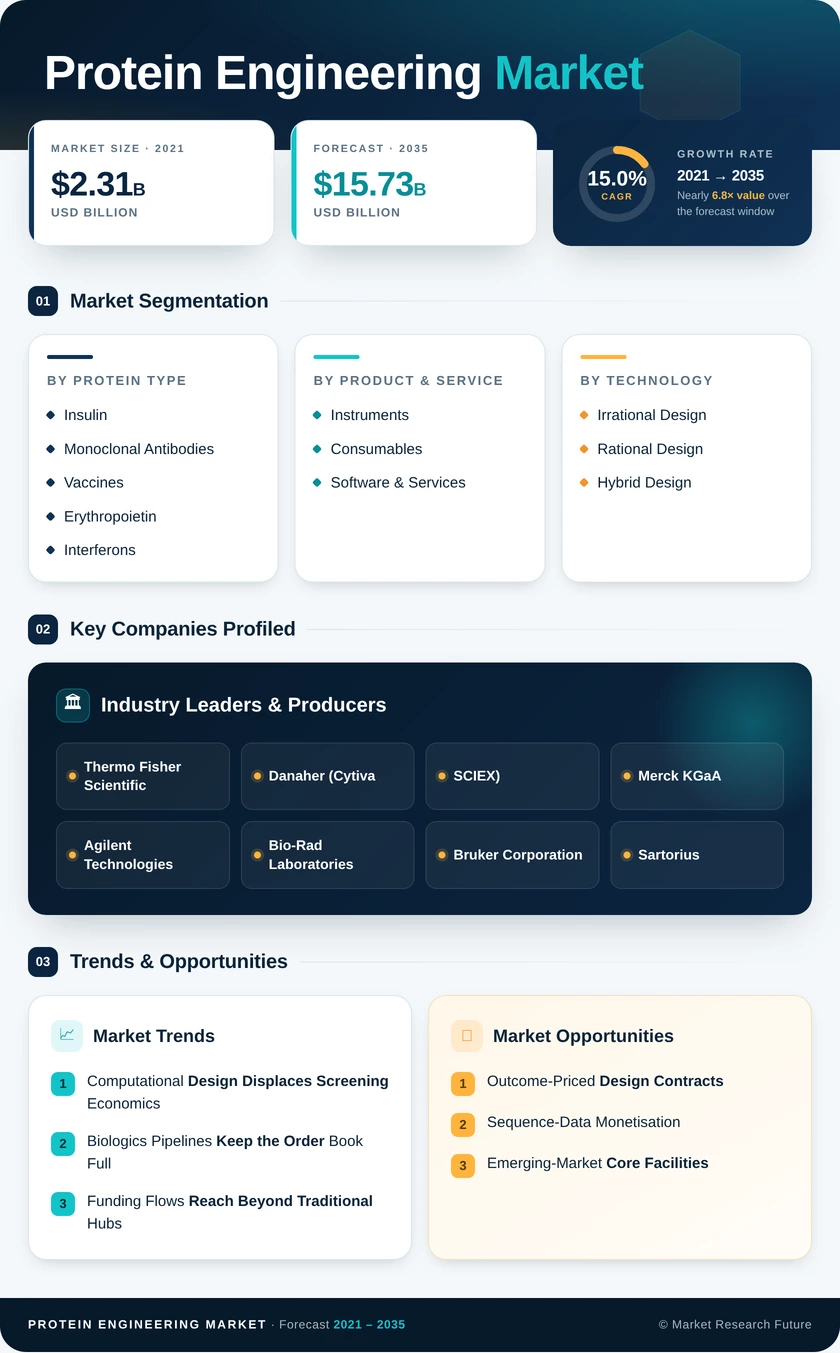
Protein Engineering Market (2026 - 2035)

The global Protein Engineering Market is anticipated to reach USD 6,484.03 Million by 2035, growing at a CAGR of 11.8%, driven by increasing demand for tailored biologics and rising biopharmaceutical R&D activities, along with rapid advancements in computational protein design, CRISPR, and directed evolution technologies.

Forecast Period
2026-2035
CAGR
15.0%
2025 Market Size
USD 3.84 Billion
2035 Market Size
USD 15.73 Billion
Healthcare ● Updated August 2026 Report ID: MRFR/HC/0220-CR | Pages: 132 | Author: Rahul Gotadki, Kinjoll Dey
  1. 1 Market Summary |
    1. 1.1 Study Assumptions & Market Definition |
    2. 1.2 Scope of the Study |
    3. 1.3 Research Methodology
  2. 2 Key Report Takeaways |
    1. 2.1 By Technology |
    2. 2.2 By Sector |
    3. 2.3 By Region
  3. 3 Market Size & Forecast (2021–2035) |
    1. 3.1 Historical Market Size (2021–2025) |
    2. 3.2 Current & Forecast Market Size (2026–2035) |
    3. 3.3 Year-over-Year Growth Analysis
  4. 4 Driver Impact Analysis |
    1. 4.1 Computational Design Displaces Screening Economics |
    2. 4.2 Biologics Pipelines Keep the Order Book Full |
    3. 4.3 Funding Flows Reach Beyond Traditional Hubs
  5. 5 Restraints Impact Analysis |
    1. 5.1 Equipment Budgets Have Not Kept Pace |
    2. 5.2 The Talent Bottleneck Is Structural |
    3. 5.3 Regulators Are Still Drafting the Rulebook
  6. 6 Opportunities |
    1. 6.1 Outcome-Priced Design Contracts |
    2. 6.2 Sequence-Data Monetisation |
    3. 6.3 Emerging-Market Core Facilities |
    4. 6.4 Industrial Enzymes for Decarbonisation |
    5. 6.5 Vaccine Platform Reuse
  7. 7 Regional Market Share & Country-Level Analysis |
    1. 7.1 North America | |
      1. 7.1.1 US | |
      2. 7.1.2 Canada | |
      3. 7.1.3 Mexico |
    2. 7.2 Europe | |
      1. 7.2.1 Germany | |
      2. 7.2.2 UK | |
      3. 7.2.3 France | |
      4. 7.2.4 Italy | |
      5. 7.2.5 Spain | |
      6. 7.2.6 Nordic Countries | |
      7. 7.2.7 Russia | |
      8. 7.2.8 Rest of Europe |
    3. 7.3 Asia-Pacific | |
      1. 7.3.1 China | |
      2. 7.3.2 India | |
      3. 7.3.3 Japan | |
      4. 7.3.4 South Korea | |
      5. 7.3.5 ASEAN | |
      6. 7.3.6 Rest of Asia-Pacific |
    4. 7.4 South America | |
      1. 7.4.1 Brazil | |
      2. 7.4.2 Argentina | |
      3. 7.4.3 Rest of South America |
    5. 7.5 Middle East & Africa | |
      1. 7.5.1 Saudi Arabia | |
      2. 7.5.2 UAE | |
      3. 7.5.3 South Africa | |
      4. 7.5.4 Egypt | |
      5. 7.5.5 Rest of Middle East & Africa
  8. 8 Future Outlook (2026–2035) |
    1. 8.1 Closed-Loop Autonomous Laboratories |
    2. 8.2 Platform Economics Reshape Margins |
    3. 8.3 Regulatory Convergence on AI Evidence |
    4. 8.4 Sustainability Pressure on Bioprocessing
  9. 9 Market Segmentation Analysis |
    1. 9.1 By Protein Type | |
      1. 9.1.1 Insulin | |
      2. 9.1.2 Monoclonal Antibodies | |
      3. 9.1.3 Vaccines | |
      4. 9.1.4 Erythropoietin | |
      5. 9.1.5 Interferons | |
      6. 9.1.6 Colony Stimulating Factors | |
      7. 9.1.7 Growth Hormones | |
      8. 9.1.8 Insulin | |
      9. 9.1.9 Others |
    2. 9.2 By Product & Service | |
      1. 9.2.1 Instruments | |
      2. 9.2.2 Consumables | |
      3. 9.2.3 Software & Services |
    3. 9.3 By Technology | |
      1. 9.3.1 Irrational Design | |
      2. 9.3.2 Rational Design | |
      3. 9.3.3 Hybrid Design |
    4. 9.4 By End User | |
      1. 9.4.1 Pharmaceutical and Biotechnology Companies | |
      2. 9.4.2 Academic & Research Institutes | |
      3. 9.4.3 Contract Research Organizations | |
      4. 9.4.4 Others
  10. 10 Competitive Landscape |
    1. 10.1 Market Concentration Analysis (2026) |
    2. 10.2 Competitive Benchmarking Matrix |
    3. 10.3 Company Profiles | |
      1. 10.3.1 Thermo Fisher Scientific | |
      2. 10.3.2 Danaher Corporation | |
      3. 10.3.3 Merck KGaA | |
      4. 10.3.4 Agilent Technologies | |
      5. 10.3.5 Bio-Rad Laboratories | |
      6. 10.3.6 Bruker Corporation | |
      7. 10.3.7 Sartorius | |
      8. 10.3.8 GenScript Biotech | |
      9. 10.3.9 Revvity | |
      10. 10.3.10 Twist Bioscience | |
      11. 10.3.11 Codexis
  11. 11 Recent News & Developments
  12. 12 Report Scope & Methodology
  13. 13 Detailed Sources & Citations
  14. 14 Frequently Asked Questions (FAQs)
  15. 15 LIST OF TABLES |
  16. TABLE 1 Global Protein Engineering Market Size & Forecast, by Revenue (USD Billion), 2021–2035 |
  17. TABLE 2 Global Protein Engineering Market – Year-over-Year Growth Analysis, 2021–2035 |
  18. TABLE 3 Driver Impact Analysis – Contribution to CAGR, 2026–2035 |
  19. TABLE 4 Restraint Impact Analysis – Drag on CAGR, 2026–2035 |
  20. TABLE 5 Global Protein Engineering Market Size, by Region, 2021–2035 (USD Billion) |
  21. TABLE 6 North America Protein Engineering Market Size, by Country, 2021–2035 (USD Billion) |
  22. TABLE 7 Europe Protein Engineering Market Size, by Country, 2021–2035 (USD Billion) |
  23. TABLE 8 Asia-Pacific Protein Engineering Market Size, by Country, 2021–2035 (USD Billion) |
  24. TABLE 9 South America Protein Engineering Market Size, by Country, 2021–2035 (USD Billion) |
  25. TABLE 10 Middle East & Africa Protein Engineering Market Size, by Country, 2021–2035 (USD Billion) |
  26. TABLE 11 Global Protein Engineering Market Size, by Protein Type, 2021–2035 (USD Billion) |
  27. TABLE 12 Global Protein Engineering Market Size, by Product & Service, 2021–2035 (USD Billion) |
  28. TABLE 13 Global Protein Engineering Market Size, by Technology, 2021–2035 (USD Billion) |
  29. TABLE 14 Global Protein Engineering Market Size, by End User, 2021–2035 (USD Billion) |
  30. TABLE 15 Competitive Benchmarking Matrix – Global Protein Engineering Market, 2026 |
  31. TABLE 16 Company Profiles – Key Players, Global Protein Engineering Market |
  32. TABLE 17 Recent Developments & Strategic Announcements, 2023–2025 |
  33. TABLE 18 Report Scope & Methodology Summary |
  34. TABLE 19 Detailed Sources & Citations Index |
  35. TABLE 20 North America Protein Engineering Market Size, by Protein Type, 2021–2035 (USD Billion) |
  36. TABLE 21 North America Protein Engineering Market Size, by Product & Service, 2021–2035 (USD Billion) |
  37. TABLE 22 Europe Protein Engineering Market Size, by Technology, 2021–2035 (USD Billion) |
  38. TABLE 23 Asia-Pacific Protein Engineering Market Size, by End User, 2021–2035 (USD Billion) |
  39. TABLE 24 South America Protein Engineering Market Size, by Protein Type, 2021–2035 (USD Billion) |
  40. TABLE 25 Middle East & Africa Protein Engineering Market Size, by Product & Service, 2021–2035 (USD Billion)
  41. 16 LIST OF FIGURES |
  42. FIGURE 1 Global Protein Engineering Market – Market Dynamics Snapshot (Drivers, Restraints, Opportunities) |
  43. FIGURE 2 Industry Value Chain Analysis – Protein Engineering |
  44. FIGURE 3 Porter's Five Forces Analysis – Protein Engineering |
  45. FIGURE 4 Global Market Size Trend Line, 2021–2035 (USD Billion) |
  46. FIGURE 5 Year-over-Year Growth Curve, 2022–2035 (%) |
  47. FIGURE 6 Market Share by Protein Type, 2025 vs 2035 (%) |
  48. FIGURE 7 Market Share by Product & Service, 2025 vs 2035 (%) |
  49. FIGURE 8 Market Share by Technology, 2025 vs 2035 (%) |
  50. FIGURE 9 Market Share by End User, 2025 vs 2035 (%) |
  51. FIGURE 10 Regional Revenue Share Distribution, 2025 (%) |
  52. FIGURE 11 Regional CAGR Comparison, 2026–2035 (%) |
  53. FIGURE 12 North America Country-Level Revenue Split, 2025 (%) |
  54. FIGURE 13 Europe Country-Level Revenue Split, 2025 (%) |
  55. FIGURE 14 Asia-Pacific Country-Level Revenue Split, 2025 (%) |
  56. FIGURE 15 Competitive Landscape – Estimated Revenue Share Bands, 2026 |
  57. FIGURE 16 Competitive Positioning Matrix – Capability Breadth vs Platform Depth |
  58. FIGURE 17 Driver Contribution Waterfall to Headline CAGR |
  59. FIGURE 18 Technology Adoption S-Curve – Rational, Irrational, and Hybrid Design
Share::
Request Free Sample

Segmentation Quick Reference

DimensionSub-SegmentsDominant SegmentFastest Growing Segment
By Protein TypeInsulin, Monoclonal Antibodies, Vaccines, Erythropoietin, Interferons, Colony Stimulating Factors, Growth Hormones, OthersMonoclonal AntibodiesVaccines
By Product & ServiceInstruments, Consumables, Software & ServicesConsumablesSoftware & Services
By TechnologyIrrational Design, Rational Design, Hybrid DesignRational DesignHybrid Design
By End UserPharmaceutical and Biotechnology Companies, Academic & Research Institutes, Contract Research Organizations, OthersPharmaceutical and Biotechnology CompaniesContract Research Organizations
By RegionNorth America, Europe, Asia-Pacific, South America, Middle East & AfricaNorth AmericaAsia-Pacific


Market Segmentation Overview

By Protein Type

Sub-SegmentKey Trend
InsulinBiosimilar entry compresses pricing while raising characterisation volumes
Monoclonal AntibodiesBispecific and ADC formats extend engineering workload per programme.
VaccinesPlatform reuse across antigens lowers marginal design cost.
ErythropoietinGlycoengineering focus for extended half-life variants
InterferonsPegylation and stability optimisation for autoimmune indications
Colony Stimulating FactorsSupportive-care demand tied to oncology treatment volumes
Growth HormonesLong-acting formulations drive redesign activity.
OthersEnzyme replacement and rare-disease proteins gaining share


Antibody formats will keep absorbing the largest engineering budgets through 2035. However, the growth story sits with vaccines and rare-disease proteins, where platform economics reward each incremental indication rather than penalising it.

By Product & Service

Sub-SegmentKey Trend
InstrumentsReplacement cycles lengthen as compute substitutes for physical throughput
ConsumablesPredictable reorder economics insulate revenue from capex freezes
Software & ServicesConsumption-based and outcome-linked pricing displace perpetual licences.


Revenue mix is shifting quietly but decisively. Suppliers that once sold boxes now defend margin through recurring reagent and subscription streams, and the software attach rate has become the cleanest predictor of vendor valuation.

By Technology

Sub-SegmentKey Trend
Irrational DesignLibrary screening persists where structural knowledge is thin
Rational DesignStructure-guided methods benefit from expanding predicted-structure databases.
Hybrid DesignComputational pre-filtering cuts screening volumes by an order of magnitude.


Methodological boundaries are blurring. Most industrial programmes now run hybrid workflows in practice even when they report under a single technology label, which is why the hybrid segment's growth rate understates its true footprint.

By End User

Sub-SegmentKey Trend
Pharmaceutical and Biotechnology CompaniesInternal capacity focused on late-stage developability work
Academic & Research InstitutesShared core facilities offset flat equipment budgets.
Contract Research OrganizationsVariable-cost model wins share during pipeline uncertainty.
OthersIndustrial enzyme and agricultural users scale biocatalytic routes.


Buying power is migrating toward organisations that can convert fixed costs into variable ones. Sponsors retain regulatory-critical work in-house and push exploratory design outward, which explains why CRO growth outpaces the market even as pharma retains the largest absolute spend.




Share::
Request Free Sample
Download PDF ×

We do not share your information with anyone. However, we may send you emails based on your report interest from time to time. You may contact us at any time to opt-out.