Certified Global Research Member
Isomar fd.webp Wcrc 57.webp
Key Questions Answered
  • Global Market Outlook
  • In-depth analysis of global and regional trends
  • Analyze and identify the major players in the market, their market share, key developments, etc.
  • To understand the capability of the major players based on products offered, financials, and strategies.
  • Identify disrupting products, companies, and trends.
  • To identify opportunities in the market.
  • Analyze the key challenges in the market.
  • Analyze the regional penetration of players, products, and services in the market.
  • Comparison of major players’ financial performance.
  • Evaluate strategies adopted by major players.
  • Recommendations
Why Choose Market Research Future?
  • Vigorous research methodologies for specific market.
  • Knowledge partners across the globe
  • Large network of partner consultants.
  • Ever-increasing/ Escalating data base with quarterly monitoring of various markets
  • Trusted by fortune 500 companies/startups/ universities/organizations
  • Large database of 5000+ markets reports.
  • Effective and prompt pre- and post-sales support.

Process Automation and Instrumentation Market Research Report Information By Instrument (Field Instrument and Control Valve And Analyzer), By Solution (APC, DCS, HMI, MES, PLC, and Safety automation & SCADA), By Surgery (Chemicals, Energy & Power, and Food & Beverages), And By Region (North America, Europe, Asia-Pacific, And Rest Of The World) – Market Forecast Till 2030


ID: MRFR/SEM/4064-CR | 100 Pages | Author: Aarti Dhapte| September 2022

Process Automation and Instrumentation Market Segmentation


Process Automation and Instrumentation Instrument Outlook (USD Billion, 2019-2030)


  • Field Instrument


  • Control Valve and Analyzer


Process Automation and Instrumentation Solution Outlook (USD Billion, 2019-2030)


  • APC


  • DCS


  • HMI


  • MES


  • PLC


  • Safety automation & SCADA


Process Automation and Instrumentation End-User Outlook (USD Billion, 2019-2030)


  • Chemicals


  • Energy & Power


  • Food & Beverages


Process Automation and Instrumentation Regional Outlook (USD Billion, 2019-2030)


  • North America Outlook (USD Billion, 2019-2030)


    • North America Process Automation and Instrumentation by Instrument


      • Field Instrument


      • Control Valve and Analyzer


    • North America Process Automation and Instrumentation by Solution


      • APC


      • DCS


      • HMI


      • MES


      • PLC


      • Safety automation & SCADA


    • North America Process Automation and Instrumentation by End-User


      • Chemicals


      • Energy & Power


      • Food & Beverages


    • US Outlook (USD Billion, 2019-2030)


    • US Process Automation and Instrumentation by Instrument


      • Field Instrument


      • Control Valve and Analyzer


    • US Process Automation and Instrumentation by Solution


      • APC


      • DCS


      • HMI


      • MES


      • PLC


      • Safety automation & SCADA


    • US Process Automation and Instrumentation by End-User


      • Chemicals


      • Energy & Power


      • Food & Beverages


    • CANADA Outlook (USD Billion, 2019-2030)


    • CANADA Process Automation and Instrumentation by Instrument


      • Field Instrument


      • Control Valve and Analyzer


    • CANADA Process Automation and Instrumentation by Solution


      • APC


      • DCS


      • HMI


      • MES


      • PLC


      • Safety automation & SCADA


    • CANADA Process Automation and Instrumentation by End-User


      • Chemicals


      • Energy & Power


      • Food & Beverages


  • Europe Outlook (USD Billion, 2019-2030)


    • Europe Process Automation and Instrumentation by Instrument


      • Field Instrument


      • Control Valve and Analyzer


    • Europe Process Automation and Instrumentation by Solution


      • APC


      • DCS


      • HMI


      • MES


      • PLC


      • Safety automation & SCADA


    • Europe Process Automation and Instrumentation by End-User


      • Chemicals


      • Energy & Power


      • Food & Beverages


    • Germany Outlook (USD Billion, 2019-2030)


    • Germany Process Automation and Instrumentation by Instrument


      • Field Instrument


      • Control Valve and Analyzer


    • Germany Process Automation and Instrumentation by Solution


      • APC


      • DCS


      • HMI


      • MES


      • PLC


      • Safety automation & SCADA


    • Germany Process Automation and Instrumentation by End-User


      • Chemicals


      • Energy & Power


      • Food & Beverages


    • France Outlook (USD Billion, 2019-2030)


    • France Process Automation and Instrumentation by Instrument


      • Field Instrument


      • Control Valve and Analyzer


    • France Process Automation and Instrumentation by Solution


      • APC


      • DCS


      • HMI


      • MES


      • PLC


      • Safety automation & SCADA


    • France Process Automation and Instrumentation by End-User


      • Chemicals


      • Energy & Power


      • Food & Beverages


    • UK Outlook (USD Billion, 2019-2030)


    • UK Process Automation and Instrumentation by Instrument


      • Field Instrument


      • Control Valve and Analyzer


    • UK Process Automation and Instrumentation by Solution


      • APC


      • DCS


      • HMI


      • MES


      • PLC


      • Safety automation & SCADA


    • UK Process Automation and Instrumentation by End-User


      • Chemicals


      • Energy & Power


      • Food & Beverages


    • ITALY Outlook (USD Billion, 2019-2030)


    • ITALY Process Automation and Instrumentation by Instrument


      • Field Instrument


      • Control Valve and Analyzer


    • ITALY Process Automation and Instrumentation by Solution


      • APC


      • DCS


      • HMI


      • MES


      • PLC


      • Safety automation & SCADA


    • ITALY Process Automation and Instrumentation by End-User


      • Chemicals


      • Energy & Power


      • Food & Beverages


    • SPAIN Outlook (USD Billion, 2019-2030)


    • Spain Process Automation and Instrumentation by Instrument


      • Field Instrument


      • Control Valve and Analyzer


    • Spain Process Automation and Instrumentation by Solution


      • APC


      • DCS


      • HMI


      • MES


      • PLC


      • Safety automation & SCADA


    • Spain Process Automation and Instrumentation by End-User


      • Chemicals


      • Energy & Power


      • Food & Beverages


    • Rest Of Europe Outlook (USD Billion, 2019-2030)


    • Rest Of Europe Process Automation and Instrumentation by Instrument


      • Field Instrument


      • Control Valve and Analyzer


    • REST OF EUROPE Process Automation and Instrumentation by Solution


      • APC


      • DCS


      • HMI


      • MES


      • PLC


      • Safety automation & SCADA


    • REST OF EUROPE Process Automation and Instrumentation by End-User


      • Chemicals


      • Energy & Power


      • Food & Beverages


  • Asia-Pacific Outlook (USD Billion, 2019-2030)


    • Asia-Pacific Process Automation and Instrumentation by Instrument


      • Field Instrument


      • Control Valve and Analyzer


    • Asia-Pacific Process Automation and Instrumentation by Solution


      • APC


      • DCS


      • HMI


      • MES


      • PLC


      • Safety automation & SCADA


    • Asia-Pacific Process Automation and Instrumentation by End-User


      • Chemicals


      • Energy & Power


      • Food & Beverages


    • China Outlook (USD Billion, 2019-2030)


    • China Process Automation and Instrumentation by Instrument


      • Field Instrument


      • Control Valve and Analyzer


    • China Process Automation and Instrumentation by Solution


      • APC


      • DCS


      • HMI


      • MES


      • PLC


      • Safety automation & SCADA


    • China Process Automation and Instrumentation by End-User


      • Chemicals


      • Energy & Power


      • Food & Beverages


    • Japan Outlook (USD Billion, 2019-2030)


    • Japan Process Automation and Instrumentation by Instrument


      • Field Instrument


      • Control Valve and Analyzer


    • Japan Process Automation and Instrumentation by Solution


      • APC


      • DCS


      • HMI


      • MES


      • PLC


      • Safety automation & SCADA


    • Japan Process Automation and Instrumentation by End-User


      • Chemicals


      • Energy & Power


      • Food & Beverages


    • India Outlook (USD Billion, 2019-2030)


    • India Process Automation and Instrumentation by Instrument


      • Field Instrument


      • Control Valve and Analyzer


    • India Process Automation and Instrumentation by Solution


      • APC


      • DCS


      • HMI


      • MES


      • PLC


      • Safety automation & SCADA


    • India Process Automation and Instrumentation by End-User


      • Chemicals


      • Energy & Power


      • Food & Beverages


    • Australia Outlook (USD Billion, 2019-2030)


    • Australia Process Automation and Instrumentation by Instrument


      • Field Instrument


      • Control Valve and Analyzer


    • Australia Process Automation and Instrumentation by Solution


      • APC


      • DCS


      • HMI


      • MES


      • PLC


      • Safety automation & SCADA


    • Australia Process Automation and Instrumentation by End-User


      • Chemicals


      • Energy & Power


      • Food & Beverages


    • Rest of Asia-Pacific Outlook (USD Billion, 2019-2030)


    • Rest of Asia-Pacific Process Automation and Instrumentation by Instrument


      • Field Instrument


      • Control Valve and Analyzer


    • Rest of Asia-Pacific Process Automation and Instrumentation by Solution


      • APC


      • DCS


      • HMI


      • MES


      • PLC


      • Safety automation & SCADA


    • Rest of Asia-Pacific Process Automation and Instrumentation by End-User


      • Chemicals


      • Energy & Power


      • Food & Beverages


  • Rest of the World Outlook (USD Billion, 2019-2030)


    • Rest of the World Process Automation and Instrumentation by Instrument


      • Field Instrument


      • Control Valve and Analyzer


    • Rest of the World Process Automation and Instrumentation by Solution


      • APC


      • DCS


      • HMI


      • MES


      • PLC


      • Safety automation & SCADA


    • Rest of the World Process Automation and Instrumentation by End-User


      • Chemicals


      • Energy & Power


      • Food & Beverages


    • Middle East Outlook (USD Billion, 2019-2030)


    • Middle East Process Automation and Instrumentation by Instrument


      • Field Instrument


      • Control Valve and Analyzer


    • Middle East Process Automation and Instrumentation by Solution


      • APC


      • DCS


      • HMI


      • MES


      • PLC


      • Safety automation & SCADA


    • Middle East Process Automation and Instrumentation by End-User


      • Chemicals


      • Energy & Power


      • Food & Beverages


    • Africa Outlook (USD Billion, 2019-2030)


    • Africa Process Automation and Instrumentation by Instrument


      • Field Instrument


      • Control Valve and Analyzer


    • Africa Process Automation and Instrumentation by Solution


      • APC


      • DCS


      • HMI


      • MES


      • PLC


      • Safety automation & SCADA


    • Africa Process Automation and Instrumentation by End-User


      • Chemicals


      • Energy & Power


      • Food & Beverages


    • Latin America Outlook (USD Billion, 2019-2030)


    • Latin America Process Automation and Instrumentation by Instrument


      • Field Instrument


      • Control Valve and Analyzer


    • Latin America Process Automation and Instrumentation by Solution


      • APC


      • DCS


      • HMI


      • MES


      • PLC


      • Safety automation & SCADA


    • Latin America Process Automation and Instrumentation by End-User


      • Chemicals


      • Energy & Power


      • Food & Beverages


Research Methodology on 
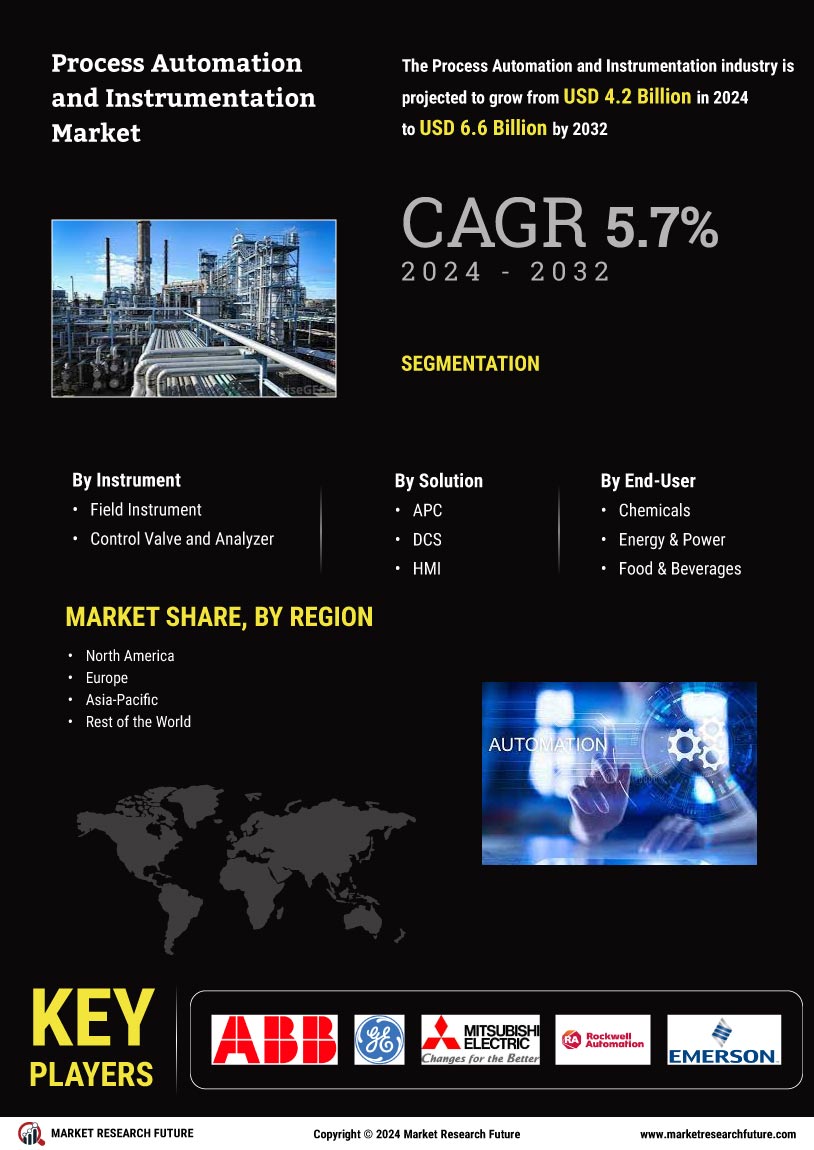
Process Automation Instrumentation Market


The present study was conducted to seek a comprehensive evaluation of the major trends, drivers, restraints, opportunities, and competitive landscape related to the Global Process Automation & Instrumentation Market.


A comprehensive list of research sources such as databases, journals, and other companies offering related products was considered to obtain relevant information about the study. The study focused on both primary research and secondary sources of information to attain viable data. Furthermore, primary research also includes interactions with industry leaders and senior-level executives in the process automation & instrumentation industry. The present research includes procedures such as secondary research and in-depth interviews with key personnel & stakeholders across nations including China, Japan, India, the US, the UK, Brazil, and Europe. Online surveys & interviews were used for obtaining detailed insights and historic records.


The secondary sources that were utilized for the study include fact-based research from various sources including market research reports, scientific journals, trade magazines, white papers, government websites, and newspapers. The data is consolidated and analyzed using statistical tools like regression analysis, correlation studies, and other analytical tools. Besides, interviews and surveys, the research findings also depend on macroeconomic/microeconomic conditions such as industrial production, gross domestic product (GDP), manufacturing inventory, new product launches, pricing analysis, import/export and demand/supply dynamics etc.


Moreover, the study also catered to historical analysis in order to understand the market forces in the forecast period 2023 to 2030. Several industry delimitations have been used to analyse and envisage the current scene and future growth of the market. The delimitations used for the study include time frame, geography, type,


End-user and application. This research took into account four stages of the industry: assessment, analysis, market forecasting & modelling.


The figures contained in this study have been derived and validated through research, as well as credible sources such as reputed agencies and professional bodies, annual reports, and through interviews or surveys. The data is obtained via interviews and surveys conducted with industry leaders, active participants, professionals, and experts. A deductive approach was chosen to gain useful deductions on the market that were then used to assess & validate the information obtained through primary & secondary sources.


An attempt was made to identify a comprehensive outlook of the relevant technology advancements and other related trends that shape the market worldwide. The key players focused on in the study include ABB Ltd., Schneider Electric SE, Emerson Electric Co., Siemens AG, Yokogawa Electric Corporation, Rockwell Automation, Honeywell International Inc., and Others. Also, the research analyst held discussions with leading professionals in the industry.


For the purpose of the current research, a combination of both primary and secondary research techniques has been employed. For collecting the information, different approaches such as email interaction, phone interviews, desk research, extensive secondary research, and primary interviews have been used. The analysis includes data from in-depth interviews, surveys and findings obtained from secondary sources such as reports and industry associations. The qualitative data includes the views shared by industry leaders and experts along with other industry stakeholders. Quantitative data was gathered from various platforms such as existing databases and journals.


Furthermore, to increase the relevancy and rigour of the market data, key players were contacted along with their customers, suppliers and vendors in order to derive opinions and insights. The study aims to forecast the market with respect to segments including end-user, type and region using forecast estimations including compound annual growth rate (CAGR). The extensive market pattern analysis took into account a variety of macroeconomic and microeconomic parameters that ultimately shaped the market scenarios.


In the end, the triangulation approach has been used to validate the market numbers obtained from the primary research and secondary research. The data was compiled and analyzed to obtain accurate and reliable estimations. The reliability of the research is validated with the data collected from reputed industry portals such as Hoovers, Bloomberg BusinessWeek, Factiva, and others. Moreover, the company profiles, product offerings, and developments in the area of process automation and instrumentation have been considered.

Leading companies partner with us for data-driven Insights
client_1 client_2 client_3 client_4 client_5 client_6 client_7 client_8 client_9 client_10
Please fill in Business Email for Quick Response

TABLE OF CONTENTS

1 EXECUTIVE SUMMARY 20

1.1 MARKET ATTRACTIVENESS ANALYSIS 21

2 MARKET INTRODUCTION 22

2.1 DEFINITION 22

2.2 SCOPE OF THE STUDY 22

2.3 RESEARCH OBJECTIVE 22

2.4 MARKET STRUCTURE 23

3 RESEARCH METHODOLOGY 24

4 MARKET DYNAMICS 31

4.1 INTRODUCTION 31

4.2 DRIVERS 32

4.2.1 GROWING REGULATORY COMPLIANCES IN PROCESS INDUSTRIES 32

4.2.2 RISING TREND OF CONNECTED ENTERPRISES IN PROCESS INDUSTRIES 33

4.2.3 INCREASING FOCUS OF MANUFACTURING FIRMS ON ACHIEVING COST-SAVING AND BETTER EFFICIENCY 33

4.3 RESTRAINT 35

4.3.1 HIGH IMPLEMENTATION & MAINTENANCE COSTS 35

4.3.2 HIGH INSTRUMENTATION FAILURE RATES 36

4.4 OPPORTUNITY 37

4.4.1 RISING GROWTH IN INDUSTRIAL ROBOTICS 37

4.4.2 INCREASING ADOPTION OF INDUSTRIAL INTERNET OF THINGS (IIOT) ACROSS VARIOUS INDUSTRIES 37

4.4.3 ADOPTION OF INDUSTRIAL 4.0 ACROSS VARIOUS INDUSTRIES 38

4.5 IMPACT OF COVID-19 39

4.5.1 IMPACT ON SEMICONDUCTOR MANUFACTURERS 39

4.5.2 IMPACT ON DEVICE MANUFACTURERS 40

4.5.3 IMPACT ON COMPONENT MANUFACTURERS 40

4.5.4 COVID-19 IMPACT ON SUPPLY CHAIN DELAYS 41

5 MARKET FACTOR ANALYSIS 42

5.1 VALUE CHAIN ANALYSIS/SUPPLY CHAIN ANALYSIS 42

5.1.1 INTRODUCTION 42

5.1.2 PARTS & COMPONENTS MANUFACTURERS 43

5.1.3 SOFTWARE DEVELOPER 43

5.1.4 SYSTEM INTEGRATORS 43

5.1.5 INDUSTRIAL AUTOMATION SERVICE/ SOLUTION PROVIDERS 43

5.1.6 END USERS 43

5.2 PORTER'S FIVE FORCES MODEL 44

5.2.1 THREAT OF NEW ENTRANTS 44

5.2.2 BARGAINING POWER OF SUPPLIERS 45

5.2.3 THREAT OF SUBSTITUTES 45

5.2.4 BARGAINING POWER OF BUYERS 45

5.2.5 INTENSITY OF RIVALRY 45

6 GLOBAL PROCESS AUTOMATION AND INSTRUMENTATION MARKET,

BY INSTRUMENT TYPE 46

6.1 INTRODUCTION 46

6.2 ULTRASONIC LEVEL MEASUREMENT 47

6.3 RADAR LEVEL MEASUREMENT 47

6.4 OPEN-CHANNEL FLOW 48

6.5 NON-CONTACTING PIPE FLOW 48

7 GLOBAL PROCESS AUTOMATION AND INSTRUMENTATION MARKET,

BY APPLICATION 49

7.1 INTRODUCTION 49

7.2 OIL & GAS 50

7.3 CHEMICALS 51

7.4 PHARMACEUTICALS 51

7.5 WATER & WASTEWATER 51

7.6 METALS & MINING 52

7.7 ENERGY & POWER 52

7.8 OTHERS 52

8 GLOBAL PROCESS AUTOMATION AND INSTRUMENTATION MARKET,

APPLICATION BY INSTRUMENT TYPE 53

8.1 GLOBAL PROCESS AUTOMATION AND INSTRUMENTATION MARKET, OIL & GAS APPLICATION

BY INSTRUMENT TYPE, 2023-2030(USD MILLION) 53

8.2 GLOBAL PROCESS AUTOMATION AND INSTRUMENTATION MARKET, CHEMICALS APPLICATION

BY INSTRUMENT TYPE, 2023-2030(USD MILLION) 53

8.3 GLOBAL PROCESS AUTOMATION AND INSTRUMENTATION MARKET, PHARMACEUTICALS APPLICATION

BY INSTRUMENT TYPE, 2023-2030(USD MILLION) 54

8.4 GLOBAL PROCESS AUTOMATION AND INSTRUMENTATION MARKET, WATER & WASTEWATER APPLICATION

BY INSTRUMENT TYPE, 2023-2030(USD MILLION) 54

8.5 GLOBAL PROCESS AUTOMATION AND INSTRUMENTATION MARKET, METALS & MINING APPLICATION

BY INSTRUMENT TYPE, 2023-2030(USD MILLION) 54

8.6 GLOBAL PROCESS AUTOMATION AND INSTRUMENTATION MARKET, ENERGY & POWER APPLICATION

BY INSTRUMENT TYPE, 2023-2030(USD MILLION) 55

8.7 GLOBAL PROCESS AUTOMATION AND INSTRUMENTATION MARKET, OTHERS APPLICATION

BY INSTRUMENT TYPE, 2023-2030(USD MILLION) 55

9 GLOBAL PROCESS AUTOMATION AND INSTRUMENTATION MARKET, BY REGION 56

9.1 OVERVIEW 56

9.2 NORTH AMERICA 58

9.2.1 NORTH AMERICA: PROCESS AUTOMATION AND INSTRUMENTATION MARKET, BY COUNTRY, 2023-2030

(USD BILLION) 58

9.2.2 NORTH AMERICA: PROCESS AUTOMATION AND INSTRUMENTATION MARKET, BY INSTRUMENT TYPE,

2023-2030(USD BILLION) 60

9.2.3 NORTH AMERICA: PROCESS AUTOMATION AND INSTRUMENTATION MARKET, BY APPLICATION,

2023-2030(USD BILLION) 61

9.2.4 US 62

9.2.4.1 US: PROCESS AUTOMATION AND INSTRUMENTATION MARKET, BY INSTRUMENT TYPE, 2018–2030

(USD BILLION) 62

9.2.4.2 US: PROCESS AUTOMATION AND INSTRUMENTATION MARKET, BY APPLICATION, 2023-2030

(USD BILLION) 62

9.2.5 CANADA 63

9.2.5.1 CANADA: PROCESS AUTOMATION AND INSTRUMENTATION MARKET, BY INSTRUMENT TYPE,

2023-2030(USD BILLION) 63

9.2.5.2 CANADA: PROCESS AUTOMATION AND INSTRUMENTATION MARKET, BY APPLICATION, 2023-2030

(USD BILLION) 63

9.2.6 MEXICO 64

9.2.6.1 MEXICO: PROCESS AUTOMATION AND INSTRUMENTATION MARKET, BY INSTRUMENT TYPE,

2023-2030(USD BILLION) 64

9.2.6.2 MEXICO: PROCESS AUTOMATION AND INSTRUMENTATION MARKET, BY APPLICATION, 2018–2030

(USD BILLION) 64

9.3 EUROPE 65

9.3.1 EUROPE: PROCESS AUTOMATION AND INSTRUMENTATION MARKET, BY COUNTRY, 2023-2030(USD BILLION) 65

9.3.2 EUROPE: PROCESS AUTOMATION AND INSTRUMENTATION MARKET, BY INSTRUMENT TYPE, 2018–2030

(USD BILLION) 67

9.3.3 EUROPE: PROCESS AUTOMATION AND INSTRUMENTATION MARKET, BY APPLICATION, 2023-2030

(USD BILLION) 68

9.3.4 GERMANY 69

9.3.4.1 GERMANY: PROCESS AUTOMATION AND INSTRUMENTATION MARKET, BY INSTRUMENT TYPE,

2023-2030(USD BILLION) 69

9.3.4.2 GERMANY: PROCESS AUTOMATION AND INSTRUMENTATION MARKET, BY APPLICATION,

2023-2030(USD BILLION) 69

9.3.5 UK 70

9.3.5.1 UK: PROCESS AUTOMATION AND INSTRUMENTATION MARKET, BY INSTRUMENT TYPE, 2023-2030

(USD BILLION) 70

9.3.5.2 UK: PROCESS AUTOMATION AND INSTRUMENTATION MARKET, BY APPLICATION, 2018–2030

(USD BILLION) 70

9.3.6 FRANCE 71

9.3.6.1 FRANCE: PROCESS AUTOMATION AND INSTRUMENTATION MARKET, BY INSTRUMENT TYPE,

2023-2030(USD BILLION) 71

9.3.6.2 FRANCE: PROCESS AUTOMATION AND INSTRUMENTATION MARKET, BY APPLICATION, 2018–2030

(USD BILLION) 71

9.3.7 REST OF EUROPE 72

9.3.7.1 REST OF EUROPE: PROCESS AUTOMATION AND INSTRUMENTATION MARKET, BY INSTRUMENT

TYPE, 2023-2030(USD BILLION) 72

9.3.7.2 REST OF EUROPE: PROCESS AUTOMATION AND INSTRUMENTATION MARKET, BY APPLICATION,

2023-2030(USD BILLION) 72

9.4 ASIA-PACIFIC 73

9.4.1 ASIA-PACIFIC: PROCESS AUTOMATION AND INSTRUMENTATION MARKET, BY COUNTRY, 2018–2030

(USD BILLION) 73

9.4.2 ASIA-PACIFIC: PROCESS AUTOMATION AND INSTRUMENTATION MARKET, BY INSTRUMENT TYPE,

2023-2030(USD BILLION) 75

9.4.3 ASIA-PACIFIC: PROCESS AUTOMATION AND INSTRUMENTATION MARKET, BY APPLICATION, 2023-2030

(USD BILLION) 76

9.4.4 CHINA 77

9.4.4.1 CHINA: PROCESS AUTOMATION AND INSTRUMENTATION MARKET, BY INSTRUMENT TYPE,

2023-2030(USD BILLION) 77

9.4.4.2 CHINA: PROCESS AUTOMATION AND INSTRUMENTATION MARKET, BY APPLICATION,

2023-2030(USD BILLION) 77

9.4.5 JAPAN 78

9.4.5.1 JAPAN: PROCESS AUTOMATION AND INSTRUMENTATION MARKET, BY INSTRUMENT TYPE,

2023-2030(USD BILLION) 78

9.4.5.2 JAPAN: PROCESS AUTOMATION AND INSTRUMENTATION MARKET, BY APPLICATION, 2018–2030

(USD BILLION) 78

9.4.6 INDIA 79

9.4.6.1 INDIA: PROCESS AUTOMATION AND INSTRUMENTATION MARKET, BY INSTRUMENT TYPE, 2023-2030

(USD BILLION) 79

9.4.6.2 INDIA: PROCESS AUTOMATION AND INSTRUMENTATION MARKET, BY APPLICATION, 2023-2030

(USD BILLION) 79

9.4.7 SOUTH KOREA 80

9.4.7.1 SOUTH KOREA: PROCESS AUTOMATION AND INSTRUMENTATION MARKET, BY INSTRUMENT TYPE,

2023-2030(USD BILLION) 80

9.4.7.2 SOUTH KOREA: PROCESS AUTOMATION AND INSTRUMENTATION MARKET, BY APPLICATION,

2023-2030(USD BILLION) 80

9.4.8 REST OF ASIA-PACIFIC 81

9.4.8.1 REST OF ASIA-PACIFIC: PROCESS AUTOMATION AND INSTRUMENTATION MARKET,

BY INSTRUMENT TYPE, 2023-2030(USD BILLION) 81

9.4.8.2 REST OF ASIA-PACIFIC: PROCESS AUTOMATION AND INSTRUMENTATION MARKET,

BY APPLICATION, 2023-2030(USD BILLION) 81

9.5 MIDDLE EAST & AFRICA 82

9.5.1 MIDDLE EAST & AFRICA: PROCESS AUTOMATION AND INSTRUMENTATION MARKET, BY INSTRUMENT

TYPE, 2023-2030(USD BILLION) 82

9.5.2 MIDDLE EAST & AFRICA: PROCESS AUTOMATION AND INSTRUMENTATION MARKET, BY APPLICATION,

2023-2030(USD BILLION) 83

9.6 SOUTH AMERICA 84

9.6.1 SOUTH AMERICA: PROCESS AUTOMATION AND INSTRUMENTATION MARKET, BY INSTRUMENT TYPE,

2023-2030(USD BILLION) 84

9.6.2 SOUTH AMERICA: PROCESS AUTOMATION AND INSTRUMENTATION MARKET, BY APPLICATION,

2023-2030(USD BILLION) 85

10 COMPETITVE LANDSCAPE 86

10.1 COMPETITIVE BENCHMARKING 88

10.2 VENDOR SHARE ANALYSIS 91

10.3 RECENT DEVELOPMENTS 91

10.3.1 PRODUCT DEVELOPMENT/ PRODUCT LAUNCH 91

10.3.2 PARTNERSHIPS/AGREEMENTS/CONTRACTS/COLLABORATIONS/ BUSINESS EXPANSION 93

10.3.3 ACQUISITIONS AND MERGERS 93

11 COMPANY PROFILE 96

11.1 EMERSON ELECTRIC CO. 96

11.1.1 COMPANY OVERVIEW 96

11.1.2 FINANCIAL OVERVIEW 97

11.1.3 PRODUCTS OFFERED 97

11.1.4 KEY DEVELOPMENTS 102

11.1.5 SWOT ANALYSIS 103

11.1.6 KEY STRATEGIES 103

11.2 HONEYWELL INTERNATIONAL INC. 104

11.2.1 COMPANY OVERVIEW 104

11.2.2 FINANCIAL OVERVIEW 105

11.2.3 PRODUCTS OFFERED 106

11.2.4 KEY DEVELOPMENTS 107

11.2.5 SWOT ANALYSIS 108

11.2.6 KEY STRATEGIES 108

11.3 SIEMENS AG 109

11.3.1 COMPANY OVERVIEW 109

11.3.2 FINANCIAL OVERVIEW 110

11.3.3 PRODUCTS OFFERED 110

11.3.4 KEY DEVELOPMENTS 113

11.3.5 SWOT ANALYSIS 113

11.3.6 KEY STRATEGIES 113

11.4 ABB LTD 114

11.4.1 COMPANY OVERVIEW 114

11.4.2 FINANCIAL OVERVIEW 115

11.4.3 PRODUCTS OFFERED 116

11.4.4 KEY DEVELOPMENTS 118

11.4.5 SWOT ANALYSIS 118

11.4.6 KEY STRATEGIES 119

11.5 SCHNEIDER ELECTRIC SE 120

11.5.1 COMPANY OVERVIEW 120

11.5.2 FINANCIAL OVERVIEW 121

11.5.3 PRODUCTS/SOLUTIONS/SERVICES OFFERED 121

11.5.4 KEY DEVELOPMENTS 123

11.5.5 SWOT ANALYSIS 124

11.5.6 KEY STRATEGIES 124

11.6 HAWK MEASUREMENT SYSTEMS 125

11.6.1 COMPANY OVERVIEW 125

11.6.2 FINANCIAL OVERVIEW 125

11.6.3 PRODUCTS OFFERED 125

11.6.4 KEY DEVELOPMENT 126

11.6.5 SWOT ANALYSIS 127

11.6.6 KEY STRATEGIES 127

11.7 ENDRESS+HAUSER GROUP SERVICES AG 128

11.7.1 COMPANY OVERVIEW 128

11.7.2 FINANCIAL OVERVIEW 128

11.7.3 PRODUCTS OFFERED 128

11.7.4 KEY DEVELOPMENT 130

11.7.5 SWOT ANALYSIS 131

11.7.6 KEY STRATEGIES 131

11.8 FAFNIR GMBH - SENSORS & SYSTEMS 132

11.8.1 COMPANY OVERVIEW 132

11.8.2 FINANCIAL OVERVIEW 132

11.8.3 PRODUCTS OFFERED 132

11.8.4 KEY DEVELOPMENT 132

11.9 NIVELCO ZRT 133

11.9.1 COMPANY OVERVIEW 133

11.9.2 FINANCIAL OVERVIEW 133

11.9.3 PRODUCTS OFFERED 133

11.9.4 KEY DEVELOPMENT 134

11.10 FLOWTRONICS 135

11.10.1 COMPANY OVERVIEW 135

11.10.2 FINANCIAL OVERVIEW 135

11.10.3 PRODUCTS OFFERED 135

11.10.4 KEY DEVELOPMENT 135

11.11 BADGER METER, INC. 136

11.11.1 COMPANY OVERVIEW 136

11.11.2 FINANCIAL OVERVIEW 137

11.11.3 PRODUCTS/SOLUTIONS/SERVICES OFFERED 137

11.11.4 KEY DEVELOPMENTS 138

11.11.5 SWOT ANALYSIS 139

11.11.6 KEY STRATEGIES 139

11.12 FLEXIM 140

11.12.1 COMPANY OVERVIEW 140

11.12.2 FINANCIAL OVERVIEW 140

11.12.3 PRODUCTS/SOLUTIONS/SERVICES OFFERED 140

11.12.4 KEY DEVELOPMENTS 141

11.12.5 SWOT ANALYSIS 141

11.12.6 KEY STRATEGIES 142

11.13 MICRONICS LTD 143

11.13.1 COMPANY OVERVIEW 143

11.13.2 FINANCIAL OVERVIEW 143

11.13.3 PRODUCTS/SOLUTIONS/SERVICES OFFERED 143

11.13.4 KEY DEVELOPMENTS 144

11.13.5 SWOT ANALYSIS 144

11.13.6 KEY STRATEGIES 145

11.14 KATRONIC 146

11.14.1 COMPANY OVERVIEW 146

11.14.2 FINANCIAL OVERVIEW 146

11.14.3 PRODUCTS/SOLUTIONS/SERVICES OFFERED 146

11.14.4 KEY DEVELOPMENTS 146

11.15 AMETEK INC. 147

11.15.1 COMPANY OVERVIEW 147

11.15.2 FINANCIAL OVERVIEW 148

11.15.3 PRODUCTS OFFERED 148

11.15.4 KEY DEVELOPMENT 149

11.15.5 SWOT ANALYSIS 150

11.15.6 KEY STRATEGIES 150

11.16 TELEDYNE ISCO 151

11.16.1 COMPANY OVERVIEW 151

11.16.2 FINANCIAL OVERVIEW 152

11.16.3 PRODUCTS OFFERED 153

11.16.4 KEY DEVELOPMENT 153

11.16.5 SWOT ANALYSIS 154

11.16.6 KEY STRATEGIES 154

11.17 HACH 155

11.17.1 COMPANY OVERVIEW 155

11.17.2 FINANCIAL OVERVIEW 156

11.17.3 PRODUCTS OFFERED 157

11.17.4 KEY DEVELOPMENT 157

11.17.5 SWOT ANALYSIS 158

11.17.6 KEY STRATEGIES 158

11.18 ADS 159

11.18.1 COMPANY OVERVIEW 159

11.18.2 FINANCIAL OVERVIEW 159

11.18.3 PRODUCTS OFFERED 159

11.18.4 KEY DEVELOPMENT 159

11.19 NIVUS GMBH 160

11.19.1 COMPANY OVERVIEW 160

11.19.2 FINANCIAL OVERVIEW 160

11.19.3 PRODUCTS OFFERED 160

11.19.4 KEY DEVELOPMENT 161

11.19.5 SWOT ANALYSIS 162

11.19.6 KEY STRATEGIES 162

11.20 KROHNE LTD 163

11.20.1 COMPANY OVERVIEW 163

11.20.2 FINANCIAL OVERVIEW 163

11.20.3 PRODUCTS OFFERED 163

11.20.4 KEY DEVELOPMENTS 166

11.20.5 KEY STRATEGIES 166

11.21 VEGA GRIESHABER KG 167

11.21.1 COMPANY OVERVIEW 167

11.21.2 FINANCIAL OVERVIEW 167

11.21.3 PRODUCTS OFFERED 167

11.21.4 KEY DEVELOPMENTS 168

11.21.5 SWOT ANALYSIS 169

11.21.6 KEY STRATEGIES 169

11.22 SICK AG 170

11.22.1 COMPANY OVERVIEW 170

11.22.2 FINANCIAL OVERVIEW 171

11.22.3 PRODUCTS OFFERED 171

11.22.4 KEY DEVELOPMENT 173

11.22.5 SWOT ANALYSIS 174

11.22.6 KEY STRATEGIES 174

11.23 RIELS INSTRUMENTS S.R.L. 175

11.23.1 COMPANY OVERVIEW 175

11.23.2 FINANCIAL OVERVIEW 175

11.23.3 PRODUCTS OFFERED 175

11.23.4 KEY DEVELOPMENTS 176

11.23.5 KEY STRATEGIES 176

11.24 RIELS INSTRUMENTS S.R.L. 177

11.24.1 COMPANY OVERVIEW 177

11.24.2 FINANCIAL OVERVIEW 177

11.24.3 PRODUCTS OFFERED 178

11.24.4 KEY DEVELOPMENTS 178

11.25 MARKLAND SPECIALTY ENGINEERING LTD. 179

11.25.1 COMPANY OVERVIEW 179

11.25.2 FINANCIAL OVERVIEW 179

11.25.3 PRODUCTS OFFERED 179

11.25.4 KEY DEVELOPMENTS 179

11.26 ROYCE WATER TECHNOLOGIES 180

11.26.1 COMPANY OVERVIEW 180

11.26.2 FINANCIAL OVERVIEW 180

11.26.3 PRODUCTS OFFERED 180

11.26.4 KEY DEVELOPMENTS 180

11.27 ATI 181

11.27.1 COMPANY OVERVIEW 181

11.27.2 FINANCIAL OVERVIEW 181

11.27.3 PRODUCTS OFFERED 181

11.27.4 KEY DEVELOPMENTS 181

11.28 SONTEK 182

11.28.1 COMPANY OVERVIEW 182

11.28.2 FINANCIAL OVERVIEW 182

11.28.3 PRODUCTS OFFERED 183

11.28.4 KEY DEVELOPMENT 183

11.28.5 SWOT ANALYSIS 183

11.28.6 KEY STRATEGIES 183

11.29 GE PANAMETRICS 184

11.29.1 COMPANY OVERVIEW 184

11.29.2 FINANCIAL OVERVIEW 184

11.29.3 PRODUCTS OFFERED 185

11.29.4 KEY DEVELOPMENT 185

11.29.5 SWOT ANALYSIS 186

11.29.6 KEY STRATEGIES 186

LIST OF TABLES

TABLE 1 MARKET SYNOPSIS 21

TABLE 2 GLOBAL PROCESS AUTOMATION AND INSTRUMENTATION MARKET, BY INSTRUMENT TYPE, 2023-2030(USD MILLION) 46

TABLE 3 GLOBAL PROCESS AUTOMATION AND INSTRUMENTATION MARKET, BY APPLICATION, 2023-2030(USD MILLION) 49

TABLE 4 GLOBAL PROCESS AUTOMATION AND INSTRUMENTATION MARKET, OIL & GAS APPLICATION BY INSTRUMENT TYPE,

2023-2030(USD MILLION) 53

TABLE 5 GLOBAL PROCESS AUTOMATION AND INSTRUMENTATION MARKET, CHEMICALS APPLICATION BY INSTRUMENT TYPE,

2023-2030(USD MILLION) 53

TABLE 6 GLOBAL PROCESS AUTOMATION AND INSTRUMENTATION MARKET, PHARMACEUTICALS APPLICATION BY INSTRUMENT

TYPE, 2023-2030(USD MILLION) 54

TABLE 7 GLOBAL PROCESS AUTOMATION AND INSTRUMENTATION MARKET, WATER & WASTEWATER APPLICATION

BY INSTRUMENT TYPE, 2023-2030(USD MILLION) 54

TABLE 8 GLOBAL PROCESS AUTOMATION AND INSTRUMENTATION MARKET, METALS & MINING APPLICATION BY INSTRUMENT

TYPE, 2023-2030(USD MILLION) 54

TABLE 9 GLOBAL PROCESS AUTOMATION AND INSTRUMENTATION MARKET, ENERGY & POWER APPLICATION BY INSTRUMENT

TYPE, 2023-2030(USD MILLION) 55

TABLE 10 GLOBAL PROCESS AUTOMATION AND INSTRUMENTATION MARKET, OTHERS APPLICATION BY INSTRUMENT TYPE,

2023-2030(USD MILLION) 55

TABLE 11 GLOBAL PROCESS AUTOMATION AND INSTRUMENTATION MARKET, BY REGION, 2018-2026 (USD BILLION) 57

TABLE 12 NORTH AMERICA: PROCESS AUTOMATION AND INSTRUMENTATION MARKET, BY COUNTRY, 2023-2030(USD BILLION) 58

TABLE 13 NORTH AMERICA PROCESS AUTOMATION AND INSTRUMENTATION MARKET, BY INSTRUMENT TYPE, 2023-2030(USD BILLION) 60

TABLE 14 NORTH AMERICA PROCESS AUTOMATION AND INSTRUMENTATION MARKET, BY APPLICATION, 2023-2030(USD BILLION) 61

TABLE 15 US PROCESS AUTOMATION AND INSTRUMENTATION MARKET, BY INSTRUMENT TYPE, 2023-2030(USD BILLION) 62

TABLE 16 US PROCESS AUTOMATION AND INSTRUMENTATION MARKET, BY APPLICATION, 2023-2030(USD BILLION) 62

TABLE 17 CANADA PROCESS AUTOMATION AND INSTRUMENTATION MARKET, BY INSTRUMENT TYPE, 2023-2030(USD BILLION) 63

TABLE 18 CANADA PROCESS AUTOMATION AND INSTRUMENTATION MARKET, BY APPLICATION, 2023-2030(USD BILLION) 63

TABLE 19 MEXICO PROCESS AUTOMATION AND INSTRUMENTATION MARKET, BY INSTRUMENT TYPE, 2023-2030(USD BILLION) 64

TABLE 20 MEXICO PROCESS AUTOMATION AND INSTRUMENTATION MARKET, BY APPLICATION, 2023-2030(USD BILLION) 64

TABLE 21 EUROPE: PROCESS AUTOMATION AND INSTRUMENTATION MARKET, BY COUNTRY, 2023-2030(USD BILLION) 65

TABLE 22 EUROPE PROCESS AUTOMATION AND INSTRUMENTATION MARKET, BY INSTRUMENT TYPE, 2023-2030(USD BILLION) 67

TABLE 23 EUROPE PROCESS AUTOMATION AND INSTRUMENTATION MARKET, BY APPLICATION, 2023-2030(USD BILLION) 68

TABLE 24 GERMANY PROCESS AUTOMATION AND INSTRUMENTATION MARKET, BY INSTRUMENT TYPE, 2023-2030(USD BILLION) 69

TABLE 25 GERMANY PROCESS AUTOMATION AND INSTRUMENTATION MARKET, BY APPLICATION, 2023-2030(USD BILLION) 69

TABLE 26 UK PROCESS AUTOMATION AND INSTRUMENTATION MARKET, BY INSTRUMENT TYPE, 2023-2030(USD BILLION) 70

TABLE 27 UK PROCESS AUTOMATION AND INSTRUMENTATION MARKET, BY APPLICATION, 2023-2030(USD BILLION) 70

TABLE 28 FRANCE PROCESS AUTOMATION AND INSTRUMENTATION MARKET, BY INSTRUMENT TYPE, 2023-2030(USD BILLION) 71

TABLE 29 FRANCE PROCESS AUTOMATION AND INSTRUMENTATION MARKET, BY APPLICATION, 2023-2030(USD BILLION) 71

TABLE 30 REST OF EUROPE PROCESS AUTOMATION AND INSTRUMENTATION MARKET, BY INSTRUMENT TYPE, 2023-2030(USD BILLION) 72

TABLE 31 REST OF EUROPE PROCESS AUTOMATION AND INSTRUMENTATION MARKET, BY APPLICATION, 2023-2030(USD BILLION) 72

TABLE 32 ASIA-PACIFIC: PROCESS AUTOMATION AND INSTRUMENTATION MARKET, BY COUNTRY, 2023-2030(USD BILLION) 73

TABLE 33 ASIA-PACIFIC PROCESS AUTOMATION AND INSTRUMENTATION MARKET, BY INSTRUMENT TYPE, 2023-2030(USD BILLION) 75

TABLE 34 ASIA-PACIFIC PROCESS AUTOMATION AND INSTRUMENTATION MARKET, BY APPLICATION, 2023-2030(USD BILLION) 76

TABLE 35 CHINA PROCESS AUTOMATION AND INSTRUMENTATION MARKET, BY INSTRUMENT TYPE, 2023-2030(USD BILLION) 77

TABLE 36 CHINA PROCESS AUTOMATION AND INSTRUMENTATION MARKET, BY APPLICATION, 2023-2030(USD BILLION) 77

TABLE 37 JAPAN PROCESS AUTOMATION AND INSTRUMENTATION MARKET, BY INSTRUMENT TYPE, 2023-2030(USD BILLION) 78

TABLE 38 JAPAN PROCESS AUTOMATION AND INSTRUMENTATION MARKET, BY APPLICATION, 2023-2030(USD BILLION) 78

TABLE 39 INDIA PROCESS AUTOMATION AND INSTRUMENTATION MARKET, BY INSTRUMENT TYPE, 2023-2030(USD BILLION) 79

TABLE 40 INDIA PROCESS AUTOMATION AND INSTRUMENTATION MARKET, BY APPLICATION, 2023-2030(USD BILLION) 79

TABLE 41 SOUTH KOREA PROCESS AUTOMATION AND INSTRUMENTATION MARKET, BY INSTRUMENT TYPE, 2023-2030(USD BILLION) 80

TABLE 42 SOUTH KOREA PROCESS AUTOMATION AND INSTRUMENTATION MARKET, BY APPLICATION, 2023-2030(USD BILLION) 80

TABLE 43 REST OF ASIA-PACIFIC PROCESS AUTOMATION AND INSTRUMENTATION MARKET, BY INSTRUMENT TYPE, 2018–2030

(USD BILLION) 81

TABLE 44 REST OF ASIA-PACIFIC PROCESS AUTOMATION AND INSTRUMENTATION MARKET, BY APPLICATION, 2023-2030

(USD BILLION) 81

TABLE 45 MIDDLE EAST & AFRICA PROCESS AUTOMATION AND INSTRUMENTATION MARKET, BY INSTRUMENT TYPE, 2023-2030

(USD BILLION) 82

TABLE 46 MIDDLE EAST & AFRICA PROCESS AUTOMATION AND INSTRUMENTATION MARKET, BY APPLICATION, 2018–2030

(USD BILLION) 83

TABLE 47 SOUTH AMERICA PROCESS AUTOMATION AND INSTRUMENTATION MARKET, BY INSTRUMENT TYPE, 2023-2030

(USD BILLION) 84

TABLE 48 SOUTH AMERICA PROCESS AUTOMATION AND INSTRUMENTATION MARKET, BY APPLICATION, 2023-2030

(USD BILLION) 85

TABLE 49 PRODUCT DEVELOPMENT/ PRODUCT LAUNCH 91

TABLE 50 PARTNERSHIPS/AGREEMENTS/CONTRACTS/COLLABORATIONS/ BUSINESS EXPANSION 93

TABLE 51 ACQUISITIONS AND MERGERS 93

TABLE 52 EMERSON ELECTRIC CO.: PRODUCTS OFFERED 97

TABLE 53 EMERSON ELECTRIC CO.: KEY DEVELOPMENTS 102

TABLE 54 HONEYWELL INTERNATIONAL INC: PRODUCTS OFFERED 106

TABLE 55 SIEMENS AG: PRODUCTS OFFERED 110

TABLE 56 SIEMENS AG: KEY DEVELOPMENTS 113

TABLE 57 ABB LTD: PRODUCTS OFFERED 116

TABLE 58 ABB LTD: KEY DEVELOPMENTS 118

TABLE 59 SCHNEIDER ELECTRIC SE: PRODUCTS/SOLUTIONS/SERVICES OFFERED 121

TABLE 60 SCHNEIDER ELECTRIC SE: KEY DEVELOPMENTS 123

TABLE 61 HAWK MEASUREMENT SYSTEMS: PRODUCTS OFFERED 125

TABLE 62 HAWK MEASUREMENT SYSTEMS: KEY DEVELOPMENTS 126

TABLE 63 ENDRESS+HAUSER GROUP SERVICES AG: PRODUCTS OFFERED 128

TABLE 64 ENDRESS+HAUSER GROUP SERVICES AG: KEY DEVELOPMENTS 130

TABLE 65 FAFNIR GMBH - SENSORS & SYSTEMS: PRODUCTS OFFERED 132

TABLE 66 NIVELCO ZRT: PRODUCTS OFFERED 133

TABLE 67 FLOWTRONICS: PRODUCTS OFFERED 135

TABLE 68 BADGER METER, INC.: PRODUCTS/SOLUTIONS/SERVICES OFFERED 137

TABLE 69 BADGER METER, INC.: KEY DEVELOPMENTS 138

TABLE 70 FLEXIM: PRODUCTS/SOLUTIONS/SERVICES OFFERED 140

TABLE 71 FLEXIM: KEY DEVELOPMENTS 141

TABLE 72 MICRONICS LTD: PRODUCTS/SOLUTIONS/SERVICES OFFERED 143

TABLE 73 MICRONICS LTD: KEY DEVELOPMENTS 144

TABLE 74 KATRONIC: PRODUCTS/SOLUTIONS/SERVICES OFFERED 146

TABLE 75 AMETEK INC.: PRODUCTS/SOLUTIONS/SERVICES OFFERED 148

TABLE 76 AMETEK INC.: KEY DEVELOPMENTS 149

TABLE 77 TELEDYNE ISCO: PRODUCTS/SOLUTIONS/SERVICES OFFERED 153

TABLE 78 HACH: PRODUCTS/SOLUTIONS/SERVICES OFFERED 157

TABLE 79 ADS: PRODUCTS/SOLUTIONS/SERVICES OFFERED 159

TABLE 80 NIVUS GMBH: PRODUCTS/SOLUTIONS/SERVICES OFFERED 160

TABLE 81 NIVUS GMBH: KEY DEVELOPMENTS 161

TABLE 82 KROHNE LTD: PRODUCTS OFFERED 163

TABLE 83 KROHNE LTD: KEY DEVELOPMENTS 166

TABLE 84 VEGA GRIESHABER KG: PRODUCTS OFFERED 167

TABLE 85 VEGA GRIESHABER KG: KEY DEVELOPMENTS 168

TABLE 86 SICK AG: PRODUCTS/SOLUTIONS/SERVICES OFFERED 171

TABLE 87 SICK AG: KEY DEVELOPMENTS 173

TABLE 88 VEGA GRIESHABER KG: PRODUCTS OFFERED 175

TABLE 89 RIELS INSTRUMENTS S.R.L.: PRODUCTS OFFERED 178

TABLE 90 MARK SPECIALITY ENGINEERING LIMITED: PRODUCTS OFFERED 179

TABLE 91 ROYCE WATER TECHNOLOGIES: PRODUCTS OFFERED 180

TABLE 92 ATI: PRODUCTS OFFERED 181

TABLE 93 SONTEK: PRODUCTS/SOLUTIONS/SERVICES OFFERED 183

TABLE 94 GE PANAMETRICS: PRODUCTS/SOLUTIONS/SERVICES OFFERED 185

LIST OF FIGURES

FIGURE 1 MARKET ATTRACTIVENESS ANALYSIS: GLOBAL PROCESS AUTOMATION AND INSTRUMENTATION MARKET 21

FIGURE 2 GLOBAL PROCESS AUTOMATION & INSTRUMENTATION MARKET: MARKET STRUCTURE 23

FIGURE 3 BOTTOM-UP AND TOP-DOWN APPROACHES 28

FIGURE 4 MARKET DYNAMIC ANALYSIS OF THE GLOBAL PROCESS AUTOMATION AND INSTRUMENTATION MARKET 31

FIGURE 5 DRIVER IMPACT ANALYSIS 35

FIGURE 6 RESTRAINT IMPACT ANALYSIS 37

FIGURE 7 VALUE CHAIN ANALYSIS 42

FIGURE 8 PORTER'S FIVE FORCES MODEL: GLOBAL PROCESS AUTOMATION AND INSTRUMENTATION MARKET 44

FIGURE 9 GLOBAL PROCESS AUTOMATION AND INSTRUMENTATION MARKET, BY INSTRUMENT TYPE, 2021 (%) 46

FIGURE 10 GLOBAL PROCESS AUTOMATION AND INSTRUMENTATION MARKET, BY INSTRUMENT TYPE, 2021 VS 2030 (USD MILLION) 47

FIGURE 11 GLOBAL PROCESS AUTOMATION AND INSTRUMENTATION MARKET, BY APPLICATION, 2021 (%) 50

FIGURE 12 GLOBAL PROCESS AUTOMATION AND INSTRUMENTATION MARKET, BY APPLICATION, 2021 VS 2030 (USD MILLION) 50

FIGURE 13 GLOBAL PROCESS AUTOMATION AND INSTRUMENTATION MARKET, BY REGION, 2021 (%) 56

FIGURE 14 GLOBAL PROCESS AUTOMATION AND INSTRUMENTATION MARKET, BY REGION, 2021 VS 2030 (USD BILLION) 57

FIGURE 15 NORTH AMERICA: PROCESS AUTOMATION AND INSTRUMENTATION MARKET, BY COUNTRY, 2021 (%) 59

FIGURE 16 NORTH AMERICA: PROCESS AUTOMATION AND INSTRUMENTATION MARKET, BY COUNTRY, 2021 VS 2030 (USD BILLION) 59

FIGURE 17 NORTH AMERICA PROCESS AUTOMATION AND INSTRUMENTATION MARKET, BY INSTRUMENT TYPE, 2023-2030

(USD BILLION) 60

FIGURE 18 NORTH AMERICA PROCESS AUTOMATION AND INSTRUMENTATION MARKET, BY APPLICATION, 2023-2030(USD BILLION) 61

FIGURE 19 EUROPE: PROCESS AUTOMATION AND INSTRUMENTATION MARKET, BY COUNTRY, 2021 (%) 66

FIGURE 20 EUROPE: PROCESS AUTOMATION AND INSTRUMENTATION MARKET, BY COUNTRY, 2021 VS 2030 (USD BILLION) 66

FIGURE 21 EUROPE PROCESS AUTOMATION AND INSTRUMENTATION MARKET, BY INSTRUMENT TYPE, 2023-2030(USD BILLION) 67

FIGURE 22 EUROPE PROCESS AUTOMATION AND INSTRUMENTATION MARKET, BY APPLICATION, 2018 – 2030 (USD BILLION) 68

FIGURE 23 ASIA-PACIFIC: PROCESS AUTOMATION AND INSTRUMENTATION MARKET, BY COUNTRY, 2021 (%) 74

FIGURE 24 ASIA-PACIFIC: PROCESS AUTOMATION AND INSTRUMENTATION MARKET, BY COUNTRY, 2021 VS 2030 (USD BILLION) 74

FIGURE 25 ASIA-PACIFIC PROCESS AUTOMATION AND INSTRUMENTATION MARKET, BY INSTRUMENT TYPE, 2023-2030(USD BILLION) 75

FIGURE 26 ASIA-PACIFIC PROCESS AUTOMATION AND INSTRUMENTATION MARKET, BY APPLICATION, 2023-2030(USD BILLION) 76

FIGURE 27 MIDDLE EAST & AFRICA PROCESS AUTOMATION AND INSTRUMENTATION MARKET, BY INSTRUMENT TYPE, 2023-2030

(USD BILLION) 82

FIGURE 28 MIDDLE EAST & AFRICA PROCESS AUTOMATION AND INSTRUMENTATION MARKET, BY APPLICATION, 2023-2030

(USD BILLION) 83

FIGURE 29 SOUTH AMERICA PROCESS AUTOMATION AND INSTRUMENTATION MARKET, BY INSTRUMENT TYPE, 2023-2030

(USD BILLION) 84

FIGURE 30 SOUTH AMERICA PROCESS AUTOMATION AND INSTRUMENTATION MARKET, BY APPLICATION, 2023-2030

(USD BILLION) 85

FIGURE 31 GLOBAL PROCESS AUTOMATION & INSTRUMENTATION MARKET: COMPETITIVE BENCHMARKING 88

FIGURE 32 VENDOR SHARE ANALYSIS (2021, %) 91

FIGURE 33 EMERSON ELECTRIC CO.: FINANCIAL OVERVIEW SNAPSHOT 97

FIGURE 34 EMERSON ELECTRIC CO.: SWOT ANALYSIS 103

FIGURE 35 HONEYWELL INTERNATIONAL INC.: FINANCIAL OVERVIEW SNAPSHOT 105

FIGURE 36 BAKER HUGHES COMPANY: SWOT ANALYSIS 108

FIGURE 37 SIEMENS AG: FINANCIAL OVERVIEW SNAPSHOT 110

FIGURE 38 SIEMENS AG: SWOT ANALYSIS 113

FIGURE 39 ABB LTD: FINANCIAL OVERVIEW SNAPSHOT 115

FIGURE 40 ABB. LTD: SWOT ANALYSIS 118

FIGURE 41 SCHNEIDER ELECTRIC SE: FINANCIAL OVERVIEW SNAPSHOT 121

FIGURE 42 SCHNEIDER ELECTRIC SE: SWOT ANALYSIS 124

FIGURE 43 HAWK MEASUREMENT SYSTEMS: SWOT ANALYSIS 127

FIGURE 44 ENDRESS+HAUSER GROUP SERVICES AG: SWOT ANALYSIS 131

FIGURE 45 BADGER METER, INC.: FINANCIAL OVERVIEW SNAPSHOT 137

FIGURE 46 BADGER METER, INC.: SWOT ANALYSIS 139

FIGURE 47 FLEXIM: SWOT ANALYSIS 141

FIGURE 48 MICRONICS LTD: SWOT ANALYSIS 144

FIGURE 49 AMETEK INC.: FINANCIAL OVERVIEW SNAPSHOT 148

FIGURE 50 AMETEK INC.: SWOT ANALYSIS 150

FIGURE 51 TELEDYNE ISCO: FINANCIAL OVERVIEW SNAPSHOT 152

FIGURE 52 TELEDYNE ISCO: SWOT ANALYSIS 154

FIGURE 53 HACH (DANAHER CORPORATION): FINANCIAL OVERVIEW SNAPSHOT 156

FIGURE 54 HACH: SWOT ANALYSIS 158

FIGURE 55 NIVUS GMBH: SWOT ANALYSIS 162

FIGURE 56 VEGA GRIESHABER KG: SWOT ANALYSIS 169

FIGURE 57 SICK AG: FINANCIAL OVERVIEW SNAPSHOT 171

FIGURE 58 SICK AG: SWOT ANALYSIS 174

FIGURE 59 SONTEK (XYLEM): FINANCIAL OVERVIEW SNAPSHOT 182

FIGURE 60 SONTEK: SWOT ANALYSIS 183

FIGURE 61 GE PANAMETRICS (BAKER HUGHES): FINANCIAL OVERVIEW SNAPSHOT 184

FIGURE 62 GE PANAMETRICS: SWOT ANALYSIS 186

Purchase Option
Single User $ 4,950
Multiuser License $ 5,950
Enterprise User $ 7,250
Compare Licenses
Tailored for You
  • Dedicated Research on any specifics segment or region.
  • Focused Research on specific players in the market.
  • Custom Report based only on your requirements.
  • Flexibility to add or subtract any chapter in the study.
  • Historic data from 2014 and forecasts outlook till 2040.
  • Flexibility of providing data/insights in formats (PDF, PPT, Excel).
  • Provide cross segmentation in applicable scenario/markets.