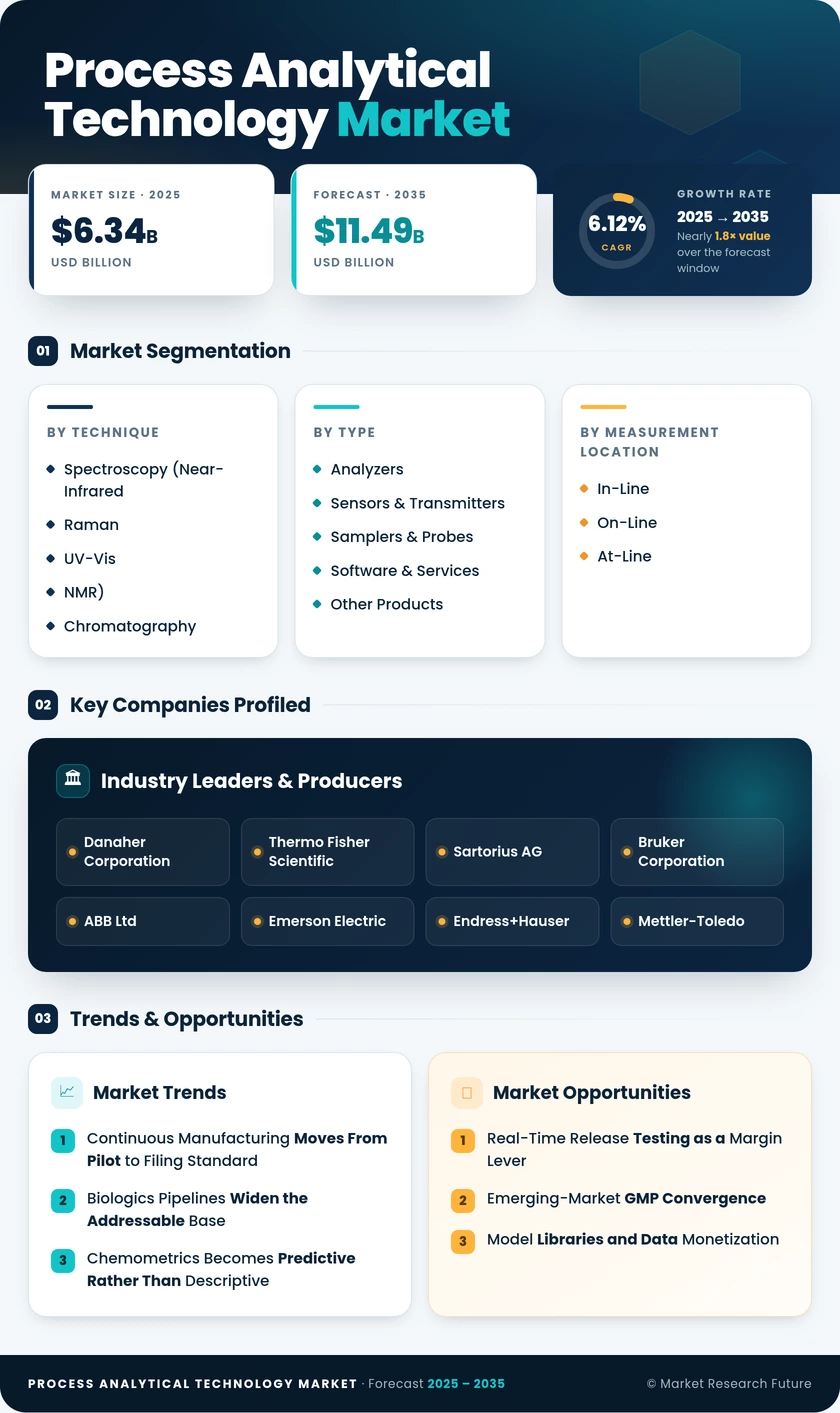
Process Analytical Technology Market (2026 - 2035)

Process Analytical Technology Market Research Report By Technology (Spectroscopy, Chromatography, Mass Spectrometry, Flow Cytometry), By Application (Pharmaceuticals, Biotechnology, Food and Beverage, Chemical Processing), By End Use (Quality Control, Research and Development, Production Monitoring), By Product Type (Software, Hardware, Services) and By Regional (North America, Europe, South America, Asia Pacific, Middle East and Africa) - Growth & Industry Forecast 2025 To 2035

Forecast Period
2026-2035
CAGR
6.12%
2025 Market Size
USD 6.34 Billion
2035 Market Size
USD 11.49 Billion
Healthcare ● Updated August 2026 Report ID: MRFR/HC/1722-HCR | Pages: 200 | Author: Satyendra Maurya, Rahul Gotadki
  1. 1 Market Summary |
    1. 1.1 Study Assumptions & Market Definition |
    2. 1.2 Scope of the Study |
    3. 1.3 Research Methodology
  2. 2 Key Report Takeaways |
    1. 2.1 By Technology |
    2. 2.2 By Sector |
    3. 2.3 By Geography
  3. 3 Market Size & Forecast (2021–2035) |
    1. 3.1 Historical Market Size (2021–2025) |
    2. 3.2 Current & Forecast Market Size (2026–2035) |
    3. 3.3 Year-over-Year Growth Analysis
  4. 4 Driver Impact Analysis |
    1. 4.1 Continuous Manufacturing Moves From Pilot to Filing Standard |
    2. 4.2 Biologics Pipelines Widen the Addressable Base |
    3. 4.3 Chemometrics Becomes Predictive Rather Than Descriptive |
    4. 4.4 Probe Economics Cross the SME Threshold
  5. 5 Restraints Impact Analysis |
    1. 5.1 Capital Intensity Still Gates Adoption |
    2. 5.2 The Talent Bottleneck Is Structural, Not Cyclical |
    3. 5.3 Validation Overhead Slows the Clock
  6. 6 Opportunities |
    1. 6.1 Real-Time Release Testing as a Margin Lever |
    2. 6.2 Emerging-Market GMP Convergence |
    3. 6.3 Model Libraries and Data Monetization |
    4. 6.4 Cell and Gene Therapy Non-Invasive Measurement |
    5. 6.5 Water and Wastewater Compliance Analytics
  7. 7 Regional Market Share & Country-Level Analysis |
    1. 7.1 North America | |
      1. 7.1.1 US | |
      2. 7.1.2 Canada | |
      3. 7.1.3 Mexico |
    2. 7.2 Europe | |
      1. 7.2.1 Germany | |
      2. 7.2.2 UK | |
      3. 7.2.3 France | |
      4. 7.2.4 Italy | |
      5. 7.2.5 Spain | |
      6. 7.2.6 Nordic Countries | |
      7. 7.2.7 Russia | |
      8. 7.2.8 Rest of Europe |
    3. 7.3 Asia-Pacific | |
      1. 7.3.1 China | |
      2. 7.3.2 India | |
      3. 7.3.3 Japan | |
      4. 7.3.4 South Korea | |
      5. 7.3.5 ASEAN | |
      6. 7.3.6 Rest of Asia-Pacific |
    4. 7.4 South America | |
      1. 7.4.1 Brazil | |
      2. 7.4.2 Argentina | |
      3. 7.4.3 Rest of South America |
    5. 7.5 Middle East & Africa | |
      1. 7.5.1 Saudi Arabia | |
      2. 7.5.2 UAE | |
      3. 7.5.3 South Africa | |
      4. 7.5.4 Egypt | |
      5. 7.5.5 Rest of Middle East & Africa
  8. 8 Future Outlook (2026–2035) |
    1. 8.1 Autonomous Process Control |
    2. 8.2 Platform Economics Displace Instrument Economics |
    3. 8.3 Sustainability Reporting Pulls Process Data Upstream |
    4. 8.4 Convergence With Digital Twins
  9. 9 Market Segmentation Analysis |
    1. 9.1 By Technique | |
      1. 9.1.1 Spectroscopy (Near-Infrared, Raman, UV-Vis, NMR) | |
      2. 9.1.2 Chromatography | |
      3. 9.1.3 Particle Size Analysis | |
      4. 9.1.4 Capillary Electrophoresis | |
      5. 9.1.5 Other Techniques |
    2. 9.2 By Product | |
      1. 9.2.1 Analyzers | |
      2. 9.2.2 Samplers & Probes | |
      3. 9.2.3 Sensors & Transmitters | |
      4. 9.2.4 Software & Services | |
      5. 9.2.5 Other Products |
    3. 9.3 By Measurement Location | |
      1. 9.3.1 In-Line | |
      2. 9.3.2 On-Line | |
      3. 9.3.3 At-Line |
    4. 9.4 By End-User Industry | |
      1. 9.4.1 Pharmaceutical & Biotechnology | |
      2. 9.4.2 Food & Beverage | |
      3. 9.4.3 Chemical & Petrochemical | |
      4. 9.4.4 Water & Wastewater | |
      5. 9.4.5 Oil & Gas | |
      6. 9.4.6 Other End Users
  10. 10 Competitive Landscape |
    1. 10.1 Market Share Analysis (2026) |
    2. 10.2 Competitive Benchmarking Matrix |
    3. 10.3 Company Profiles | |
      1. 10.3.1 Danaher Corporation | |
      2. 10.3.2 Thermo Fisher Scientific | |
      3. 10.3.3 Sartorius AG | |
      4. 10.3.4 Bruker Corporation | |
      5. 10.3.5 ABB Ltd | |
      6. 10.3.6 Emerson Electric | |
      7. 10.3.7 Endress+Hauser | |
      8. 10.3.8 Mettler-Toledo | |
      9. 10.3.9 Agilent Technologies | |
      10. 10.3.10 Shimadzu Corporation | |
      11. 10.3.11 Yokogawa Electric | |
      12. 10.3.12 Repligen Corporation
  11. 11 Recent News & Developments
  12. 12 Report Scope & Methodology |
    1. 12.1 Study Period & Base Year |
    2. 12.2 Data Sources & Citations |
    3. 12.3 Abbreviations
  13. 13 Detailed Sources & Citations
  14. 14 Frequently Asked Questions
  15. 15 LIST OF TABLES |
  16. TABLE 1 Global Process Analytical Technology Market Size & Forecast, by Revenue (USD Billion), 2021–2035 |
  17. TABLE 2 Global Process Analytical Technology Market — Year-over-Year Growth Analysis, 2021–2035 |
  18. TABLE 3 Driver Impact Analysis Matrix, 2026–2035 |
  19. TABLE 4 Restraint Impact Analysis Matrix, 2026–2035 |
  20. TABLE 5 Global Market Size, by Technique, 2021–2035 (USD Billion) |
  21. TABLE 6 Global Market Size, by Product, 2021–2035 (USD Billion) |
  22. TABLE 7 Global Market Size, by Measurement Location, 2021–2035 (USD Billion) |
  23. TABLE 8 Global Market Size, by End-User Industry, 2021–2035 (USD Billion) |
  24. TABLE 9 Global Market Size, by Region, 2021–2035 (USD Billion) |
  25. TABLE 10 North America Market Size, by Country, 2021–2035 (USD Billion) |
  26. TABLE 11 Europe Market Size, by Country, 2021–2035 (USD Billion) |
  27. TABLE 12 Asia-Pacific Market Size, by Country, 2021–2035 (USD Billion) |
  28. TABLE 13 South America Market Size, by Country, 2021–2035 (USD Billion) |
  29. TABLE 14 Middle East & Africa Market Size, by Country, 2021–2035 (USD Billion) |
  30. TABLE 15 North America Market Size, by Technique, 2021–2035 (USD Billion) |
  31. TABLE 16 North America Market Size, by End-User Industry, 2021–2035 (USD Billion) |
  32. TABLE 17 Europe Market Size, by Technique, 2021–2035 (USD Billion) |
  33. TABLE 18 Europe Market Size, by End-User Industry, 2021–2035 (USD Billion) |
  34. TABLE 19 Asia-Pacific Market Size, by Technique, 2021–2035 (USD Billion) |
  35. TABLE 20 Asia-Pacific Market Size, by End-User Industry, 2021–2035 (USD Billion) |
  36. TABLE 21 South America Market Size, by Product, 2021–2035 (USD Billion) |
  37. TABLE 22 Middle East & Africa Market Size, by Product, 2021–2035 (USD Billion) |
  38. TABLE 23 Competitive Benchmarking Matrix, 2026 |
  39. TABLE 24 Company Profiles — Key Players |
  40. TABLE 25 Recent Developments & Strategic Announcements, 2023–2025 |
  41. TABLE 26 Report Scope & Methodology Summary |
  42. TABLE 27 Detailed Sources & Citations Index
  43. 16 LIST OF FIGURES |
  44. FIGURE 1 Market Dynamics — Drivers, Restraints and Opportunities Overview |
  45. FIGURE 2 Industry Value Chain Analysis |
  46. FIGURE 3 Porter's Five Forces Analysis |
  47. FIGURE 4 Global Market Size Trend, 2021–2035 (USD Billion) |
  48. FIGURE 5 Year-over-Year Growth Curve, 2022–2035 (%) |
  49. FIGURE 6 Segment Share by Technique, 2025 vs 2035 (%) |
  50. FIGURE 7 Segment Share by Product, 2025 vs 2035 (%) |
  51. FIGURE 8 Segment Share by Measurement Location, 2025 (%) |
  52. FIGURE 9 Segment Share by End-User Industry, 2025 (%) |
  53. FIGURE 10 Regional Share Distribution, 2025 (%) |
  54. FIGURE 11 Regional CAGR Comparison, 2026–2035 (%) |
  55. FIGURE 12 Country-Level Contribution Heatmap, 2025 |
  56. FIGURE 13 Competitive Landscape — Estimated Revenue Share Bands, 2026 |
  57. FIGURE 14 Strategic Positioning Matrix — Portfolio Breadth vs Recurring Revenue Mix |
  58. FIGURE 15 Technology Adoption S-Curve, 2021–2035
Share::
Request Free Sample

Segmentation Quick Reference

DimensionSub-SegmentsDominant SegmentFastest Growing Segment
By TechniqueSpectroscopy (Near-Infrared, Raman, UV-Vis, NMR), Chromatography, Particle Size Analysis, Capillary Electrophoresis, Other TechniquesSpectroscopySpectroscopy
By ProductAnalyzers, Samplers & Probes, Sensors & Transmitters, Software & Services, Other ProductsAnalyzersSoftware & Services
By Measurement LocationIn-Line, On-Line, At-LineIn-LineIn-Line
By End-User IndustryPharmaceutical & Biotechnology, Food & Beverage, Chemical & Petrochemical, Water & Wastewater, Other End UsersPharmaceutical & BiotechnologyPharmaceutical & Biotechnology
By GeographyNorth America, Europe, Asia-Pacific, South America, Middle East & AfricaNorth AmericaAsia-Pacific


Market Segmentation Overview

By Technique

Sub-SegmentKey Trend
Spectroscopy (Near-Infrared, Raman, UV-Vis, NMR)Probe miniaturization and model transfer tools shorten deployment cycles
ChromatographyRetains reference-method status for validation of faster in-line techniques
Particle Size AnalysisCrystallization and granulation endpoint control drives continuous-line demand.
Capillary ElectrophoresisCharge variant characterization expands with biosimilar filings.
Other TechniquesMass spectrometry and dielectric sensing gain traction in bioprocessing.


Technique selection increasingly follows the physical constraints of single-use equipment rather than analytical preference. Methods that read through disposable barriers win by default in biologics suites, which is why optical approaches keep extending their lead over sampling-dependent alternatives.

By Product

Sub-SegmentKey Trend
AnalyzersModular architectures replace fixed-configuration units
Samplers & ProbesSingle-use compatible interfaces become the default specification.
Sensors & TransmittersMulti-point instrumentation density rises on continuous lines.
Software & ServicesModel lifecycle governance shifts to subscription contracts
Other ProductsCalibration standards consolidate around vendor ecosystems.


Product mix is migrating steadily toward recurring revenue. Instrument makers now compete on the quality of their model libraries and validation support as much as on hardware specification, and buyers increasingly evaluate total cost across a ten-year lifecycle rather than at point of purchase.

By Measurement Location

Sub-SegmentKey Trend
In-LineDirect insertion becomes standard in greenfield continuous designs.
On-LineAutomated diversion loops serve applications where fouling risk is high.
At-LineFunctions as a transitional step for sites de-risking full integration


Location choice is a proxy for organizational maturity. Sites early in their journey buy at-line instruments they can move; sites with established control strategies commit to permanent in-line positions engineered into the piping from the start.

By End-User Industry

Sub-SegmentKey Trend
Pharmaceutical & BiotechnologyRegulatory pathways convert analytics from optional to structural
Food & BeverageExport contracts specify continuous quality data as a commercial term.
Chemical & PetrochemicalYield and energy-intensity gains carry the investment case.
Water & WastewaterMicropollutant monitoring obligations create municipal demand.
Other End UsersSemiconductor and specialty materials adopt selectively.


Applications in biotechnology and pharmaceuticals are growing structurally significant as regulatory processes make analytics crucial, and food and beverage manufacturers are increasingly demanding continuous quality data in export agreements. Micropollutant monitoring regulations support water and wastewater demand, while yield and energy-efficiency improvements are used by chemical and petrochemical users to justify investment. Analytics is being used judiciously by semiconductor and specialized material manufacturers according to process requirements.




Share::
Request Free Sample
Download PDF ×

We do not share your information with anyone. However, we may send you emails based on your report interest from time to time. You may contact us at any time to opt-out.