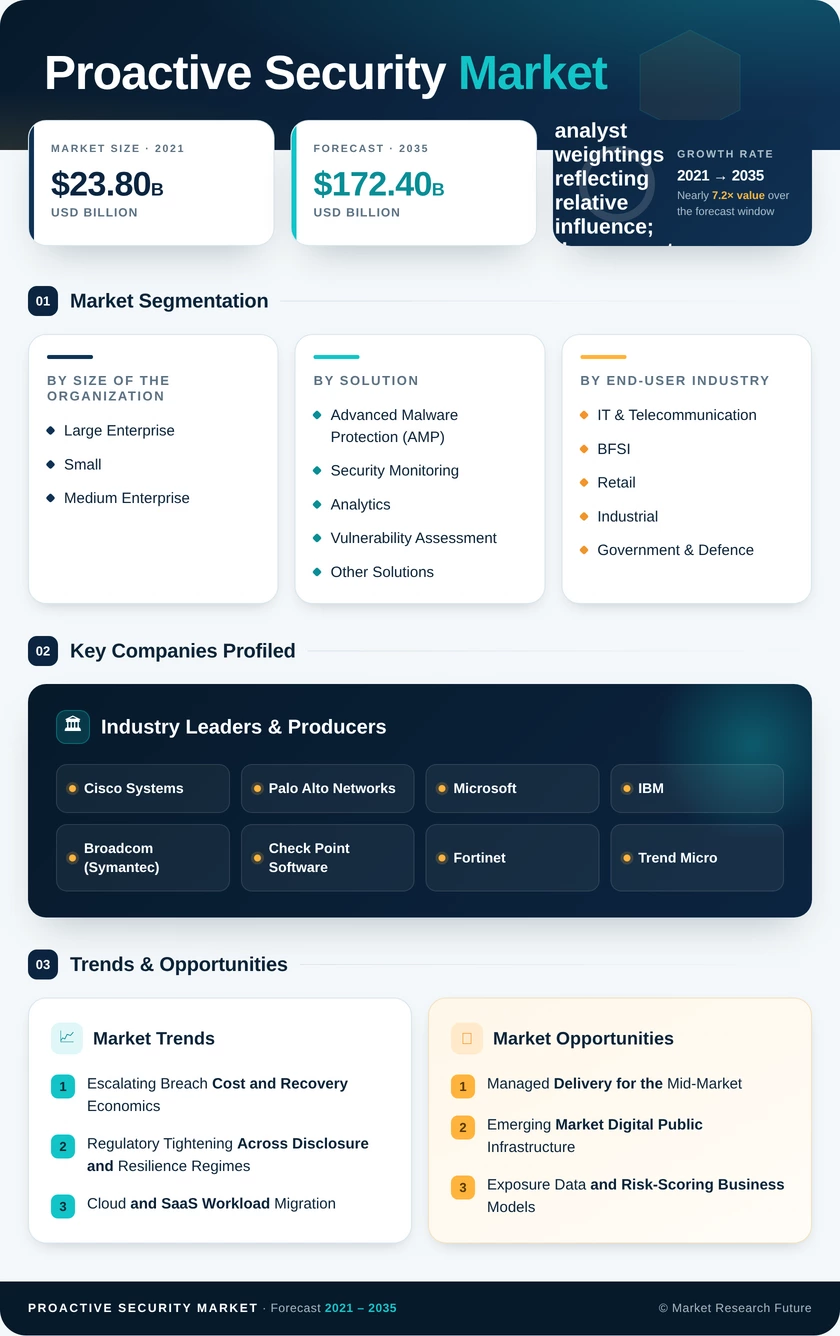
Market Segmentation Analysis
By Size of the Organization
9.1.1 Large Enterprise
9.1.2 Small and Medium Enterprise
By Solution
9.2.1 Advanced Malware Protection (AMP)
9.2.2 Security Monitoring and Analytics
9.2.3 Vulnerability Assessment
9.2.4 Other Solutions
By End-user Industry
9.3.1 IT & Telecommunication
9.3.2 BFSI
9.3.3 Retail
9.3.4 Industrial
9.3.5 Government & Defence
9.3.6 Other End-user Industries
| Dimension | Sub-Segments | Dominant Segment | Fastest Growing Segment |
| By Size of the Organization | Large Enterprise; Small and Medium Enterprise | Large Enterprise (68.4% share, 2025) | Small and Medium Enterprise (18.4% CAGR) |
| By Solution | Advanced Malware Protection (AMP); Security Monitoring and Analytics; Vulnerability Assessment; Other Solutions | Security Monitoring and Analytics (34.6% share, 2025) | Vulnerability Assessment (17.6% CAGR) |
| By End-user Industry | IT & Telecommunication; BFSI; Retail; Industrial; Government & Defence; Other End-user Industries | IT & Telecommunication (26.8% share, 2025) | Government & Defence (17.9% CAGR) |
Market Segmentation Overview
By Size of the Organization
| Sub-Segment | Key Trend |
| Large Enterprise | Consolidation of point tools into unified exposure platforms with API-level integration into existing workflow systems |
| Small and Medium Enterprise | Shift from direct licensing to managed delivery, with insurance requirements acting as the initial purchase trigger. |
Large Enterprise buyers hold the dominant position at 68.4% of 2025 revenue because multi-cloud estates and audit obligations justify platform-scale contracts that smaller firms cannot absorb. Small and Medium Enterprise demand grows fastest at 18.4% CAGR. Still, almost entirely through managed service providers rather than direct sales — the segment lacks the security engineering headcount to operate these tools unaided. That structural difference means vendors serving both bands must maintain two distinct go-to-market motions, and channel margin economics increasingly determine which vendors win mid-market share.
By Solution
| Sub-Segment | Key Trend |
| Advanced Malware Protection (AMP) | Capability absorption into broader endpoint platforms, compressing standalone pricing |
| Security Monitoring and Analytics | Ingestion-based pricing models and tiered retention to control telemetry cost growth |
| Vulnerability Assessment | Repositioning around exploitability-weighted exposure scoring rather than raw severity ranking |
| Other Solutions | Attack surface discovery and deception technology emerging as distinct budget lines |
Security Monitoring and Analytics leads at 34.6% share because compressed regulatory reporting windows — six hours in India, four business days for U.S. filers — make telemetry infrastructure a compliance prerequisite rather than an optional capability. Vulnerability Assessment grows fastest at 17.6% CAGR as buyers reject severity-only prioritisation that generates unclearable backlogs and adopt exploitability-weighted scoring instead. Advanced Malware Protection (AMP) retains the second-largest revenue base but faces margin pressure as endpoint platforms bundle the capability at no incremental charge.
By End-user Industry
| Sub-Segment | Key Trend |
| IT & Telecommunication | Service provider obligations extending security requirements through downstream customer contracts |
| BFSI | Convergence of fraud analytics and security telemetry into shared data platforms |
| Retail | Payment card control deadlines driving authenticated scanning and script integrity deployment. |
| Industrial | Passive asset discovery and protocol-aware monitoring for operational technology estates |
| Government & Defence | Sovereign security operations centre build-outs with localised hosting requirements |
| Other End-user Industries | Healthcare and education modernisation funded through public grant programmes |
IT & Telecommunications holds a 26.8% share because these organisations carry both their own exposure and contractual security obligations to every downstream customer they serve. Government & Defence expands fastest at 17.9% CAGR, funded directly by national programmes in Saudi Arabia, Australia and across the European Union, with contract durations and localisation requirements that differ materially from commercial procurement. Industrial and Retail occupy the middle tier — Retail on payment control deadlines, Industrial on the slower but structurally larger operational technology retrofit cycle.


 Noah Malgeri
Co-Founder

 Peter Groot koerkamp
Account and Business Manager

 Younghwan Choi
Senior Retail Manager

 Mark Irwin
Management Consultant

 Akif Moroglu
Strategy & Business Development Director

 Guilherme Gomes Martins
Product Management Director

 Joseph Aguayo
Sales Operations & Pricing Manager

 La Terria Dodd
Program Support Specialist

 Rob Kooiker
Group Product Manager HVAC & Fire Protection GMA